Algorithms
Specification of .analytic's analysis algorithms, their benefits, and application.
Overview
Analytics pursues one goal: Guiding stakeholders in buildings (asset-, property-, facility management) to improve the operational performance of buildings and energy systems. The benefits are multilateral:
- Fast success decarbonizing the building and energy system.
- Higher energy efficiency providing comfort and energy services.
- Higher indoor comfort, means higher well-being and therefore performance of people in buildings.
- More reliable technical building equipment, less wear, and more efficient maintenance.
This page offers specifications on the available analysis functions. Each specification starts with an introduction to the analysis, followed by tabs providing deeper insights and application notes. Browse the tabs for insights in the analysis specifications.
This tab summarizes the value offered by the analysis function, the component types the analysis is recommended for, and the conditions checked by the analysis.
Expect a short case-study on how the analysis function was applied during development or a test bench.
Results of analytics functions are structured to deliver simple-to-navigate insights and fast-to-apply measures on how to improve operational performance.
Therefore, each result regardless of the analytics function includes
- One qualitative warning level, aka. signal color,
- One interpretation,
- Zero to one summary KPI,
- Zero to n recommendations,
- Zero to n KPIs,
- Zero to n plots, and
- Zero to n timeseries.
These categories are explained below. While the warning level, interpretation, and recommendation are specified for all analysis functions equally, summary KPIs, KPIs, plots, and time series differ between each analysis function.
Warning level
The warning level represents the urgency of looking into the analyzed condition and taking action to improve it. It can have one of these traffic light states, but not every analysis makes use of the full spectrum:
Red: Suboptimal performance identified. It can be expected that either improving the identified condition will have a strong effect on the performance or the effort to realize the optimization is moderate compared to its benefit.
Yellow: Suboptimal performance identified. The effort to optimize might consume its benefit. To reduce the effort, implement the measure with the maintenance work that is required anyway. Observation of the analyzed condition is recommended.
Green: Performance is satisfactory. No action is recommended.
Interpretation
The interpretation delivers a summary of the observed performance and state of the condition analyzed. It describes either a symptom of a suboptimal operation or a condition that could be identified.
Recommendation
Recommendations are summarized in a list of zero (for sufficient operational performance) to n measurements on how to improve the operational performance. The recommendations either help by providing information on how to correct the source of the symptom itself or on how to narrow down to its root cause.
Plots
It is easy to understand complex data insights with the right visualization. Thus, many .analytics algorithms offer plotting recommendations including the type of plot, data, and labeling. This structured and well defined plotting data makes it easy to transport data insights.
Available plot types
| Name | Type identifier |
|---|---|
| Bar chart | bar_chart |
| Pie chart | pie_chart |
| Gauge chart | gauge_chart |
| Bullet graph | bullet_graph |
Included data structures
| Key | Info |
|---|---|
| data | Contains the dataset including its "name" and a list of "values" |
| categories | If data contains multiple values, categories can be passed for each. In this case, categories and values are associated by their identical list index. E.g. "values":[50.13, 49.87, 49.01] "categories":["March", "April", "May"] |
| extras | Can contain plottable information, such as thresholds. The thresholds for most plots are static, but Wellbeing thresholds are based on what data is available |
| identifier | Frontend placement context |
| title | Title that is placed above the plot |
| type | Which of the plot types listed above is to be displayed |
| unit | The unit of the plot dataset |
Summary KPIs, KPIs, and time series
KPIs and time series offer insights and transparency, while the most important KPI is offered as summary KPI including its current value and KPI development compared to the previous analysis. They enable reporting and manual investigation of the operational behavior of the component or system analyzed. KPIs and time series are highly individual for each function and are explained in the respective specification of each analysis function in Results.
The Components tab contains the information on how to configure the algorithm for the specific components.
- The components the analysis function is available for,
- The pins of the components which need to be mapped, and
- The attributes of the component required.
The Application tab provides information on the application of the analysis function.
- Recommended time span: Most of the analysis functions have a sweet spot for the amount of historical data required to derive accurate results.
- Recommended repetition: Components of building energy systems are subject to seasonal effects and wear out. Follow the recommended repetition to ensure the analysis is performed as often as necessary, without risking blind spots during the continuous monitoring of the system.
The Further information tab provides supplementary information about possible analysis results. Based on the respective and concise interpretation message, a technical explanation is given.
"Interpretation message"
Explanation
A detailed description of the analysis result.
Suggestion
A detailed description of the given recommendations.
Analysis functions
See below for the individual analysis function specification.
Alarm State
The Alarm State analysis assesses the occurrences and duration of alarm messages of a component. It is particularly useful for notifying the user when alarm messages have been overseen, as it summarizes the alarm messages over a given time period. Additionally, the Alarm State analysis considers the most recent alarm message to determine whether the error has been resolved. While this analysis can be used for all alarm messages, it is most suited to critical alarm messages.
Value
- Avoids alarm messages being overlooked
- Identifies faulty components
- Can reduce component wear-and-tear
- Can increase energy efficiency
Recommended for components
Any component or subsystem which could have an alarm or error message such as:
- Fans
- Heat pumps
- Thermal control loops
Checked conditions
- Last state of alarm message
- Relative duration of alarm message
- Total duration of alarm messages
- Total occurrences of alarm message
The Alarm State analysis was performed on a component for February 2020. The error message is active at the beginning of the time period and then about twice a week after that.
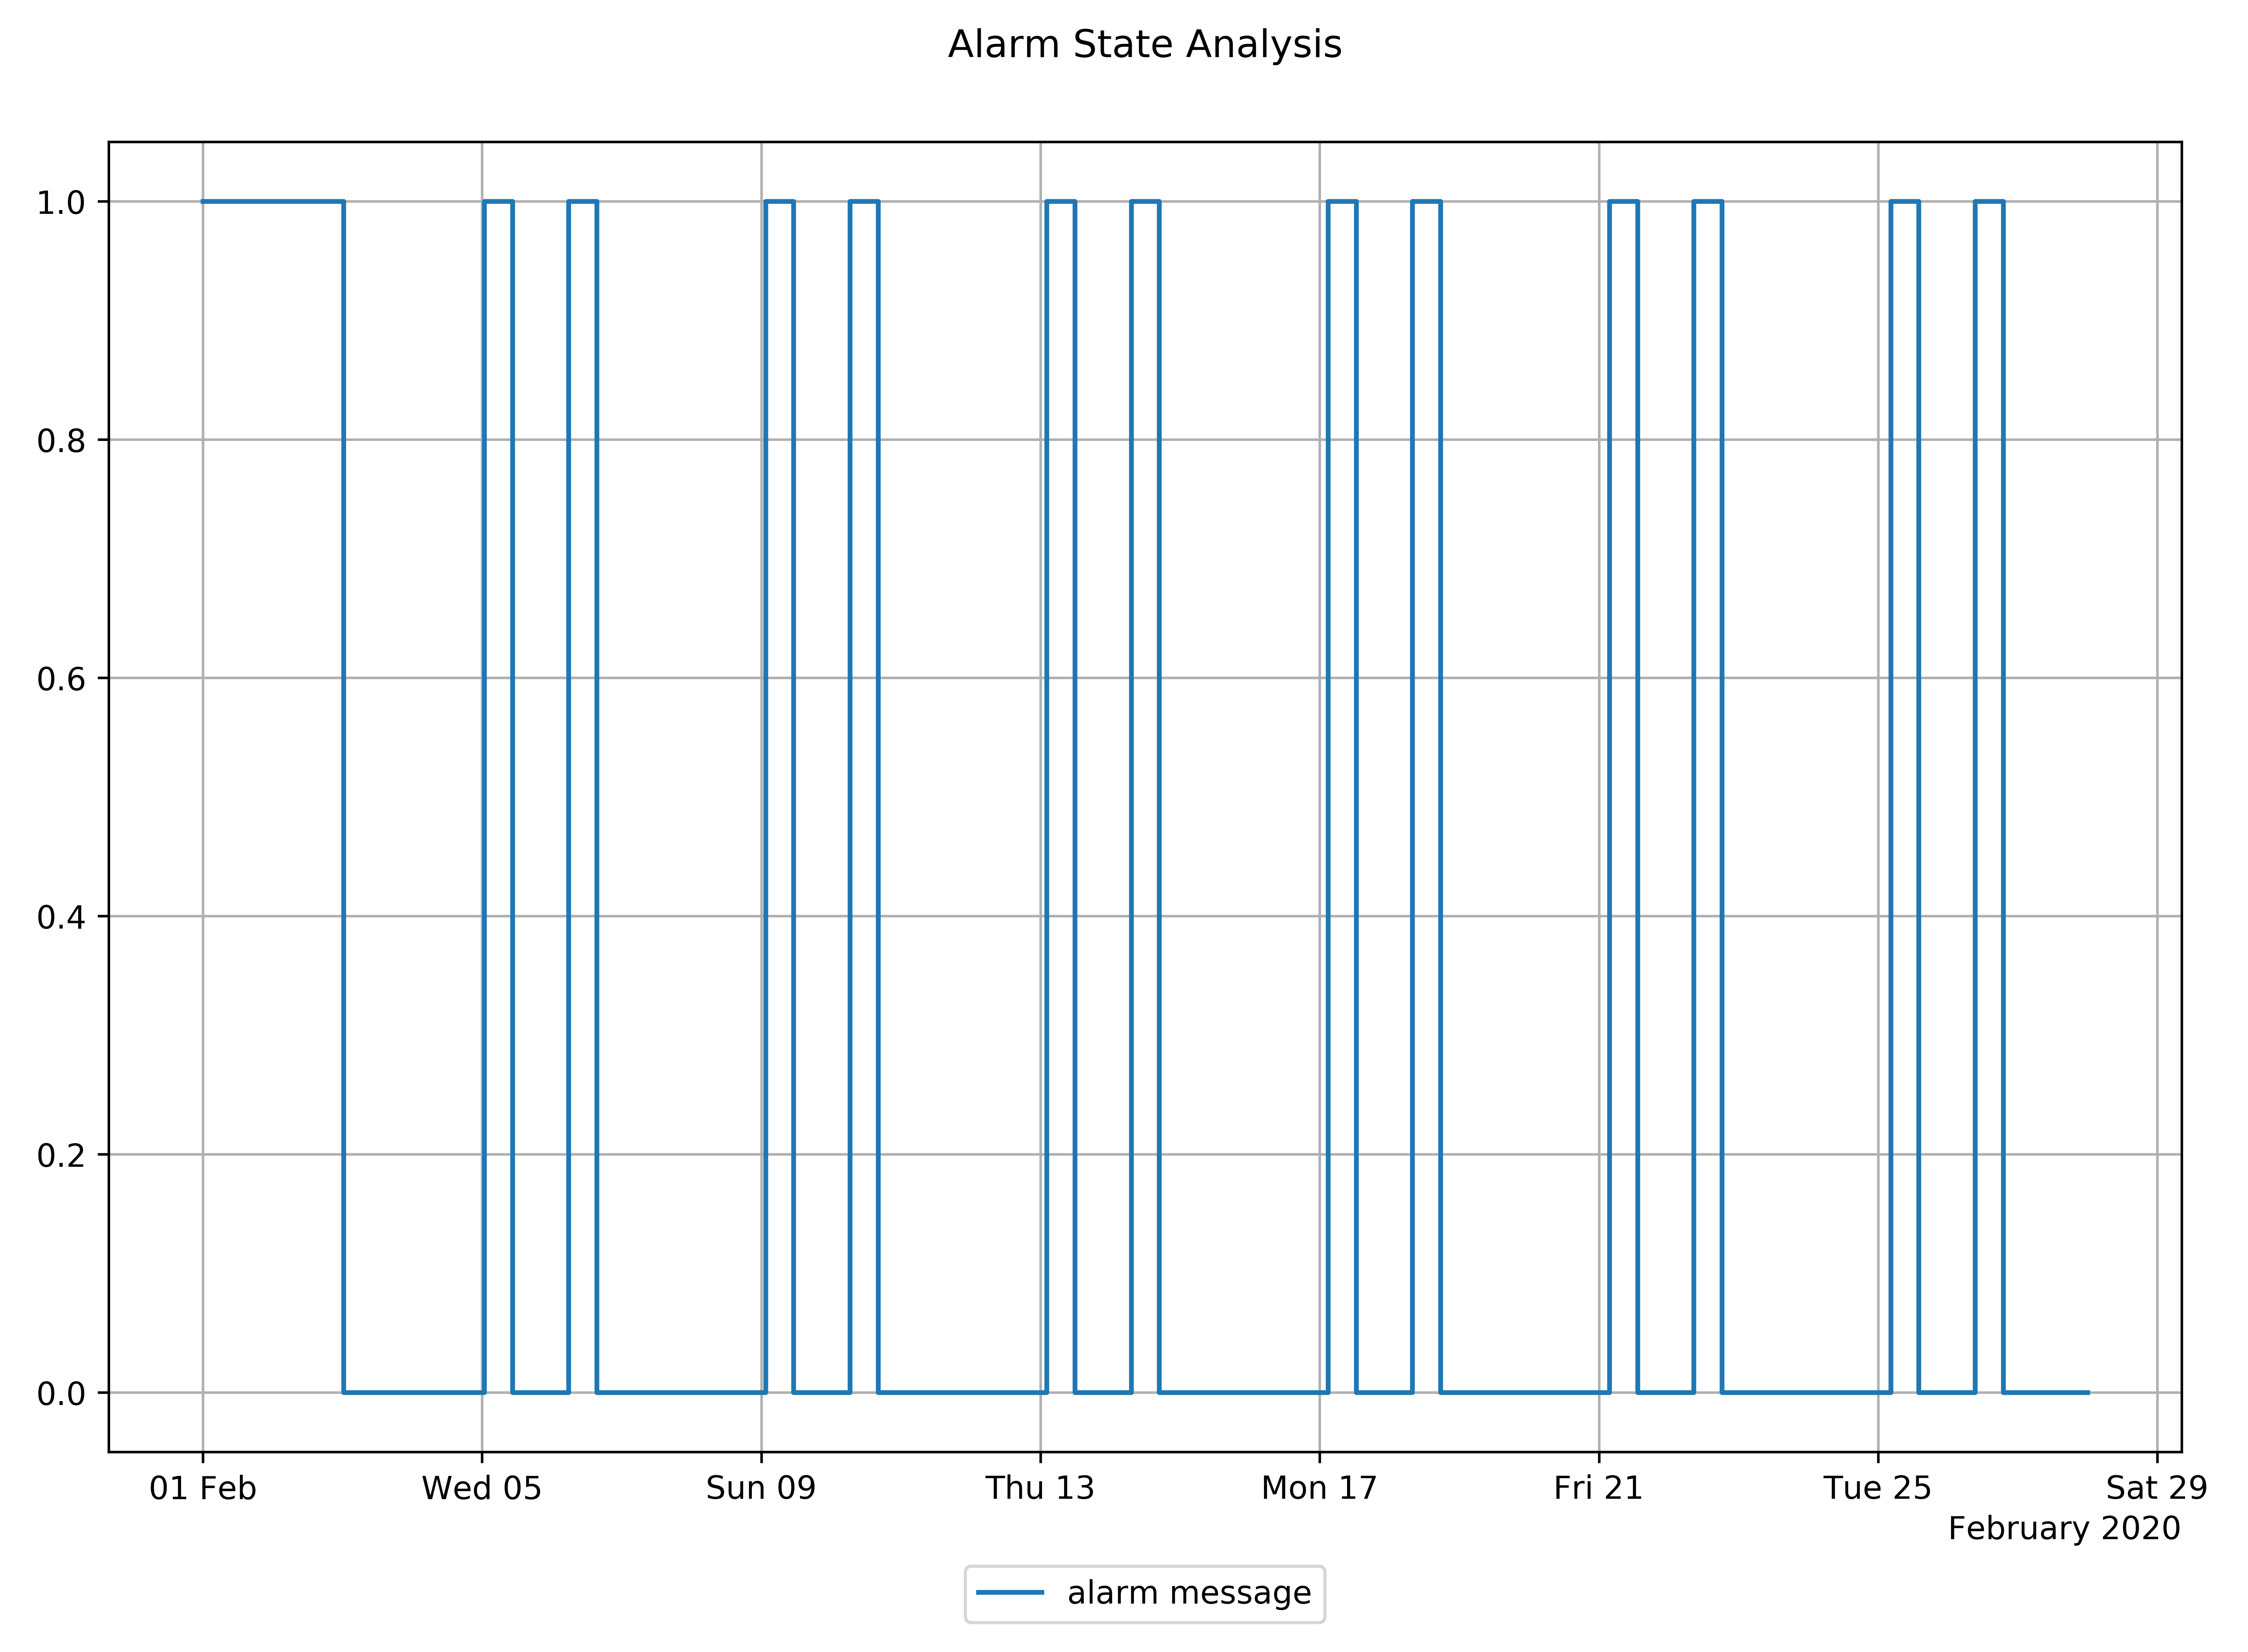
Figure 1: Component error message for the month of February 2020
The analysis returns a red warning message to indicate that the error message over the time period is suboptimal. This is because the error message is active for a significant percentage of the total time.
| KPI | Value | Unit |
|---|---|---|
| alarm message.last observation | inactive | binary |
| alarm message.relative | 25.4 | % |
| alarm message.duration | 164 | h |
| alarm message.count | 12 | count |
Signal colors
| Signal color | Available | Info |
|---|---|---|
| red | Yes | The occurrences or alarm message duration is high and the alarm is active at the end of the analysis. |
| yellow | Yes | The occurrences or alarm message duration is high. |
| green | Yes | The occurrences and alarm message duration are insignificant. |
Interpretations
| Available | Info |
|---|---|
| Yes | Interpretations summarize the result of the analysis. |
Recommendations
| Available | Info |
|---|---|
| Yes | Check the component for physical damage and consider changing the component setting. |
KPIs
Summary of alarm messages
| KPI Identifier | Info | Value Range | Unit |
|---|---|---|---|
| alarm message.last observation | Last available alarm message. | Active, Inactive | binary |
| alarm message.relative | Time of active alarm message as a percentage of total time. | 0 to 100 | % |
| alarm message.duration | Total time of active alarm message. | 0 to inf | h |
| alarm message.count | Occurrences of the alarm message. | 0 to inf | count |
| Pin | Required | Mapping info |
|---|---|---|
| Alarm message | Yes | - |
| Pin | Required | Mapping info |
|---|---|---|
| Alarm message | Yes | - |
| Pin | Required | Mapping info |
|---|---|---|
| Alarm message | Yes | - |
| Pin | Required | Mapping info |
|---|---|---|
| Alarm message | Yes | - |
| Pin | Required | Mapping info |
|---|---|---|
| Alarm message | Yes | - |
| Pin | Required | Mapping info |
|---|---|---|
| Alarm message | Yes | - |
| Pin | Required | Mapping info |
|---|---|---|
| Alarm message | Yes | - |
| Pin | Required | Mapping info |
|---|---|---|
| Alarm message | Yes | - |
| Pin | Required | Mapping info |
|---|---|---|
| Alarm message | Yes | - |
| Pin | Required | Mapping info |
|---|---|---|
| Alarm message | Yes | - |
| Pin | Required | Mapping info |
|---|---|---|
| Alarm message | Yes | - |
| Pin | Required | Mapping info |
|---|---|---|
| Alarm message | Yes | - |
| Pin | Required | Mapping info |
|---|---|---|
| Alarm message | Yes | - |
Recommended Time Span
1 month
Recommended Repetition
Every month
- After changes of operational modes, e.g., transfers to heating mode
- After changes in the control system
- After maintenance of replacements
CO2 Emissions
The CO2 Emissions analysis aggregates CO2 emissions caused by the consumed energy indicated by the meter components of the building during the analysis period. The CO2 emissions are related to the net floor area of the building and are benchmarked against the usual emissions for the same type of building.
Value
- ESG-Reporting and monitoring of CO2 emissions
- Insights in CO2 performance of the building
- CO2 emission benchmarking
- Trace back CO2 emissions to energy sources
- Additional weather normalization of the CO2 emissions
- Prediction of yearly CO2 emissions based on weather-normalized extrapolation
Recommended for components
Complete buildings or energy systems
Checked conditions
- CO2 emissions of the building or system
- Benchmarking
- Emission by energy source
This example shows the results of an CO2 Emission analysis displayed in the Asset Overview.
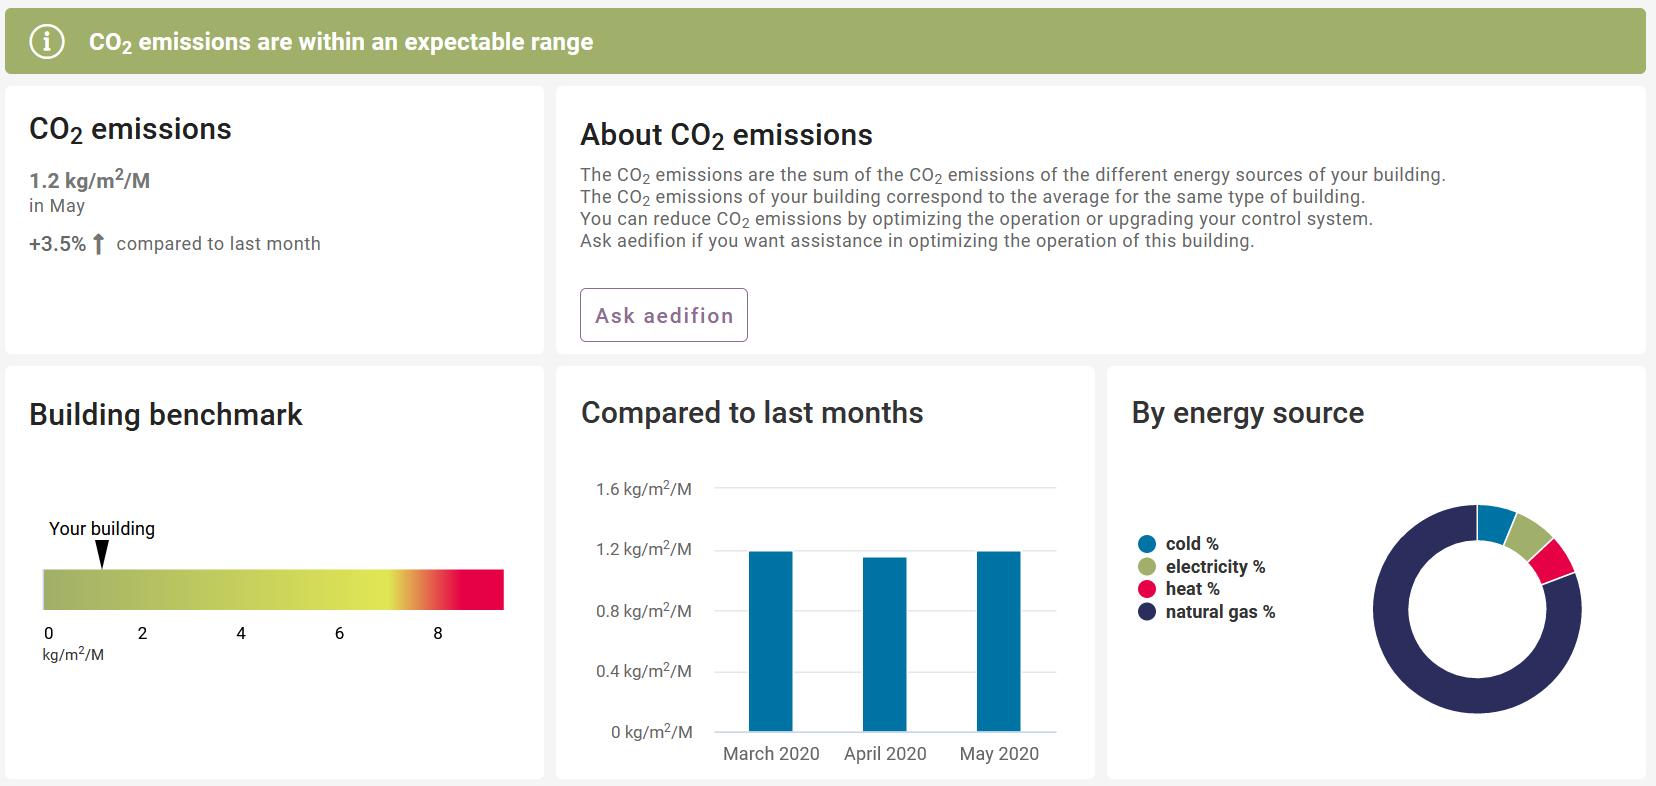
Figure 1: CO2 emissions Asset Overview result overview
Above all cards the interpretation text of the result is highlighted with the signal color of the result. In the top left the current KPI and the monthly trend is shown. On the right side of that you will find the recommendations of this result as well as further information about the function.
The three plots below are:
- The building benchmark
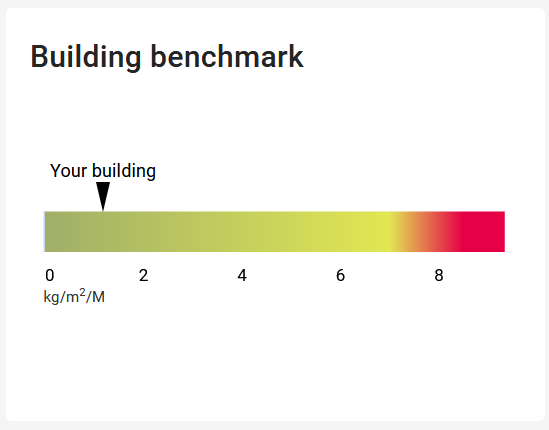
Figure 2: CO2 emissions Asset Overview plot bullet graph
The current KPI is plotted inside a bullet graph between the limits of the signal color.
- Compared to last months
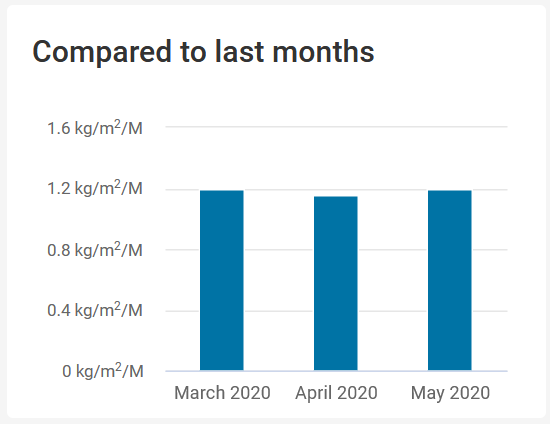
Figure 3: CO2 emissions Asset Overview plot month comparison
The plot shows the current KPI of the last three months, including the month of the analysis.
- By energy source
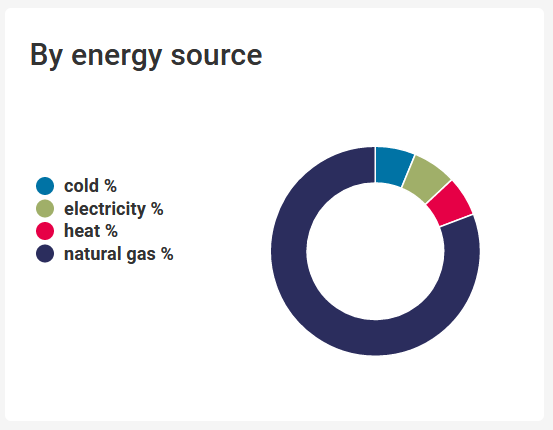
Figure 4: CO2 emissions Asset Overview plot energy source
The plot shows the distribution of CO2 emissions by energy source.
Signal colors
| Signal color | Available | Info |
|---|---|---|
| red | Yes | CO2 emission significantly above average for this type of building. |
| yellow | Yes | CO2 emission significantly above average for this type of building. |
| green | Yes | CO2 emission below average for this type of building. |
Interpretations
| Available | Info |
|---|---|
| Yes | Interpretations summarize the result of the analysis. |
Recommendations
| Available | Info |
|---|---|
| Yes | Info text and recommendation for action. |
KPIs
Summary KPI
| KPI reference | Info | Value Range | Unit |
|---|---|---|---|
| current | Aggregated CO2 emission during analysis period of one month, specific to the net flor area of the building | -inf to inf | kg/m2/M |
| development | Change in CO2 emission compared to last analysis period | -inf to inf | % |
Total CO2 emissions KPIs
The .weather normalized KPI-variants below correct for the weather actually experienced during the period. See Weather normalization for more information.
| KPI Identifier | Info | Value Range | Unit |
|---|---|---|---|
| Total CO2 emissions | Aggregated CO2 emissions during analysis period | 0 to inf | kg |
| Total CO2 emissions.weather normalized | Aggregated weather normalized CO2 emissions during analysis period | 0 to inf | kg |
| Total CO2 emissions per area | Aggregated CO2 emissions per area during analysis period | 0 to inf | kg/m2/M |
| Total CO2 emissions per area.weather normalized | Aggregated weather normalized CO2 emissions per area during analysis period | 0 to inf | kg/m2/M |
Yearly predicted CO2 emissions KPIs
The prediction is made by calculating and aggregating the yearly consumption of each relevant meter. For weather-dependent consumption, the yearly consumption is weather-normalized with heating/cooling degree hours (see Weather normalization). If a meter has less than one year of consumption data, the consumption is extrapolated to a full year.
Extrapolation of weather-dependent consumption
The prediction is based on weather-normalized extrapolation with heating/cooling degree hours. It calculates an energy intensity factor which describes how much energy is consumed per heating/cooling degree hour during the limited time period of available consumption data. This factor is then multiplied by the expected heating/cooling degree hours in a climate normal year.
Extrapolation of weather-independent consumption
The prediction is based on linear extrapolation. The assumption is that energy is consumed at the same rate over the full year.
| KPI Identifier | Info | Value Range | Unit |
|---|---|---|---|
| Yearly predicted total CO2 emissions | Predicted yearly CO2 emissions based on weather-normalized extrapolation | 0 to inf | kg |
| Yearly predicted total CO2 emissions per area | Predicted yearly CO2 emissions per area based on weather-normalized extrapolation | 0 to inf | kg/m2/Y |
CO2 emissions by energy source KPIs
| KPI Identifier | Info | Value Range | Unit |
|---|---|---|---|
| CO2 emissions.cold | Aggregated thermal cold CO2 emissions during analysis period | 0 to inf | kg |
| CO2 emissions.electricity | Aggregated electric CO2 emissions during analysis period | 0 to inf | kg |
| CO2 emissions.heat | Aggregated thermal heat CO2 emissions during analysis period | 0 to inf | kg |
| CO2 emissions.natural gas | Aggregated natural gas CO2 emissions during analysis period | 0 to inf | kg |
| CO2 emission factor.cold.mean | Average CO2 emission factor of thermal cold energy during analysis period | 0 to inf | kg/kWh |
| CO2 emission factor.electricity.mean | Average CO2 emission factor of electric energy during analysis period | 0 to inf | kg/kWh |
| CO2 emission factor.heat.mean | Average CO2 emission factor of thermal heat energy during analysis period | 0 to inf | kg/kWh |
| CO2 emission factor.natural gas.mean | Average CO2 emission factor of natural gas energy during analysis period | 0 to inf | kg/kWh |
Timeseries
The timeseries is saved as a virtual datapoint. Every run of the analysis will add the summary KPI (current value) as an observation at the start of the analysis period to the timeseries.
| Timeseries datapointID | Info | Unit |
|---|---|---|
| {project_id}_{instance_id}_co2_emissions_absolute | Absolute CO2 emissions timeseries | kg |
| {project_id}_{instance_id}_co2_emissions | Specific CO2 emissions timeseries | kg/m2/M |
Plots
| Identifier | Type | Info | Unit |
|---|---|---|---|
| benchmark | bullet_graph | CO2 benchmarking including color scale Default: Based on German Gebäudeenergiegesetz | kg/m2/M |
| month_comparison | bar_chart | CO2 emissions of the last 3 months | kg/m2/M |
| co2_emissions | pie_chart | CO2 emission by energy source | % |
| Pin | Required | Mapping info | Unit |
|---|---|---|---|
| - | - | - | - |
| Attribute | Required | Mapping info | Unit |
|---|---|---|---|
| CO2 emission factor cold | No | Default: 0.3 | kgCO2/kWh |
| CO2 emission factor electricity | No | Default: 0.56 | kgCO2/kWh |
| CO2 emission factor fuel | No | Default: 0.24 | kgCO2/kWh |
| CO2 emission factor heat | No | Default: 0.36 | kgCO2/kWh |
| CO2 emissions limit red | No | Overwrite the red limit for the CO2 emissions KPI for this building | kg/m2/M |
| CO2 emissions limit yellow | No | Overwrite the yellow limit for the CO2 emissions KPI for this building | kg/m2/M |
| Net floor area | Yes | Used to calculate the per area KPI for current value | m2 |
Sub-components
At least one sub-component is needed to get a result for this analysis function. Only the necessary meter components need to be added to the project.
CO2 emission factor sources and priorities
The CO2 emission factor can be gathered from different pin and attribute sources with the following priorities:
- Meter pin
- Meter attribute
- Building attribute
- Attribute default
Setting the building attribute applies to all meters of the building. Individual factors for meters can be set in the meter component to overwrite the building attribute.
| Pin | Required | Mapping info |
|---|---|---|
| CO2 emission factor | No | CO2 emission factor for the underlying energy in kgCO2/kWh. |
| Cooling energy | Yes | Cumulating timeseries in kWh |
| Attribute | Required | Mapping info | Unit |
|---|---|---|---|
| CO2 emission factor | No | CO2 emission factor for the underlying energy. | kgCO2/kWh |
| Cost measurement device | Yes | Set to 'True' if this component should be considered in this analysis | binary |
| Pin | Required | Mapping info |
|---|---|---|
| Active energy | Yes | Cumulating timeseries in kWh |
| CO2 emission factor | No | CO2 emission factor for the underlying energy in kgCO2/kWh. |
| Attribute | Required | Mapping info | Unit |
|---|---|---|---|
| CO2 emission factor | No | CO2 emission factor for the underlying energy. | kgCO2/kWh |
| Cost measurement device | Yes | Set to 'True' if this component should be considered in this analysis | binary |
| Pin | Required | Mapping info |
|---|---|---|
| CO2 emission factor | No | CO2 emission factor for the underlying energy in kgCO2/kWh. |
| Gas quantity | Yes | Cumulating timeseries in m3, calorific_value = 13.0 kWh/m3 |
| Attribute | Required | Mapping info | Unit |
|---|---|---|---|
| CO2 emission factor | No | CO2 emission factor for the underlying energy | kgCO2/kWh |
| Calorific value of natural gas | No | Change to calorific value of delivered natural gas. Default: 13 kWh/m3 | kWh/m3 |
| Cost measurement device | Yes | Set to 'True' if this component should be considered in this analysis | binary |
| Pressure compensation factor of natural gas | No | Additional factor to compensate for elevation and line pressure at the termination point. Default: 1 | - |
| Pin | Required | Mapping info |
|---|---|---|
| CO2 emission factor | No | CO2 emission factor for the underlying energy in kgCO2/kWh. |
| Heating energy | Yes | Cumulating timeseries in kWh |
| Attribute | Required | Mapping info | Unit |
|---|---|---|---|
| CO2 emission factor | No | CO2 emission factor for the underlying energy. | kgCO2/kWh |
| Cost measurement device | Yes | Set to 'True' if this component should be considered in this analysis | binary |
Recommend Time Span
1 month
Recommended Repetition
Monthly
- Continuously monitor CO2 emissions
- Track success of a decarbonization measure
Control Loop Oscillation
The Control Loop Oscillation analysis checks the process value of a control loop for oscillation. Oscillating process values are an indicator for suboptimal parameterization or structural dimensioning of the control loop.
Value
- Increase lifetime of valve, dampers, and adjacent components
- Avoid spontaneous failures
- Reduce energy consumption
- Reduce noise pollution
Recommended for components
Any liquid media supply system, such as:
- Thermal control loop with 2-way valve and pump
Checked conditions
- Process value of the control loop is oscillating
- Process value of the control loop is not or to a negligible degree oscillating
- Condition checks on times of components operation
For this example, we analyzed the temperature control loop of a supply air volume flow, which provides fresh air and heating to a large salesroom. Figure 1 shows a plot of the process value of the control loop, the outlet temperature. The plot shows an oscillation of the outlet temperature during periods of operation.
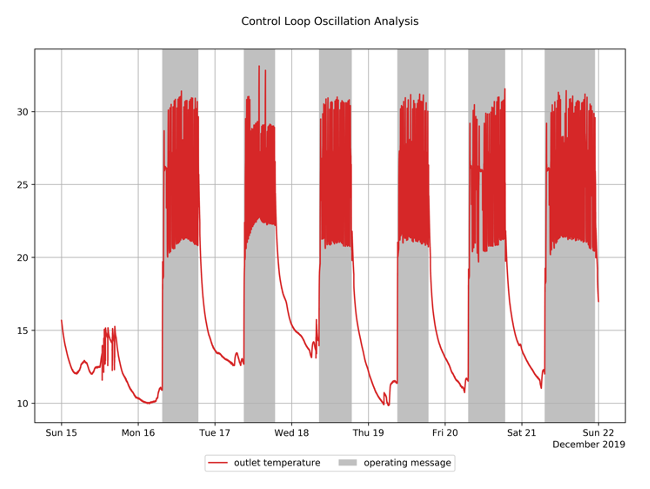
Figure 1: Oscillating processes value during operation
Figure 2 is a zoom of figure 1 to analyze the oscillation in more detail. The trajectory of the process value is common for control loops oscillating at medium frequency.
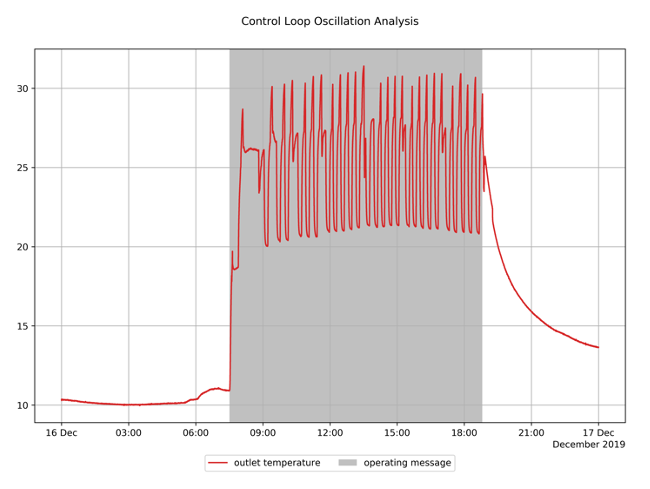
Figure 2: Oscillating process value during operation in detail
The Control Loop analysis evaluated this oscillation as significant and assigned it the signal color yellow. Recommendations are made on how to adjust controller parameters for a smoother operation.
Signal colors
| Signal color | Available | Info |
|---|---|---|
| red | No | Red as a signal for a low cost measure with high impact on the building operation will not be provided. |
| yellow | Yes | An oscillating control loop is a symptom for suboptimal control parameters or component design. Investing the extra effort to identify the root cause and fixing it is strongly recommended. |
| green | Yes | No or only slight, in respect to usual tolerances in buildings, negligible oscillation. |
Interpretations
| Available | Info |
|---|---|
| Yes | Interpretations summarize the result of the analysis. |
Recommendations
| Available | Info |
|---|---|
| Yes | Recommendations on how to smooth the control loop oscillation. No recommendation, if oscillation is negligible. |
| Pin | Required | Mapping info |
|---|---|---|
| Operating message | No | Strongly recommended Default: Always on |
| Supply air temperature | Yes | - |
| Pin | Required | Mapping info |
|---|---|---|
| Operating message | No | Strongly recommended Default: Always on |
| Supply temperature | Yes | - |
| Pin | Required | Mapping info |
|---|---|---|
| Operating message | No | Strongly recommended Default: Always on |
| Supply temperature - secondary | Yes | - |
| Pin | Required | Mapping info |
|---|---|---|
| Operating message | No | Strongly recommended Default: Always on |
| Supply temperature | Yes | - |
For the hybrid circuit the different supply temperatures are checked independently, each referring to the respective operating message of the (sub)-component and the operating mode.
| Pin | Required | Mapping info |
|---|---|---|
| Cooling circuit - Operating damper | No | An operating mode candidate |
| Cooling circuit - Pump - Operating message | No | A subcomponent operating message candidate Default: Always off |
| Cooling circuit - Supply temperature | No | Only analyzed if subcomponent is operating and cooling operation active |
| Cooling circuit - Valve - Position | No | An operating mode candidate |
| Cooling circuit - Operating damper | No | An operating mode candidate |
| Heating circuit - Pump - Operating message | No | A subcomponent operating message candidate Default: Always off |
| Heating circuit - Supply temperature | No | Only analyzed if subcomponent is operating and heating operation active |
| Heating circuit - Valve - Position | No | An operating mode candidate |
| Operating message | No | An operating message candidate Default: Always off |
| Supply temperature | No | Only analyzed if component is operating and heating or cooling operation active |
| Pin | Required | Mapping info |
|---|---|---|
| Operating message | No | Strongly recommended Default: Always on |
| Outlet temperature | Yes | - |
Recommend Time Span
1 day to 1 week
Recommended Repetition
Weekly
- After changes of operational modes, e.g., transfers to heating mode
- After changes in the control system
- After maintenance or replacements
Control Sequence
The Control Sequence analysis determines the operating modes of a system and compares these with predefined reference modes. The reference modes consist of normal (allowed) operating modes such as heating or dehumidification and faulty (not allowed) operating modes such as simultaneous heating and cooling.
Value
- Better understanding of the system's operating modes
- Detecting of faulty operation modes
- Lower the energy costs of your system through the optimization of the detected operating modes
Recommended for components
- Air handling unit
Checked faulty conditions
- Air heating without full use of the heat recovery system
- Simultaneous heating and cooling
- Contradicting operating modes in downstream air heating or cooling units
The sequence analysis was applied to an air handling unit with an analysis period of one week. We can see that the unit has been operating in the faulty air heater mode for a very long time. This suggests that the heat recovery is not fully utilized before the air heater is switched on.
Connected sub-components:
- Supply fan
- Air heater
- Heat recovery system
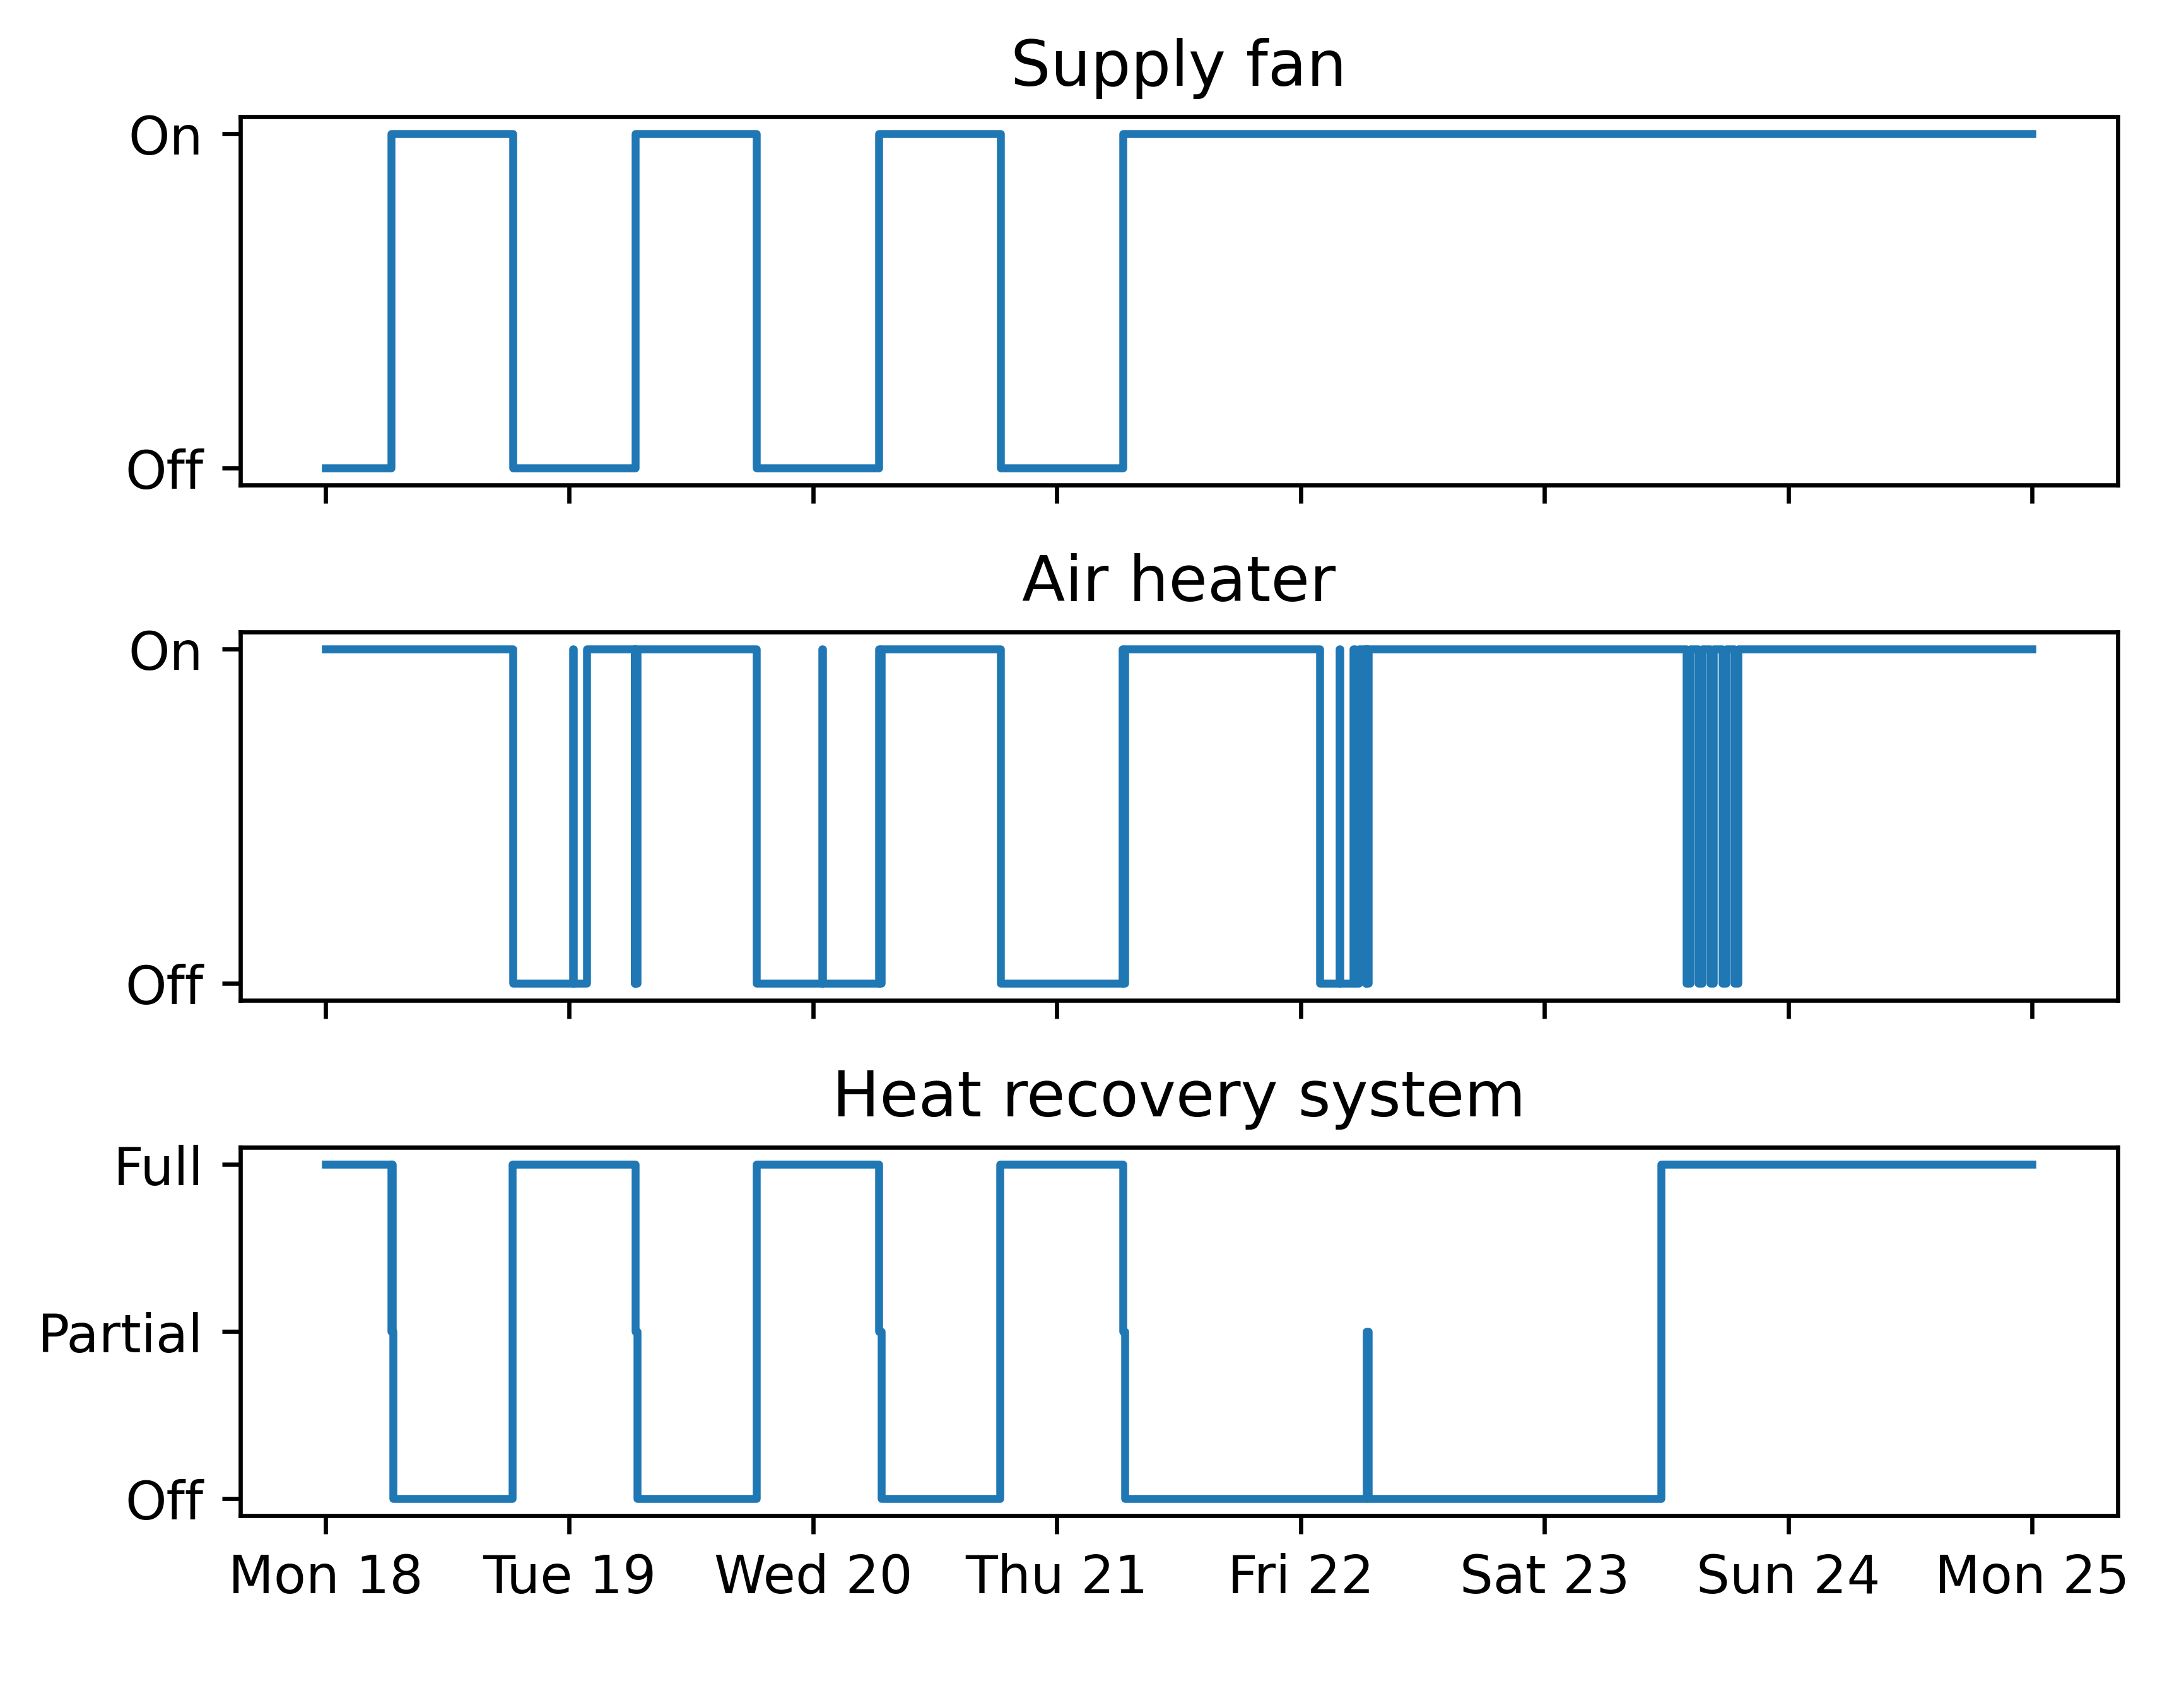
Figure 1: Operating state of sub-components
| KPI | Value | Unit |
|---|---|---|
| operating time | 136.9 | h |
| duration.faulty mode.Air heating without HRCS | 84.4 | h |
| duration.faulty mode.Air heating without HRCS.relative | 50.2 | % |
| duration.mode.Air heating & heat recovery | 34.9 | h |
| duration.mode.Air heating & heat recovery.relative | 20.8 | % |
| duration.mode.Off | 31.1 | h |
| duration.mode.Off.relative | 18.5 | % |
| duration.mode.Antifreeze protection air heater | 11.5 | h |
| duration.mode.Antifreeze protection air heater.relative | 6.83 | % |
| duration.mode.Ventilation | 3.71 | h |
| duration.mode.Ventilation.relative | 2.21 | % |
| duration.mode.Air heating with heat recovery without air heater | 2.44 | h |
| duration.mode.Air heating with heat recovery without air heater.relative | 1.45 | % |
Signal colors
| Signal color | Available | Info |
|---|---|---|
| red | Yes | One or more faulty operating modes were found and at least one duration is above the red limit. |
| yellow | Yes | One or more faulty operating modes were found and at least one duration is above the yellow limit. |
| green | Yes | No faulty operating modes detected or no duration of faulty operating modes exceeds the threshold. |
Interpretations
| Available | Info |
|---|---|
| Yes | Interpretations summarize the result of the analysis. |
Recommendations
| Available | Info |
|---|---|
| Yes | Recommendations to avoid operation in a faulty operating mode. |
KPIs
<OPERATING_STATE> refers to the actual detected operating state.
Faulty operating states
| KPI Identifier | Info | Value Range | Unit |
|---|---|---|---|
| duration.faulty mode.<OPERATING_STATE> | Amount of time the corresponding faulty operating state was active during the analysis period. | 0 to inf | h |
| duration.faulty mode.<OPERATING_STATE>.relative | Amount of time the corresponding faulty operating state was active during the analysis period, relative to the analysis period. | 0 to 100 | % |
Normal operating states
| KPI Identifier | Info | Value Range | Unit |
|---|---|---|---|
| duration.mode.<OPERATING_STATE> | Amount of time the corresponding normal operating state was active during the analysis period. | 0 to inf | h |
| duration.mode.<OPERATING_STATE>.relative | Amount of time the corresponding normal operating state was active during the analysis period, relative to the analysis period. | 0 to 100 | % |
| Pin | Required | Mapping info |
|---|---|---|
| Operating message | No | Operating message of the entire AHU system. This pin, if connected, determines whether the function is executed. |
The operating state of the sub-components is determined according to the connected pins of the corresponding sub-component. If no pins are mapped to a sub-component, it is assumed that the air handling unit does not contain this sub-component.
Decentralized downstream air heating and air cooling units are considered as sub-components if they are related to the AHU.
Different pin candidates are available to determine the operating state of the respective sub-component. If several pin candidates of the same sub-component are mapped, the pin with the highest priority is used. The tables of the pin candidates of the sub-components are sorted in descending order of priority.
Sub-component supply fan
| Pin | Required | Mapping info |
|---|---|---|
| Supply air fan - operating message | No | This pin is used to determine the operating state of the supply fan. |
| Supply air fan - position | No | This pin is used to determine the operating state of the supply fan. |
Sub-component exhaust fan
| Pin | Required | Mapping info |
|---|---|---|
| Return air fan - operating message | No | This pin is used to determine the operating state of the exhaust fan. |
| Return air fan - position | No | This pin is used to determine the operating state of the exhaust fan. |
Sub-component air cooler
| Pin | Required | Mapping info |
|---|---|---|
| Air cooler - operating message | No | This pin is used to determine the operating state of the air cooler. |
| Air cooler - pump - operating message | No | This pin is used to determine the operating state of the air cooler. |
| Air cooler - valve - position | No | This pin is used to determine the operating state of the air cooler. |
| Air cooler - valve - control signal | No | This pin is used to determine the operating state of the air cooler. |
Sub-component air heater
| Pin | Required | Mapping info |
|---|---|---|
| Air heater - operating message | No | This pin is used to determine the operating state of the air heater. |
| Air heater - pump - operating message | No | This pin is used to determine the operating state of the air heater. |
| Air heater - valve - position | No | This pin is used to determine the operating state of the air heater. |
| Air heater - valve - control signal | No | This pin is used to determine the operating state of the air heater. |
Sub-component air re-heater
| Pin | Required | Mapping info |
|---|---|---|
| Air re-heater - operating message | No | This pin is used to determine the operating state of the air re-heater. |
| Air re-heater - pump - operating message | No | This pin is used to determine the operating state of the air re-heater. |
| Air re-heater - valve - position | No | This pin is used to determine the operating state of the air re-heater. |
| Air re-heater - valve - control signal | No | This pin is used to determine the operating state of the air re-heater. |
Sub-component heat recovery system
| Pin | Required | Mapping info |
|---|---|---|
| Heat recovery system - operating message | No | This pin is used to determine the multi-state of the heat recovery system. |
| Heat recovery system - position | No | This pin is used to determine the multi-state of the heat recovery system. |
| Heat recovery system - control signal | No | This pin is used to determine the multi-state of the heat recovery system. |
Sub-component supply humidifier
| Pin | Required | Mapping info |
|---|---|---|
| Supply humidifier - operating message | No | This pin determines the operating state of the supply humidifier. |
Sub-component exhaust humidifier
| Pin | Required | Mapping info |
|---|---|---|
| Exhaust humidifier - operating message | No | This pin determines the operating state of the exhaust humidifier. |
Sub-component recirculation damper
| Pin | Required | Mapping info |
|---|---|---|
| Recirculation damper - position | No | This pin is used to determine the multi-state of the recirculation damper. |
| Recirculation damper - control signal | No | This pin is used to determine the multi-state of the recirculation damper. |
Sub-component decentralized air cooler
| Pin | Required | Mapping info |
|---|---|---|
| Air cooler - pump - operating message | No | This pin is used to determine the operating state of the air cooler. |
| Air cooler - operating message | No | This pin is used to determine the operating state of the air cooler. |
| Air cooler - valve - position | No | This pin is used to determine the operating state of the air cooler. |
| Air cooler - Inlet air temperature | No | This pin is used together with outlet temperature to determine the operating state of the air cooler. |
| Air cooler - Outlet air temperature | No | This pin is used together with inlet temperature to determine the operating state of the air cooler. |
Sub-component decentralized air heater
| Pin | Required | Mapping info |
|---|---|---|
| Air heater - pump - operating message | No | This pin is used to determine the operating state of the air heater. |
| Air heater - operating message | No | This pin is used to determine the operating state of the air heater. |
| Air heater - valve - position | No | This pin is used to determine the operating state of the air heater. |
Recommend Time Span
1 day to 1 week
- Analysis is useful for all days with system operation
Recommended Repetition
Every month
- After changes of operational modes, e.g., transfers to heating mode
- After changes in the control system of the ventilation systems
- After maintenance or replacements in ventilation systems
Dew Point Alert
Building automation systems often have dew point alert messages which identify the possibility of unwanted condensation taking place in rooms. If the dew point alert message is active for any amount of time during the period of analysis, a recommendation is made to the user since rooms condensation in rooms can be damaging. Furthermore, if the temperature and relative humidity of the room are known, the Dew Point Alert analysis calculates the risk of condensation and takes these into account in the evaluation. The Dew Point Alert analysis is recommended for any room with an existing dew point alert signal or with temperature and relative humidity sensors.
Value
- Avoids damage to rooms due to condensation
Recommended for components
- Rooms
Checked conditions
- Duration of dew point alert signal
- Duration in which the room temperature is between 2 °C and 4 °C above the dew point temperature
- Duration in which the room temperature is within 2 °C of the dew point temperature
The Dew Point Alert analysis was performed on a room for a week in February 2020. For this particular room, a dew point alert message is available but no temperature and relative humidity data. As is shown in figure 1, the dew point alert signal is only active for a very short amount of time during the week.
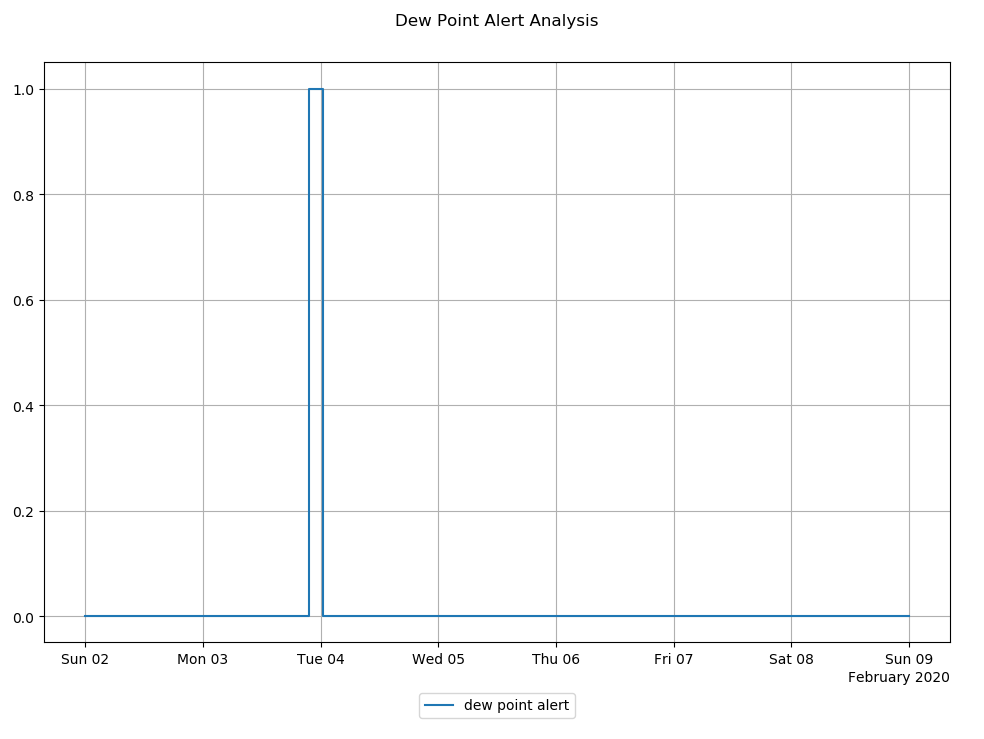
Figure 1: Dew point alert for one week in February 2020
The analysis returns a red warning message to indicate that the dew point alert was active during a portion of the time period. This suggests that the condensation may have formed in the room. Note that only "dew point alert" KPIs are generated since no temperature and humidity data are available in this example.
| KPI | Value | Unit |
|---|---|---|
| dew point alert message.relative | 1.69 | % |
| dew point alert message.duration | 2.83 | h |
Signal colors
| Signal color | Available | Info |
|---|---|---|
| red | Yes | Dew point alert message is active for some time or the temperature and humidity show a high chance of condensation. |
| yellow | Yes | There is a moderate chance of condensation taking place in the room. |
| green | Yes | Dew point alert message is not active during analysis period. No risk of condensation. |
Interpretations
| Available | Info |
|---|---|
| Yes | Interpretations summarize the result of the analysis. |
Recommendations
| Available | Info |
|---|---|
| Yes | Check the room for condensation and mold. |
KPIs
The KPIs which are generated by this analysis depend on the information available in the analysis. The "dew point alert message" KPIs are generated if a dew point alert message is available. The condensation risk KPIs are generated using room temperature and relative humidity.
The condensation risk is evaluated as moderate if the room temperature is between 2 K and 4 K above the dew point temperature. A high condensation risk is when the room temperature is within 2 K of the dew point temperature.
Dew point alert
| KPI Identifier | Info | Value Range | Unit |
|---|---|---|---|
| dew point alert message.relative | Time of active dew point alert message as a percentage of total time. | 0 to 100 | % |
| dew point alert message.duration | Total time of active dew point alert message. | 0 to inf | h |
| condensation risk moderate.relative | Time of moderate condensation risk as a percentage of total time. | 0 to 100 | % |
| condensation risk moderate.duration | Total time of moderate condensation risk. | 0 to inf | h |
| condensation risk high.relative | Time of high condensation risk as a percentage of total time. | 0 to 100 | % |
| condensation risk high.duration | Total time of high condensation risk. | 0 to inf | h |
| Pin | Required | Mapping info |
|---|---|---|
| Dew point alert message | No | The dew point alert message can be used as the only pin or in combination with temperature and humidity. |
| Temperature | No | If the temperature is mapped, humidity must also be mapped. Can be used in combination with the dew point alert message. |
| Humidity | No | If humidity is mapped, the temperature must also be mapped. Can be used in combination with the dew point alert message. |
Recommend Time Span
1 week to 1 month
Recommended Repetition
Every month
- After changes of operational modes, e.g., transfers to heating mode
- After changes in the control system
- After maintenance and replacement
Dynamic Control
The Dynamic Control analysis evaluates whether a technical component is controlled dynamically. This helps to identify problems with control and ensures that components are implemented more energy efficiently.
Value
- Detect AHU fans that are not controlled
- Reduce costs through better fan speed control
Recommended for components
- Air handling unit
- Fan
Checked conditions
- Stationary fan speed
In this example, we look at a Dynamic Control analysis of the historic 7-day fan speed. While the operating message (grey in the plot below) shows the times when the fan was operated, the fan speed (blue in the plot below) corresponds to the speed or load setting of the fan.
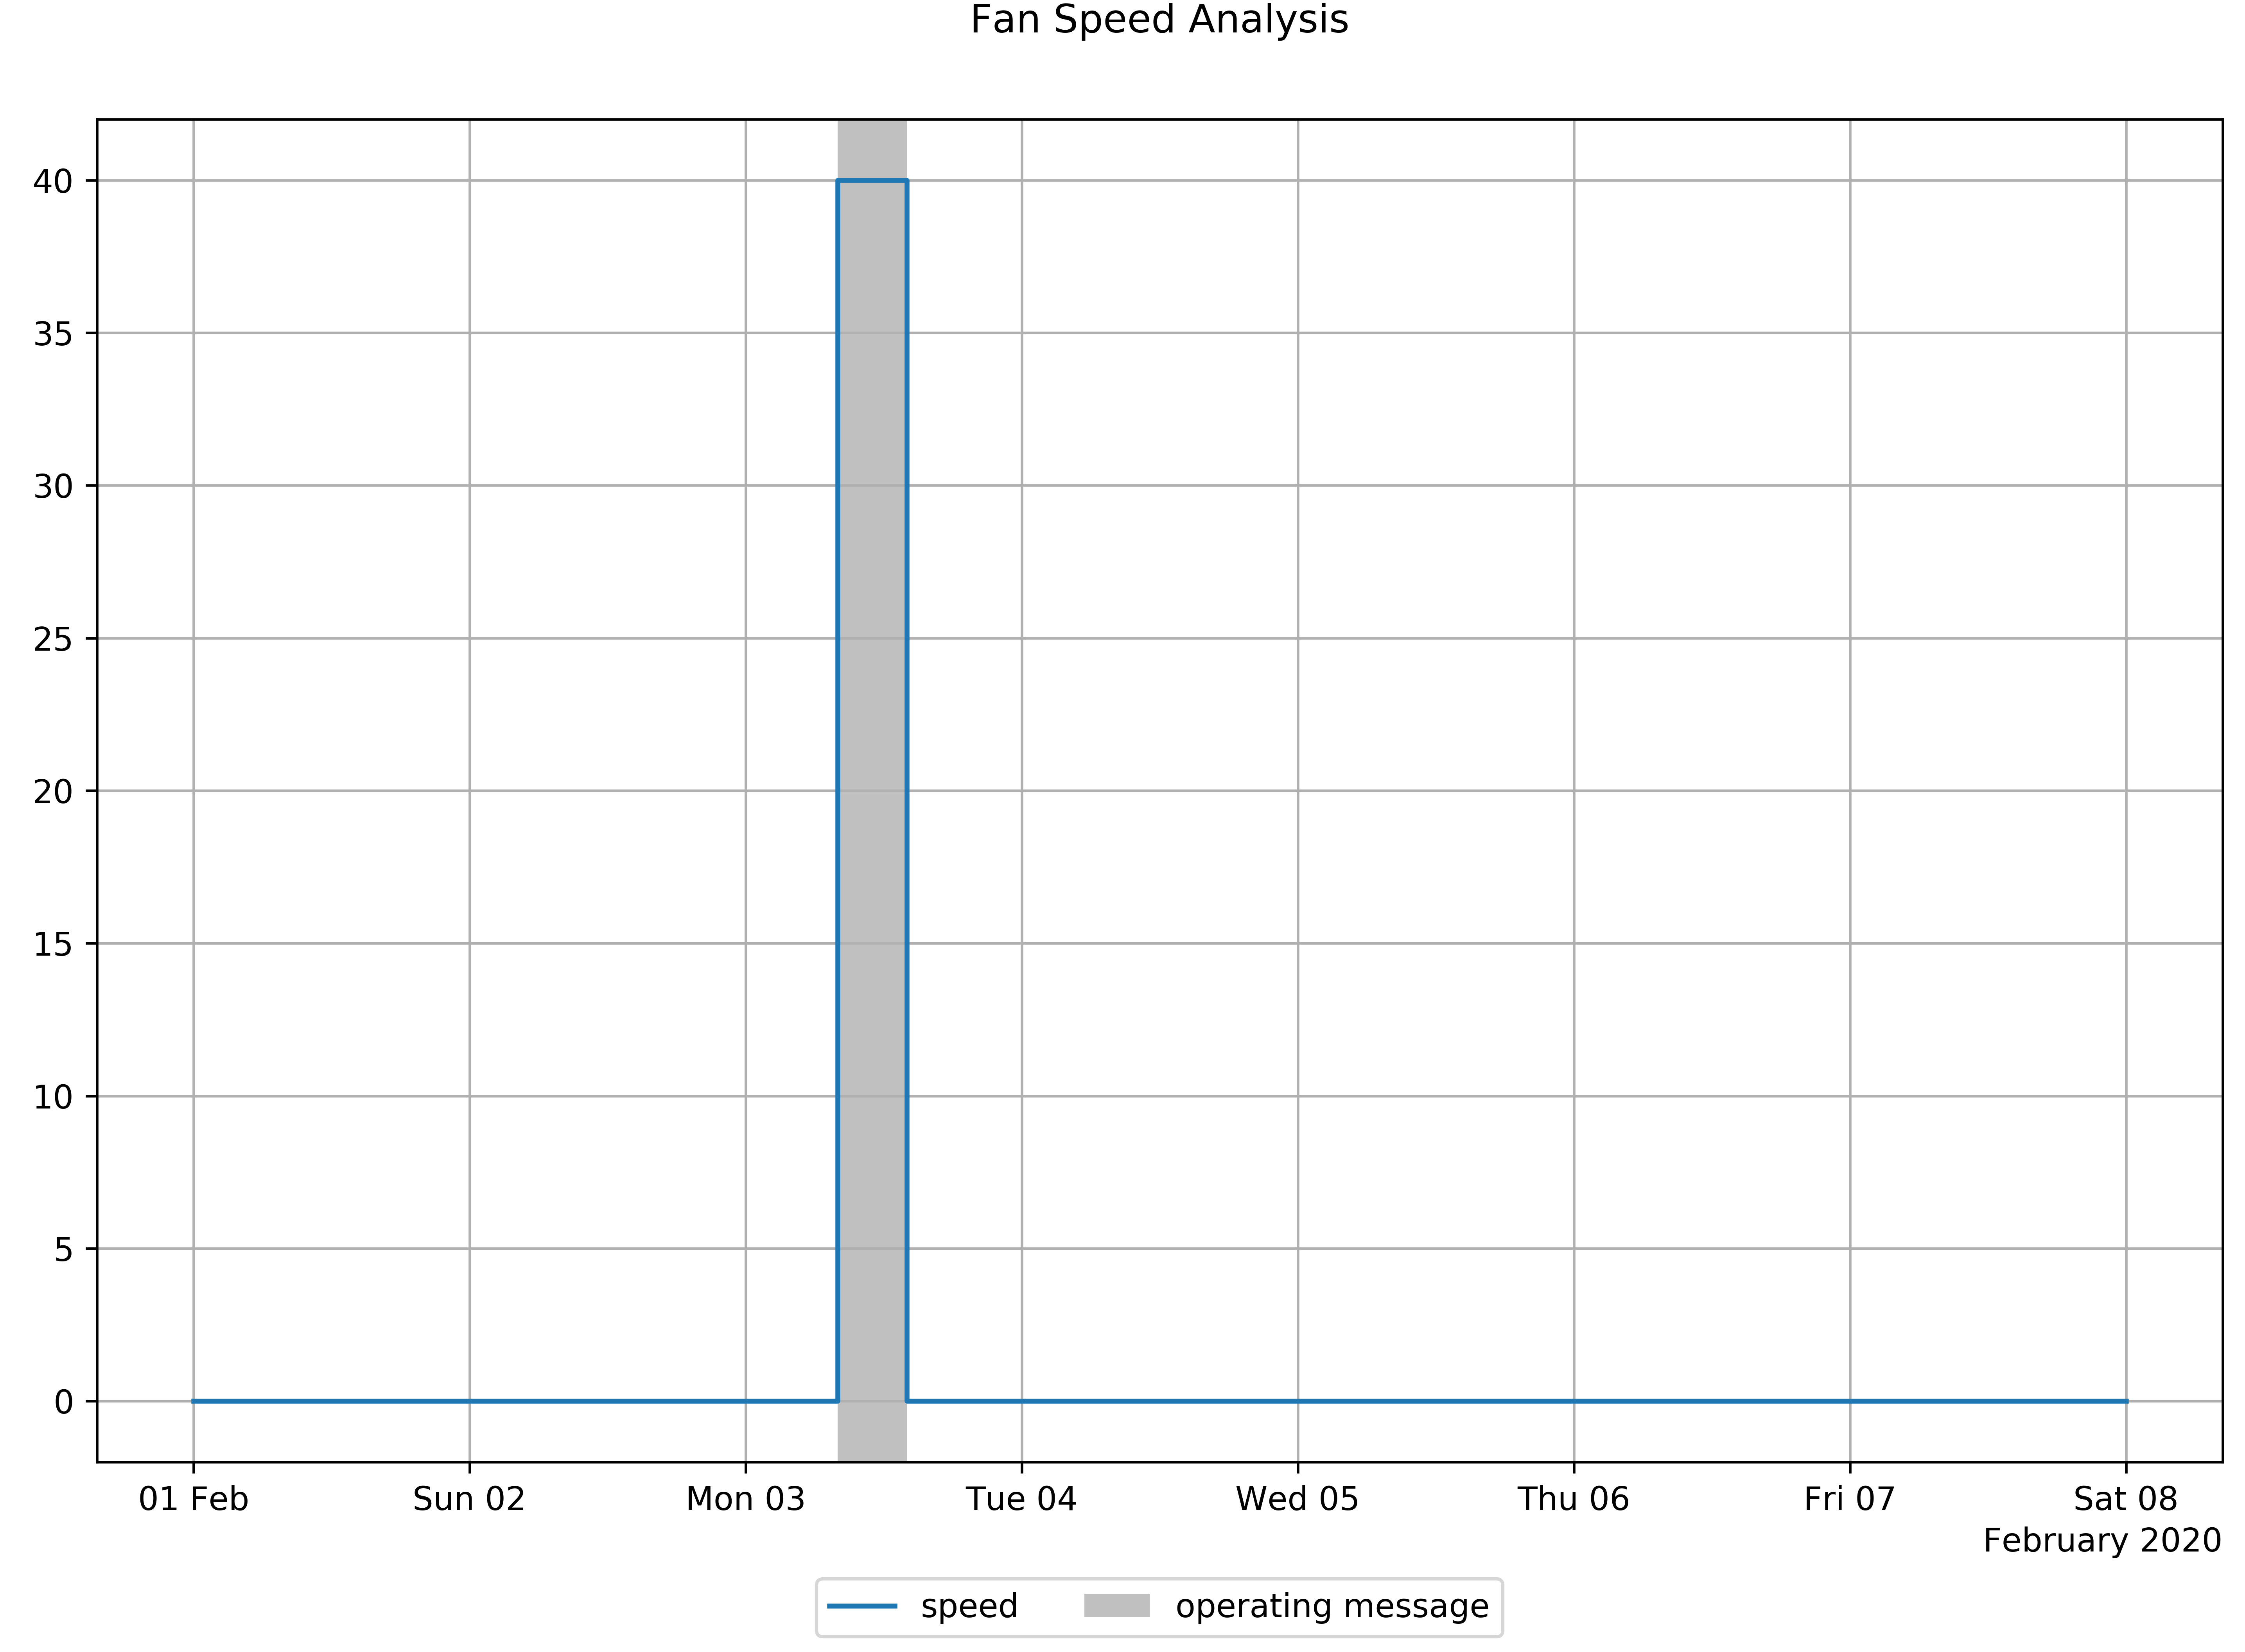
Figure 1: Speed and operating message of a 7-day fan speed analysis
From the analysis results, we can see that the fan was operated for 6 hours out of the 168 hours of the week or 3.57 % of the week. Additionally, we get statistics of the fan speed, e.g., the fan was operated at an average of 40 % load.
This corresponds to a static fan speed setting that is currently not controlled. To improve energy efficiency and thermal comfort you can consider different control strategies outlined in the recommendations.
KPI - Statistics
| KPI | Value | Unit |
|---|---|---|
| operating time | 6 | h |
| operating time.relative | 3.57 | % |
| speed.maximum | 40 | % |
| speed.minimum | 40 | % |
| speed.mean | 40 | % |
| speed.median | 40 | % |
Signal colors
| Signal color | Available | Info |
|---|---|---|
| red | No | - |
| yellow | Yes | Fan speed is not controlled. |
| green | Yes | Fan speed is controlled. |
Interpretations
| Available | Info |
|---|---|
| Yes | Information about how the fan speed is controlled. |
Recommendations
| Available | Info |
|---|---|
| Yes | Recommendations to look into the different control options for this fan to save energy. |
KPIs
Statistics
statistics for "speed" will be calculated for all measured values that are not 0 %
| KPI Identifier | Info | Value Range | Unit |
|---|---|---|---|
| operating time | Total time where the fan speed is greater than zero | 0 to inf | h |
| operating time.relative | Time where the fan speed is greater than zero relative to the analysis period | 0 to 100 | % |
| speed.maximum | Largest observation recorded of fan speed during analysis period | 0 to 100 | % |
| speed.minimum | Smallest observation recorded of fan speed during analysis period | 0 to 100 | % |
| speed.mean | Time-weighted average of fan speed | 0 to 100 | % |
| speed.median | Time-weighted median of fan speed | 0 to 100 | % |
| Pin | Required | Mapping info |
|---|---|---|
| Return air fan - position | No | Both or just one fan can be connected for this analysis function to work. |
| Return air fan - control signal | No | Alternative source for the return air fan - position. |
| Supply air fan - position | No | Both or just one fan can be connected for this analysis function to work. |
| Supply air fan - control signal | No | Alternative source for the supply air fan - position. |
| Pin | Required | Mapping info |
|---|---|---|
| Speed | Yes | Use this pin to connect the datapoint that reflects fan speed settings from 0 - 100 % load. |
Recommended Time Span
1 week
Recommended Repetition
Every month
Elevators Operating Time Analysis
The Elevators Operating Time analysis aggregates all operating states of elevators and calculates total operating time and overall availability. All elevators in one project will be taken into account with this analysis. The analysis is based on aedifion operating states.
Value
- Insights into the operating times of elevators over weekdays
- Insight into the total availability of elevators
Recommended for components
Buildings with elevators
Checked conditions for operating time calculation
| Operating status | Counts as operating time |
|---|---|
| 301 | No |
| 300 | No |
| 200 | No |
| 103 | No |
| 102 | No |
| 101 | No |
| 100 | Yes |
| 0 | No |
Checked conditions for availability calculation
| Operating status | Counts as not-available |
|---|---|
| 301 | Yes |
| 300 | Yes |
| 200 | No |
| 103 | No |
| 102 | No |
| 101 | No |
| 100 | No |
| 0 | No |
An analysis on a building with elevators is carried out for an analysis period of 3 weeks.
KPI - Statistics
| KPI | Value | Unit |
|---|---|---|
| elevators availability | 94.1 | % |
Bar chart Average Elevators Operating Time
| Data | Value | Unit |
|---|---|---|
| Monday | 2.5 | h |
| Tuesday | 5.0 | h |
| Wednesday | 7.5 | h |
| Thursday | 60.0 | h |
| Friday | 60.0 | h |
| Saturday | 0.0 | h |
| Sunday | 13.75 | h |
Signal colors
| Signal color | Available | Info |
|---|---|---|
| red | Yes | Availability <= 80 % |
| yellow | Yes | Availability > 80 % |
| green | Yes | Availability > 95 % |
Interpretations
| Available | Info |
|---|---|
| Yes | Interpretations summarize the result of the analysis. |
Recommendations
| Available | Info |
|---|---|
| Yes | Info text and recommendation for action. |
KPIs
Summary KPI
| KPI reference | Info | Value Range | Unit |
|---|---|---|---|
| elevators availability | Aggregated availability for analysis period | 0 - 100 | % |
Plots
| Identifier | Type | Info | Unit |
|---|---|---|---|
| elevator_operating_time | bar_chart | Average elevators operating time over weekdays | h |
| Pin | Required | Mapping info | Unit |
|---|---|---|---|
| - | - | - | - |
| Attribute | Required | Mapping info | Unit |
|---|---|---|---|
| - | - | - | - |
Sub-components
At least one sub-component is needed to get a result for this analysis function.
| Pin | Required | Mapping info |
|---|---|---|
| Operational state | Yes | Operational state with aedifion states |
Recommend Time Span
1 week
Recommended Repetition
weekly
- Continuously monitor availability of elevators
- Track operating times of your elevators
Energy Consumption
The Energy Consumption analysis aggregates all energy consumptions indicated by the meter components in the building during the analysis period. The total energy consumption is related to the net floor area of the building and is benchmarked against the usual consumption of the same type of building.
Value
- ESG-Reporting and monitoring of energy consumption
- Insights into the energy consumption of the building
- Energy consumption benchmarking
- Trace back consumption to the energy source
- Additional weather normalization of the energy consumption
- Prediction of yearly energy consumption based on weather-normalized extrapolation
Recommended for components
Complete buildings or energy systems
Checked conditions
- Energy consumption of the building or system
- Benchmarking
- Energy consumption by energy source
This example shows the results of an Energy Consumption analysis displayed in the Asset Overview.
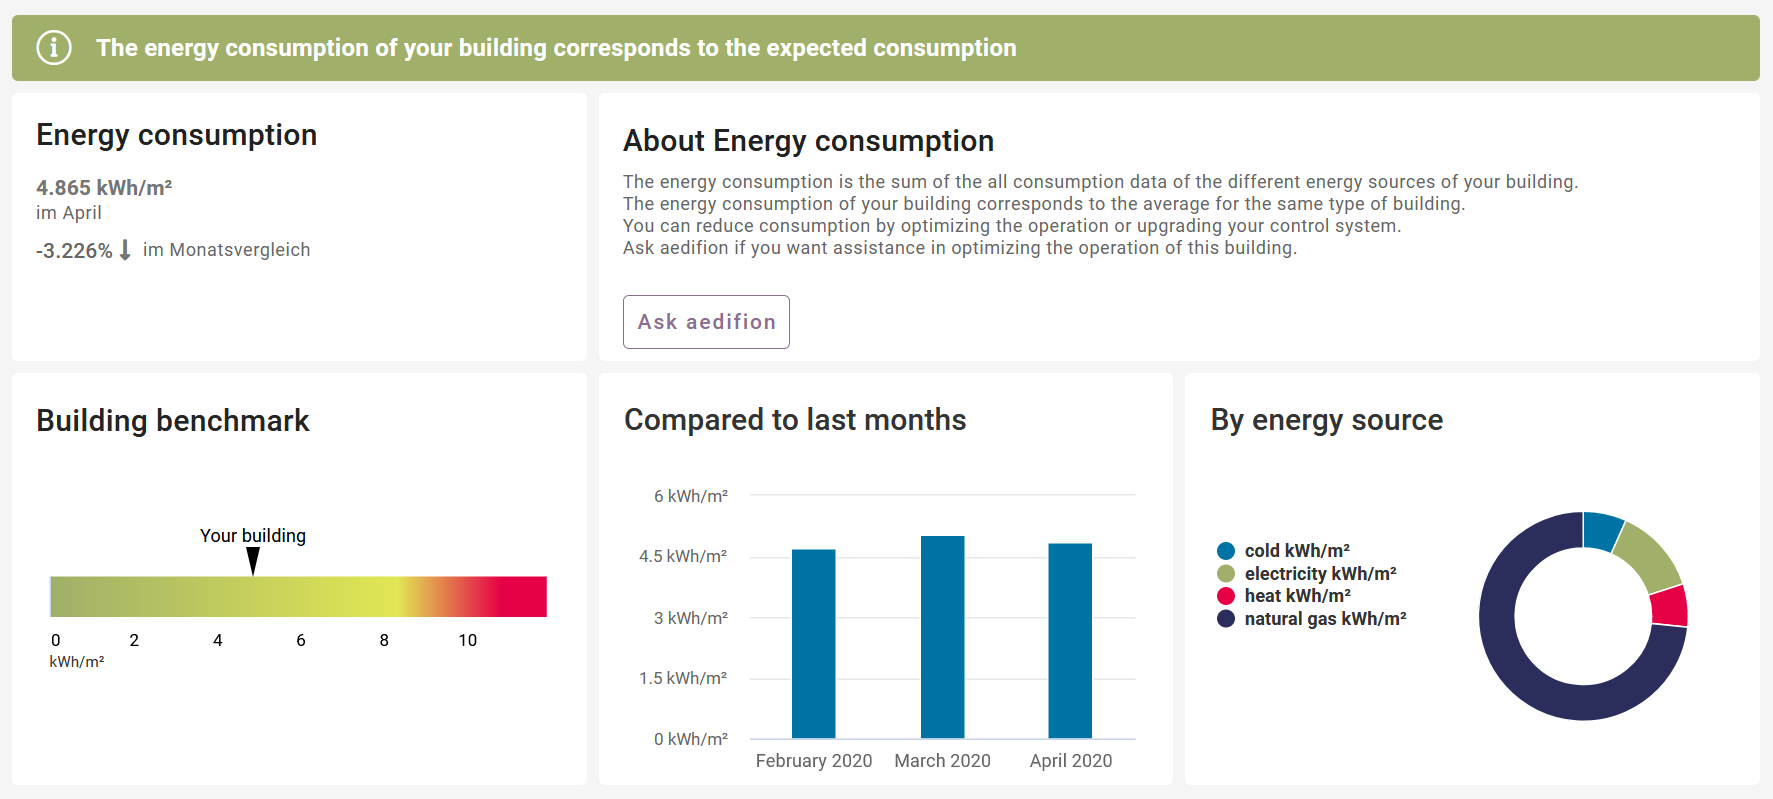
Figure 1: Energy Consumption Asset Overview result overview
Above all cards the interpretation text of the result is highlighted with the signal color of the result. In the top left the current KPI and the monthly trend is shown. On the right side of that you will find the recommendations of this result as well as further information about the function.
The three plots below are:
- The building benchmark
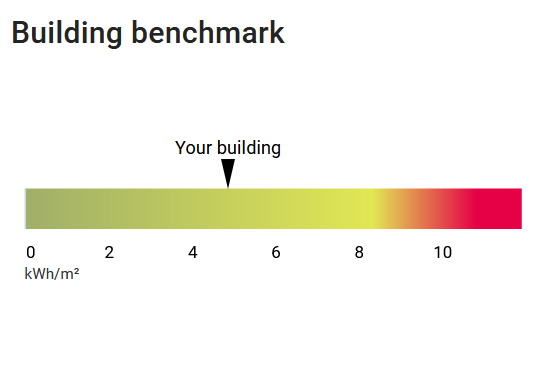
Figure 2: Energy Consumption Asset Overview plot bullet graph
The current energy consumption is plotted inside a bullet graph between the limits of the signal color.
- Compared to last months
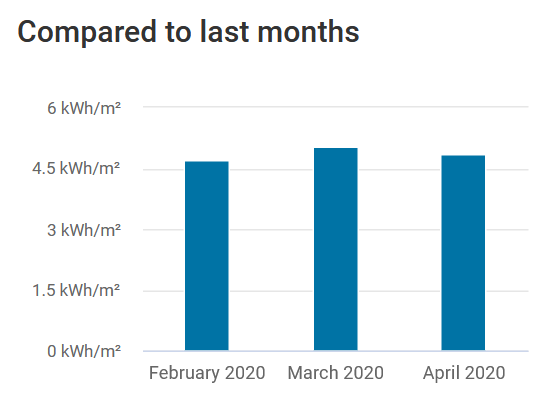
Figure 3: Energy Consumption Asset Overview plot month comparison
The plot shows the energy consumption of the last three months, including the month of the analysis.
- By energy source
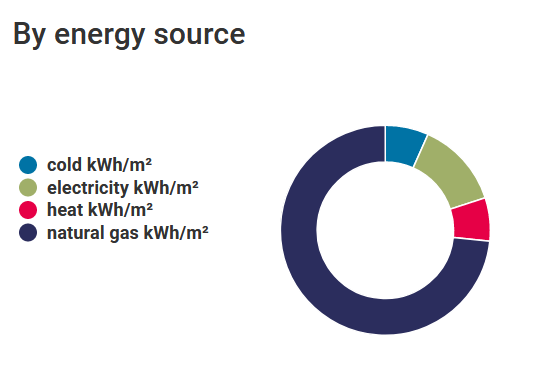
Figure 4: Energy Consumption Asset Overview plot energy source
The plot shows the distribution of energy consumption by energy source.
Signal colors
| Signal color | Available | Info |
|---|---|---|
| red | Yes | Energy consumption significantly above average for this type of building. |
| yellow | Yes | Energy consumption significantly above average for this type of building. |
| green | Yes | Energy consumption below average for this type of building. |
Interpretations
| Available | Info |
|---|---|
| Yes | Interpretations summarize the result of the analysis. |
Recommendations
| Available | Info |
|---|---|
| Yes | Info text and recommendation for action. |
KPIs
Summary KPI
| KPI reference | Info | Value Range | Unit |
|---|---|---|---|
| current | Aggregated energy consumption during analysis period | -inf to inf | kWh/m2/M |
| development | Change in energy consumption compared to last analysis period | -inf to inf | % |
Total energy consumption KPIs
The .weather normalized KPI-variants below correct for the weather actually experienced during the period. See Weather normalization for more information.
| KPI Identifier | Info | Value Range | Unit |
|---|---|---|---|
| Total energy consumption | Aggregated energy consumption during analysis period | 0 to inf | kWh |
| Total energy consumption.weather normalized | Aggregated weather normalized energy consumption during analysis period | 0 to inf | kWh |
| Total energy consumption per area | Aggregated energy consumption per area during analysis period | 0 to inf | kWh/m2/M |
| Total energy consumption per area.weather normalized | Aggregated weather normalized energy consumption per area during analysis period | 0 to inf | kWh/m2/M |
Yearly predicted energy consumption KPIs
The prediction is made by calculating and aggregating the yearly consumption of each relevant meter. For weather-dependent consumption, the yearly consumption is weather-normalized with heating/cooling degree hours (see Weather normalization). If a meter has less than one year of consumption data, the consumption is extrapolated to a full year.
Extrapolation of weather-dependent consumption
The prediction is based on weather-normalized extrapolation with heating/cooling degree hours. It calculates an energy intensity factor which describes how much energy is consumed per heating/cooling degree hour during the limited time period of available consumption data. This factor is then multiplied by the expected heating/cooling degree hours in a climate normal year.
Extrapolation of weather-independent consumption
The prediction is based on linear extrapolation. The assumption is that energy is consumed at the same rate over the full year.
| KPI Identifier | Info | Value Range | Unit |
|---|---|---|---|
| Yearly predicted total energy consumption | Predicted yearly energy consumption based on weather-normalized extrapolation | 0 to inf | kWh |
| Yearly predicted total energy consumption per area | Predicted yearly energy consumption per area based on weather-normalized extrapolation | 0 to inf | kWh/m2/Y |
Energy consumption by energy source KPIs
| KPI Identifier | Info | Value Range | Unit |
|---|---|---|---|
| Energy consumption.cold | Aggregated thermal cold energy consumption during analysis period | 0 to inf | kWh |
| Energy consumption.electricity | Aggregated electric energy consumption during analysis period | 0 to inf | kWh |
| Energy consumption.heat | Aggregated thermal heat energy consumption during analysis period | 0 to inf | kWh |
| Energy consumption.natural gas | Aggregated natural gas energy consumption during analysis period | 0 to inf | kWh |
Timeseries
The timeseries is saved as a virtual datapoint. Every run of the analysis will add the summary KPI (current value) as an observation at the start of the analysis period to the timeseries.
| Timeseries datapointID | Info | Unit |
|---|---|---|
| {project_id}_{instance_id}_energy_consumption_absolute | Absolute energy consumption timeseries | kWh |
| {project_id}_{instance_id}_energy_consumption | Specific energy consumption timeseries | kWh/m2/M |
Plots
| Identifier | Type | Info | Unit |
|---|---|---|---|
| benchmark | bullet_graph | Energy consumption benchmarking including color scale | kWh/m2/M |
| month_comparison | bar_chart | Energy consumption of the last 3 months | kWh/m2/M |
| energy_consumption | pie_chart | Energy consumption by energy source | % |
| Pin | Required | Mapping info | Unit |
|---|---|---|---|
| - | - | - | - |
| Attribute | Required | Mapping info | Unit |
|---|---|---|---|
| Energy consumption limit red | No | Overwrite the red limit for the energy consumption KPI for this building | kWh/m2/M |
| Energy consumption limit yellow | No | Overwrite the yellow limit for the energy consumption KPI for this building | kWh/m2/M |
| Net floor area | Yes | Used to calculate the per area KPI for current value | m2 |
Sub-components
At least one sub-component is needed to get a result for this analysis function. Only the necessary meter components need to be added to the project.
| Pin | Required | Mapping info |
|---|---|---|
| Cooling energy | Yes | Cumulating timeseries in kWh |
| Attribute | Required | Mapping info | Unit |
|---|---|---|---|
| Cost measurement device | Yes | Set to 'True' if this component should be considered in this analysis | binary |
| Pin | Required | Mapping info |
|---|---|---|
| Active energy | Yes | Cumulating timeseries in kWh |
| Attribute | Required | Mapping info | Unit |
|---|---|---|---|
| Cost measurement device | Yes | Set to 'True' if this component should be considered in this analysis | binary |
| Pin | Required | Mapping info |
|---|---|---|
| Gas quantity | Yes | Cumulating timeseries in m3 |
| Attribute | Required | Mapping info | Unit |
|---|---|---|---|
| Calorific value of natural gas | No | Change to calorific value of delivered natural gas. Default: 13 kWh/m3 | kWh/m3 |
| Cost measurement device | Yes | Set to 'True' if this component should be considered in this analysis | binary |
| Pressure compensation factor of natural gas | No | Additional factor to compensate for elevation and line pressure at the termination point. Default: 1 | - |
| Pin | Required | Mapping info |
|---|---|---|
| Heating energy | Yes | Cumulating timeseries in kWh |
| Attribute | Required | Mapping info | Unit |
|---|---|---|---|
| Cost measurement device | Yes | Set to 'True' if this component should be considered in this analysis | binary |
Recommend Time Span
1 month
Recommended Repetition
Monthly
- Continuously monitor energy costs
- Track success of a energy savings measure
Energy Cost
The Energy Cost analysis aggregates all energy costs indicated by the meter components in the building during the analysis period. The energy costs are related to the net floor area of the building and are benchmarked against the usual costs of the same type of building.
Value
- ESG-Reporting and monitoring of energy costs
- Insights into the energy costs of the building
- Energy costs benchmarking
- Trace back costs to the energy source
- Additional weather normalization of the energy costs
- Prediction of yearly energy costs based on weather-normalized extrapolation
Recommended for components
Complete buildings or energy systems
Checked conditions
- Energy costs of the building or system
- Benchmarking
- Energy costs by energy source
This example shows the results of an Energy Costs analysis displayed in the Asset Overview.
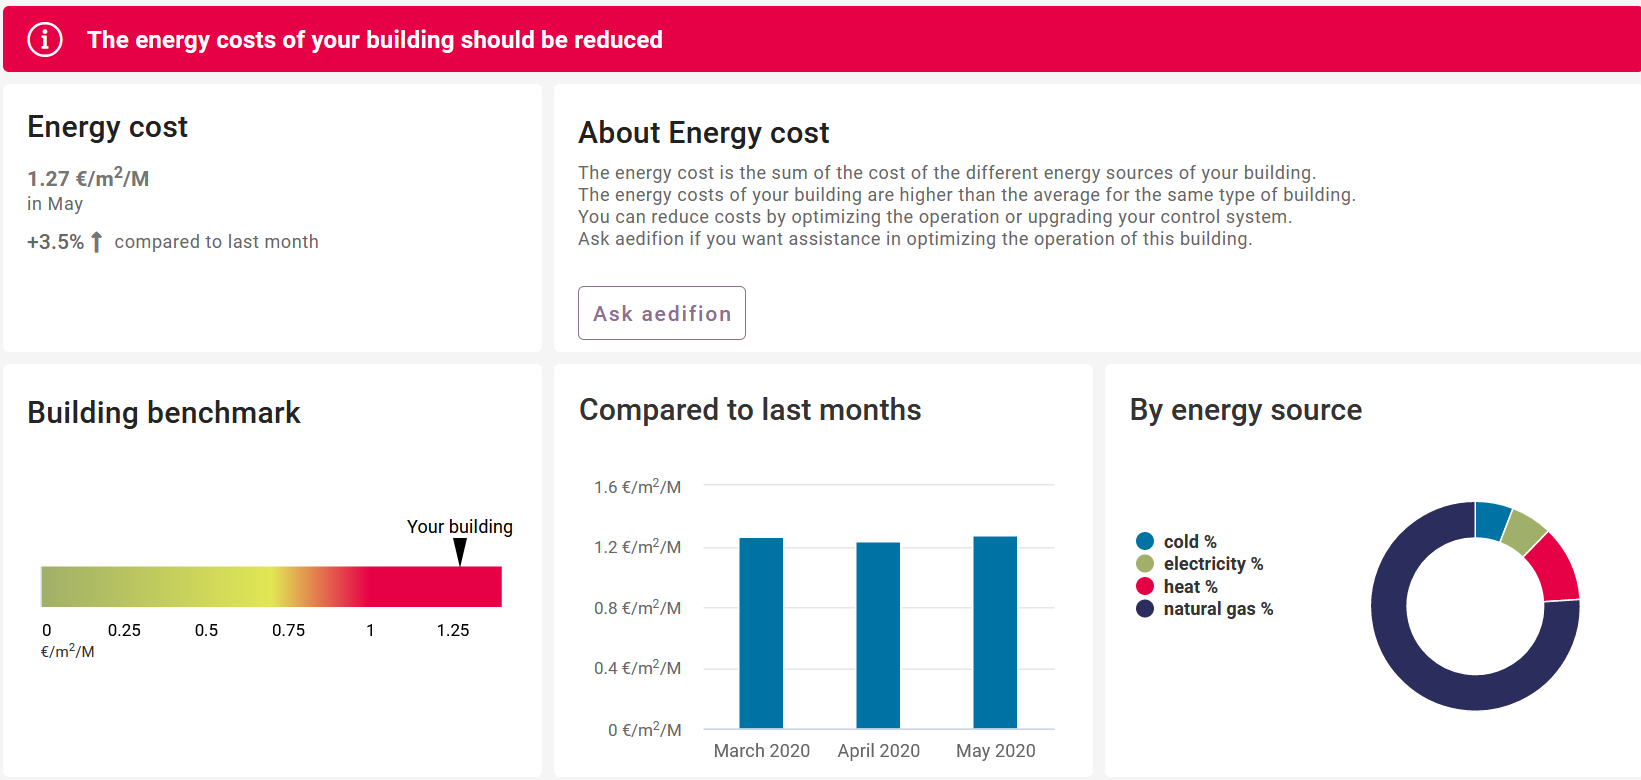
Figure 1: Energy Cost Asset Overview result overview
Above all cards the interpretation text of the result is highlighted with the signal color of the result. In the top left the current KPI and the monthly trend is shown. On the right side of that you will find the recommendations of this result as well as further information about the function.
The three plots below are:
- The building benchmark
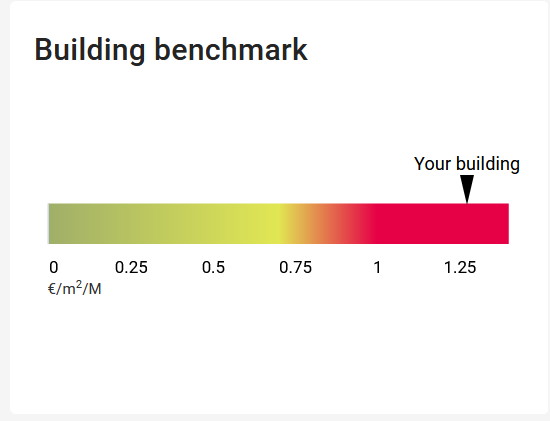
Figure 2: Energy Cost Asset Overview plot bullet graph
The current energy cost is plotted inside a bullet graph between the limits of the signal color.
- Compared to last months
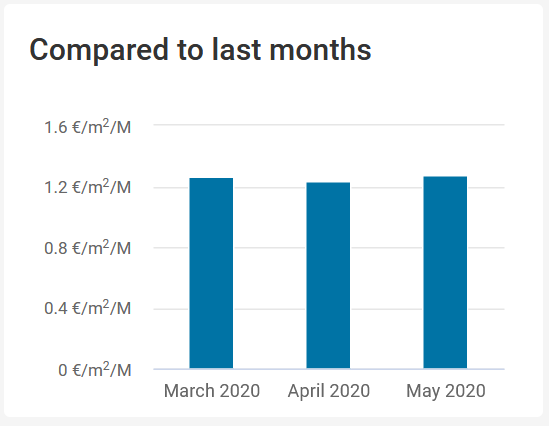
Figure 3: Energy Cost Asset Overview plot month comparison
The plot shows the energy costs of the last three months, including the month of the analysis.
- By energy source
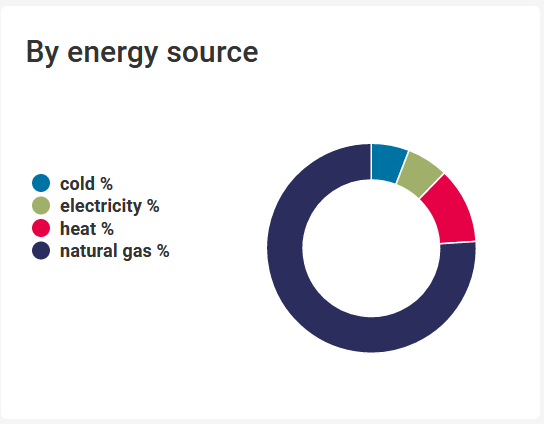
Figure 4: Energy Cost Asset Overview plot energy source
The plot shows the distribution of energy costs by energy source.
Signal colors
| Signal color | Available | Info |
|---|---|---|
| red | Yes | Energy costs significantly above average for this type of building. |
| yellow | Yes | Energy costs significantly above average for this type of building. |
| green | Yes | Energy costs below average for this type of building. |
Interpretations
| Available | Info |
|---|---|
| Yes | Interpretations summarize the result of the analysis. |
Recommendations
| Available | Info |
|---|---|
| Yes | Info text and recommendation for action. |
KPIs
Summary KPI
| KPI reference | Info | Value Range | Unit |
|---|---|---|---|
| current | Aggregated energy costs during analysis period | -inf to inf | €/m2/M |
| development | Change in energy costs compared to last analysis period | -inf to inf | % |
Total energy cost KPIs
The .weather normalized KPI-variants below correct for the weather actually experienced during the period. See Weather normalization for more information.
| KPI Identifier | Info | Value Range | Unit |
|---|---|---|---|
| Total Energy cost | Aggregated energy costs during analysis period | 0 to inf | € |
| Total Energy cost.weather normalized | Aggregated weather normalized energy costs during analysis period | 0 to inf | € |
| Total Energy cost per area | Aggregated energy costs per area during analysis period | 0 to inf | €/m2/M |
| Total Energy cost per area.weather normalized | Aggregated weather normalized energy costs per area during analysis period | 0 to inf | €/m2/M |
Yearly predicted energy cost KPIs
The prediction is made by calculating and aggregating the yearly consumption of each relevant meter. For weather-dependent consumption, the yearly consumption is weather-normalized with heating/cooling degree hours (see Weather normalization). If a meter has less than one year of consumption data, the consumption is extrapolated to a full year.
Extrapolation of weather-dependent consumption
The prediction is based on weather-normalized extrapolation with heating/cooling degree hours. It calculates an energy intensity factor which describes how much energy is consumed per heating/cooling degree hour during the limited time period of available consumption data. This factor is then multiplied by the expected heating/cooling degree hours in a climate normal year.
Extrapolation of weather-independent consumption
The prediction is based on linear extrapolation. The assumption is that energy is consumed at the same rate over the full year.
| KPI Identifier | Info | Value Range | Unit |
|---|---|---|---|
| Yearly predicted total energy cost | Predicted yearly energy cost based on weather-normalized extrapolation | 0 to inf | € |
| Yearly predicted total energy cost per area | Predicted yearly energy cost per area based on weather-normalized extrapolation | 0 to inf | €/m2/Y |
Energy cost by energy source KPIs
| KPI Identifier | Info | Value Range | Unit |
|---|---|---|---|
| Energy cost.cold | Aggregated thermal cold energy costs during analysis period | 0 to inf | € |
| Energy cost.electricity | Aggregated electric energy costs during analysis period | 0 to inf | € |
| Energy cost.heat | Aggregated thermal heat energy costs during analysis period | 0 to inf | € |
| Energy cost.natural gas | Aggregated natural gas energy costs during analysis period | 0 to inf | € |
| Energy price.cold.mean | Average energy price of thermal cold energy during analysis period | 0 to inf | €/kWh |
| Energy price.electricity.mean | Average energy price of electric energy during analysis period | 0 to inf | €/kWh |
| Energy price.heat.mean | Average energy price of thermal heat energy during analysis period | 0 to inf | €/kWh |
| Energy price.natural gas.mean | Average energy price of natural gas energy during analysis period | 0 to inf | €/kWh |
Timeseries
The timeseries is saved as a virtual datapoint. Every run of the analysis will add the summary KPI (current value) as an observation at the start of the analysis period to the timeseries.
| Timeseries datapointID | Info | Unit |
|---|---|---|
| {project_id}_{instance_id}_energy_cost_absolute | Absolute energy cost timeseries | € |
| {project_id}_{instance_id}_energy_cost | Specific energy cost timeseries | €/m2/M |
Plots
| Identifier | Type | Info | Unit |
|---|---|---|---|
| benchmark | bullet_graph | Energy expenses benchmarking including color scale Default: Based Oscar Report | €/m2/M |
| month_comparison | bar_chart | Energy expenses of the last 3 months | €/m2/M |
| energy_consumption | pie_chart | Energy expenses by energy source | % |
| Pin | Required | Mapping info | Unit |
|---|---|---|---|
| - | - | - | - |
| Attribute | Required | Mapping info | Unit |
|---|---|---|---|
| Cold price | No | Default: 0.1 | €/kWh |
| Electricity price | No | Default: 0.25 | €/kWh |
| Energy cost limit red | No | Overwrite the red limit for the energy cost KPI for this building | €/m2/M |
| Energy cost limit yellow | No | Overwrite the yellow limit for the energy cost KPI for this building | €/m2/M |
| Fuel price | No | Default: 0.1 | €/kWh |
| Heat price | No | Default: 0.15 | €/kWh |
| Net floor area | Yes | Used to calculate the per area KPI for current value | m2 |
Sub-components
At least one sub-component is needed to get a result for this analysis function. Only the necessary meter components need to be added to the project.
Energy price sources and priorities
The energy price can be gathered from different pin and attribute sources with the following priorities:
- Meter pin
- Meter attribute
- Building attribute
- Attribute default
Setting the building attribute applies to all meters of the building. Individual prices for meters can be set in the meter component to overwrite the building attribute.
| Pin | Required | Mapping info |
|---|---|---|
| Cold price | No | Specific price for the underlying energy in €/kWh. |
| Cooling energy | Yes | Cumulating timeseries in kWh |
| Attribute | Required | Mapping info | Unit |
|---|---|---|---|
| Cold price | No | Specific price for the underlying energy. | €/kWh |
| Cost measurement device | Yes | Set to 'True' if this component should be considered in this analysis | binary |
| Pin | Required | Mapping info |
|---|---|---|
| Active energy | Yes | Cumulating timeseries in kWh |
| Electricity price | No | Specific price for the underlying energy in €/kWh. |
| Attribute | Required | Mapping info | Unit |
|---|---|---|---|
| Cost measurement device | Yes | Set to 'True' if this component should be considered in this analysis | binary |
| Electricity price | No | Specific price for the underlying energy. | €/kWh |
| Pin | Required | Mapping info |
|---|---|---|
| Fuel price | No | Specific price for the underlying energy in €/kWh. |
| Gas quantity | Yes | Cumulating timeseries in m3 |
| Attribute | Required | Mapping info | Unit |
|---|---|---|---|
| Calorific value of natural gas | No | Change to calorific value of delivered natural gas. Default: 13 kWh/m3 | kWh/m3 |
| Cost measurement device | Yes | Set to 'True' if this component should be considered in this analysis | binary |
| Fuel price | No | Specific price for the underlying energy. | €/kWh |
| Pressure compensation factor of natural gas | No | Additional factor to compensate for elevation and line pressure at the termination point. Default: 1 | - |
| Pin | Required | Mapping info |
|---|---|---|
| Heat price | No | Specific price for the underlying energy in €/kWh. |
| Heating energy | Yes | Cumulating timeseries in kWh |
| Attribute | Required | Mapping info | Unit |
|---|---|---|---|
| Cost measurement device | Yes | Set to 'True' if this component should be considered in this analysis | binary |
| Heat price | No | Specific price for the underlying energy. | €/kWh |
Recommend Time Span
1 month
Recommended Repetition
Monthly
- Continuously monitor energy costs
- Track success of a energy savings measure
Energy Efficiency
The Energy Efficiency analysis evaluates the quality of the energy conversion of a component, based on efficiency indicators. It is useful to detect inefficient operational states. Furthermore, information is provided regarding which part of the plant is responsible for the malfunction and what could be done to resolve the problem.
Value
- Reduced operational costs
- Detection of broken components
Recommended for components
- Combined heat and power
Checked conditions
- Efficiency of component
- Power to heat ratio (for component combined heat and power)
The Energy Efficiency analysis was applied to a real combined heat and power plant and the pins operating message, generator power, heat flow, and fuel power were mapped. Figure 1 shows the time series recorded for an exemplary period of 7 days. The grey shaded periods correspond to the operation of the plant.
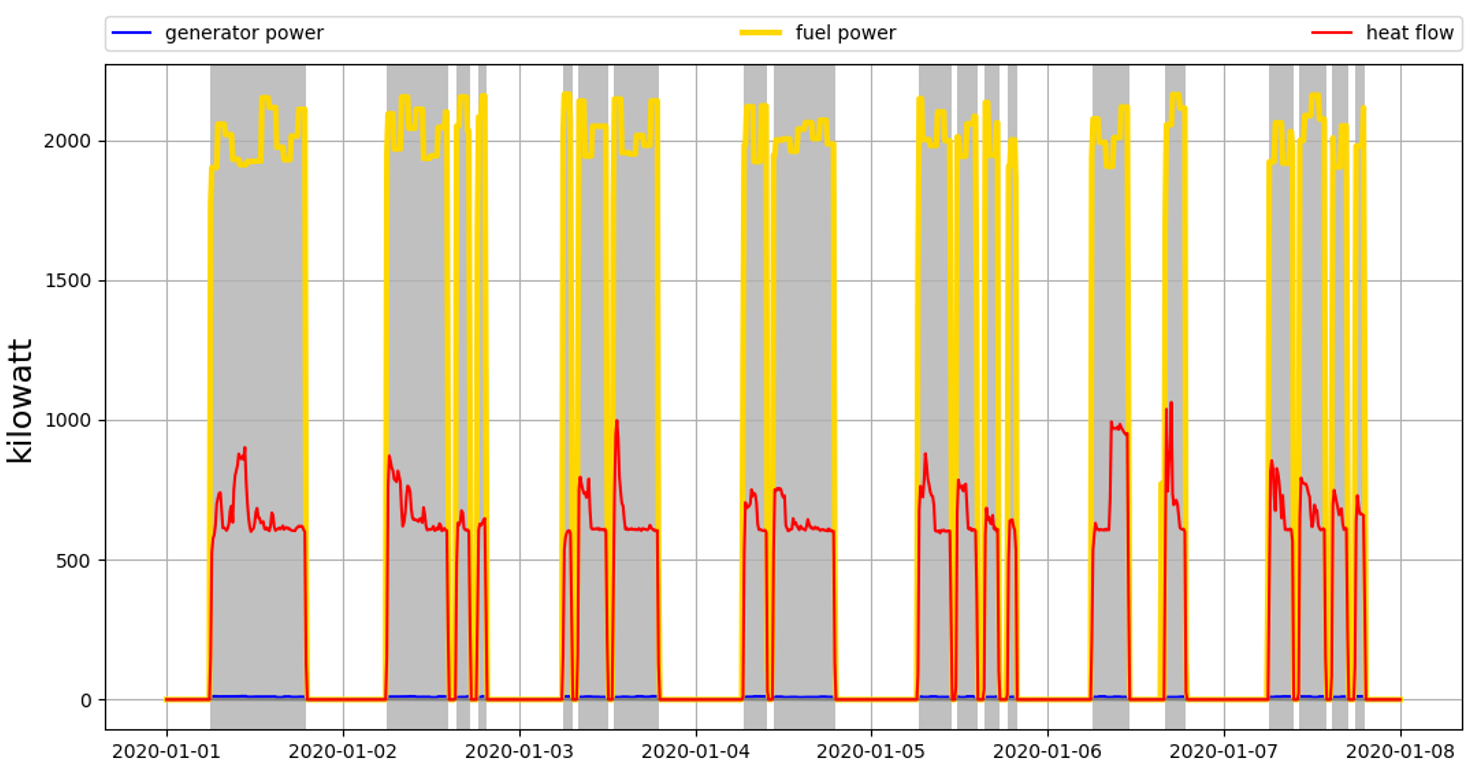
Figure 1: Period of one week for which the energy conversion is not acceptable
A very low generator power compared to the heat flow and the fuel power indicates a failure of the generator component. The automated interpretation confirms our visual analysis of the time series shown in the figure, summed up by the qualitative warning level “red”. It also provides recommendations to address the problem.
| KPI | Value | Unit |
|---|---|---|
| generator power.mean | 9.4 | kW |
| heat flow.mean | 640.9 | kW |
| fuel power.mean | 1940.3 | kW |
| power to heat ratio | 1.47 | % |
| fuel utilization factor | 33.5 | % |
| thermal efficiency | 33.0 | % |
| electric efficiency | 0.485 | % |
Signal colors
| Signal color | Available | Info |
|---|---|---|
| red | Yes | The quality of the energy conversion is not acceptable. |
| yellow | Yes | The quality of the energy conversion is suboptimal. |
| green | Yes | The quality of the energy conversion is good. |
Interpretations
| Available | Info |
|---|---|
| Yes | Interpretations summarize the result of the analysis. |
Recommendations
| Available | Info |
|---|---|
| Yes | Recommendations to improve energy conversion. No recommendation, in case of good energy conversion. |
KPIs
Energy Performance KPIs
| KPI Identifier | Info | Value Range | Unit |
|---|---|---|---|
| generator power.mean | Average generator power | 0 to inf | kW |
| fuel power.mean | Average fuel power | 0 to inf | kW |
| power to heat ratio | Cumulated electrical energy divided by the cumulated heat energy | 0 to inf | % |
| fuel utilization factor | Total efficiency of the plant (i.e., total heat and power divided by total energy provided by the fuel energy) | 0 to 100 | % |
| thermal efficiency | Cumulated heat energy divided by the total fuel energy | 0 to 100 | % |
| electrical efficiency | Cumulated electrical energy divided by the total fuel energy | 0 to 100 | % |
| Pin | Required | Mapping info |
|---|---|---|
| Operating message | No | - |
| Generator power | Yes | - |
| Heat flow | Yes | - |
| Rate of fuel consumption | No | - |
| Attribute | Required | Mapping info |
|---|---|---|
| Fuel price | No | Default: 0.06 €/kWh Gas |
| Electricity price | No | Default: 0.18€/kWh |
| Heat price | No | Default: 0.065 €/kWh |
| Generator nominal power | No | - |
| Nominal heat production | No | - |
Recommended Time Span
1 day to 1 week
Recommended Repetition
Every month
Filter Servicing
The Filter Servicing analysis predicts when a filter is due to be serviced or replaced, based on filter contamination or the pressure difference over the filter. This ensures that filters always function optimally and are maintained or replaced as required.
Value
- Ensures filter is serviced when required
- Improves energy efficiency
Recommended for components
- Filter
Checked conditions
- Filter contamination
- Expected time till filter service or replacement
In this example, the filter contamination of an exhaust air filter of an air handling unit was analyzed over a period of four months. As can be seen in figure 1, filter contamination gradually increases over the analyzed period.
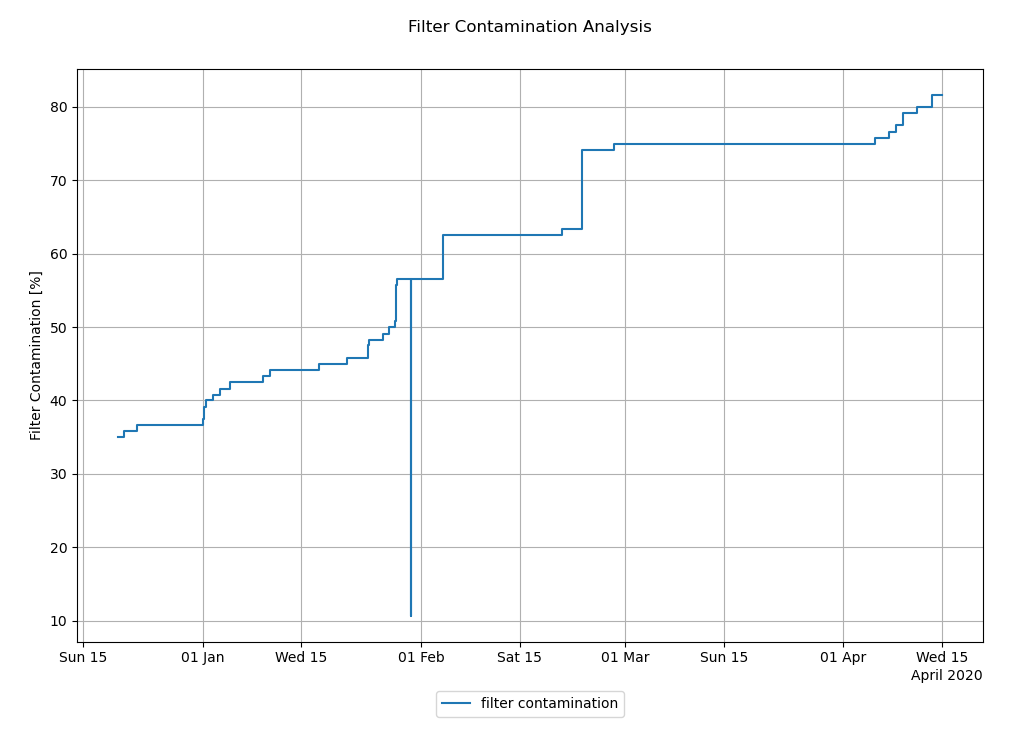
Figure 1: Filter contamination over a four month period
The signal analysis returns a green signal color since there is a significant amount of time before the filter is fully contaminated.
| KPI | Value | Unit |
|---|---|---|
| days until filter service | 35 | d |
| expected date of filter service | 2020-05-20 | date |
| filter contamination | 79.3 | % |
Signal colors
| Signal color | Available | Info |
|---|---|---|
| red | No | - |
| yellow | Yes | The filter is almost contaminated, a filter service should scheduled. |
| green | Yes | The filter is in a good condition and does not need to be serviced. |
Interpretations
| Available | Info |
|---|---|
| Yes | Information regarding the filter condition and whether the filter needs to be serviced. |
Recommendations
| Available | Info |
|---|---|
| Yes | Make necessary arrangements for the filter to be serviced. No recommendation if the filter does not need servicing within two weeks and the filter contamination is below 95%. |
KPIs
| KPI Identifier | Info | Value Range | Unit |
|---|---|---|---|
| days until filter service | Number of days until filter expected filter service | 0 to inf | d |
| expected date of filter service | Date on which filter is expected to require a service (format: YYYY-MM-DD) | - | date |
| filter contamination | Relative extent to which filter is contaminated | 0 to 100 | % |
| Pin | Required | Mapping info |
|---|---|---|
| Filter contamination | No | Either filter contamination (preferred) or pressure difference must be mapped. If both pins are mapped, filter contamination is used. |
| Pressure difference | No | Either filter contamination (preferred) or pressure difference must be mapped. If both pins are mapped, filter contamination is used. |
| Attribute | Required | Mapping info |
|---|---|---|
| Filter class | No | Default: F9 |
| Initial pressure difference | No | Default: initial pressure difference of filter class (50 Pa for filter class F9), setting this attribute is recommended. |
| Final pressure difference | No | Default: final pressure difference of filter class (300 Pa for filter class F9), setting this attribute is highly recommended. |
Recommended Time Span
1 month to 6 months
Recommended Repetition
Twice a month
Flexible Tariff
The Flexible Tariff analysis determines the potential electricity cost savings of a flexible electricity tariff compared to a fixed electricity tariff. The analysis evaluates the potential savings based on the electricity consumption profile during the analysis period. Therefore, the potential is evaluated purely through a tariff change without any assumption about the flexibility of the consumption profile. The flexible electricity tariff consists of a static and a dynamic part. The static part is defined by the attribute static part of the flexible electricity tariff of the respective component. The dynamic part is defined by the datapoint smard-price-service-forecast-00h-day-ahead-electricity-price. The fixed electricity tariff is defined by the attribute electricity price or alternatively by the pin electricity price and assumed to be the tariff currently applicable to the electricity meter. The saving potential is the difference between the actual electricity costs and the costs of a flexible tariff.
Value
- Calculation of the electricity costs if a flexible tariff had been used
- Comparison to the actual electricity costs and identification of a savings potential
- Indication if a flexible tariff would be economically beneficial based on the consumption profile in the analysis period
Recommended for components
- Building
- Electricity meter
Checked conditions
- Checks whether or not the use of a flexible tariff would have reduced costs
Figure 1 shows a scenario in which energy consumption coincides with relatively low electricity prices. In this example, the current fixed electricity price is 0.3 €/kWh. The static part of the flexible tariff is 0.2 €/kWh and the dynamic part is defined by the datapoint smard-price-service-forecast-00h-day-ahead-electricity-price.
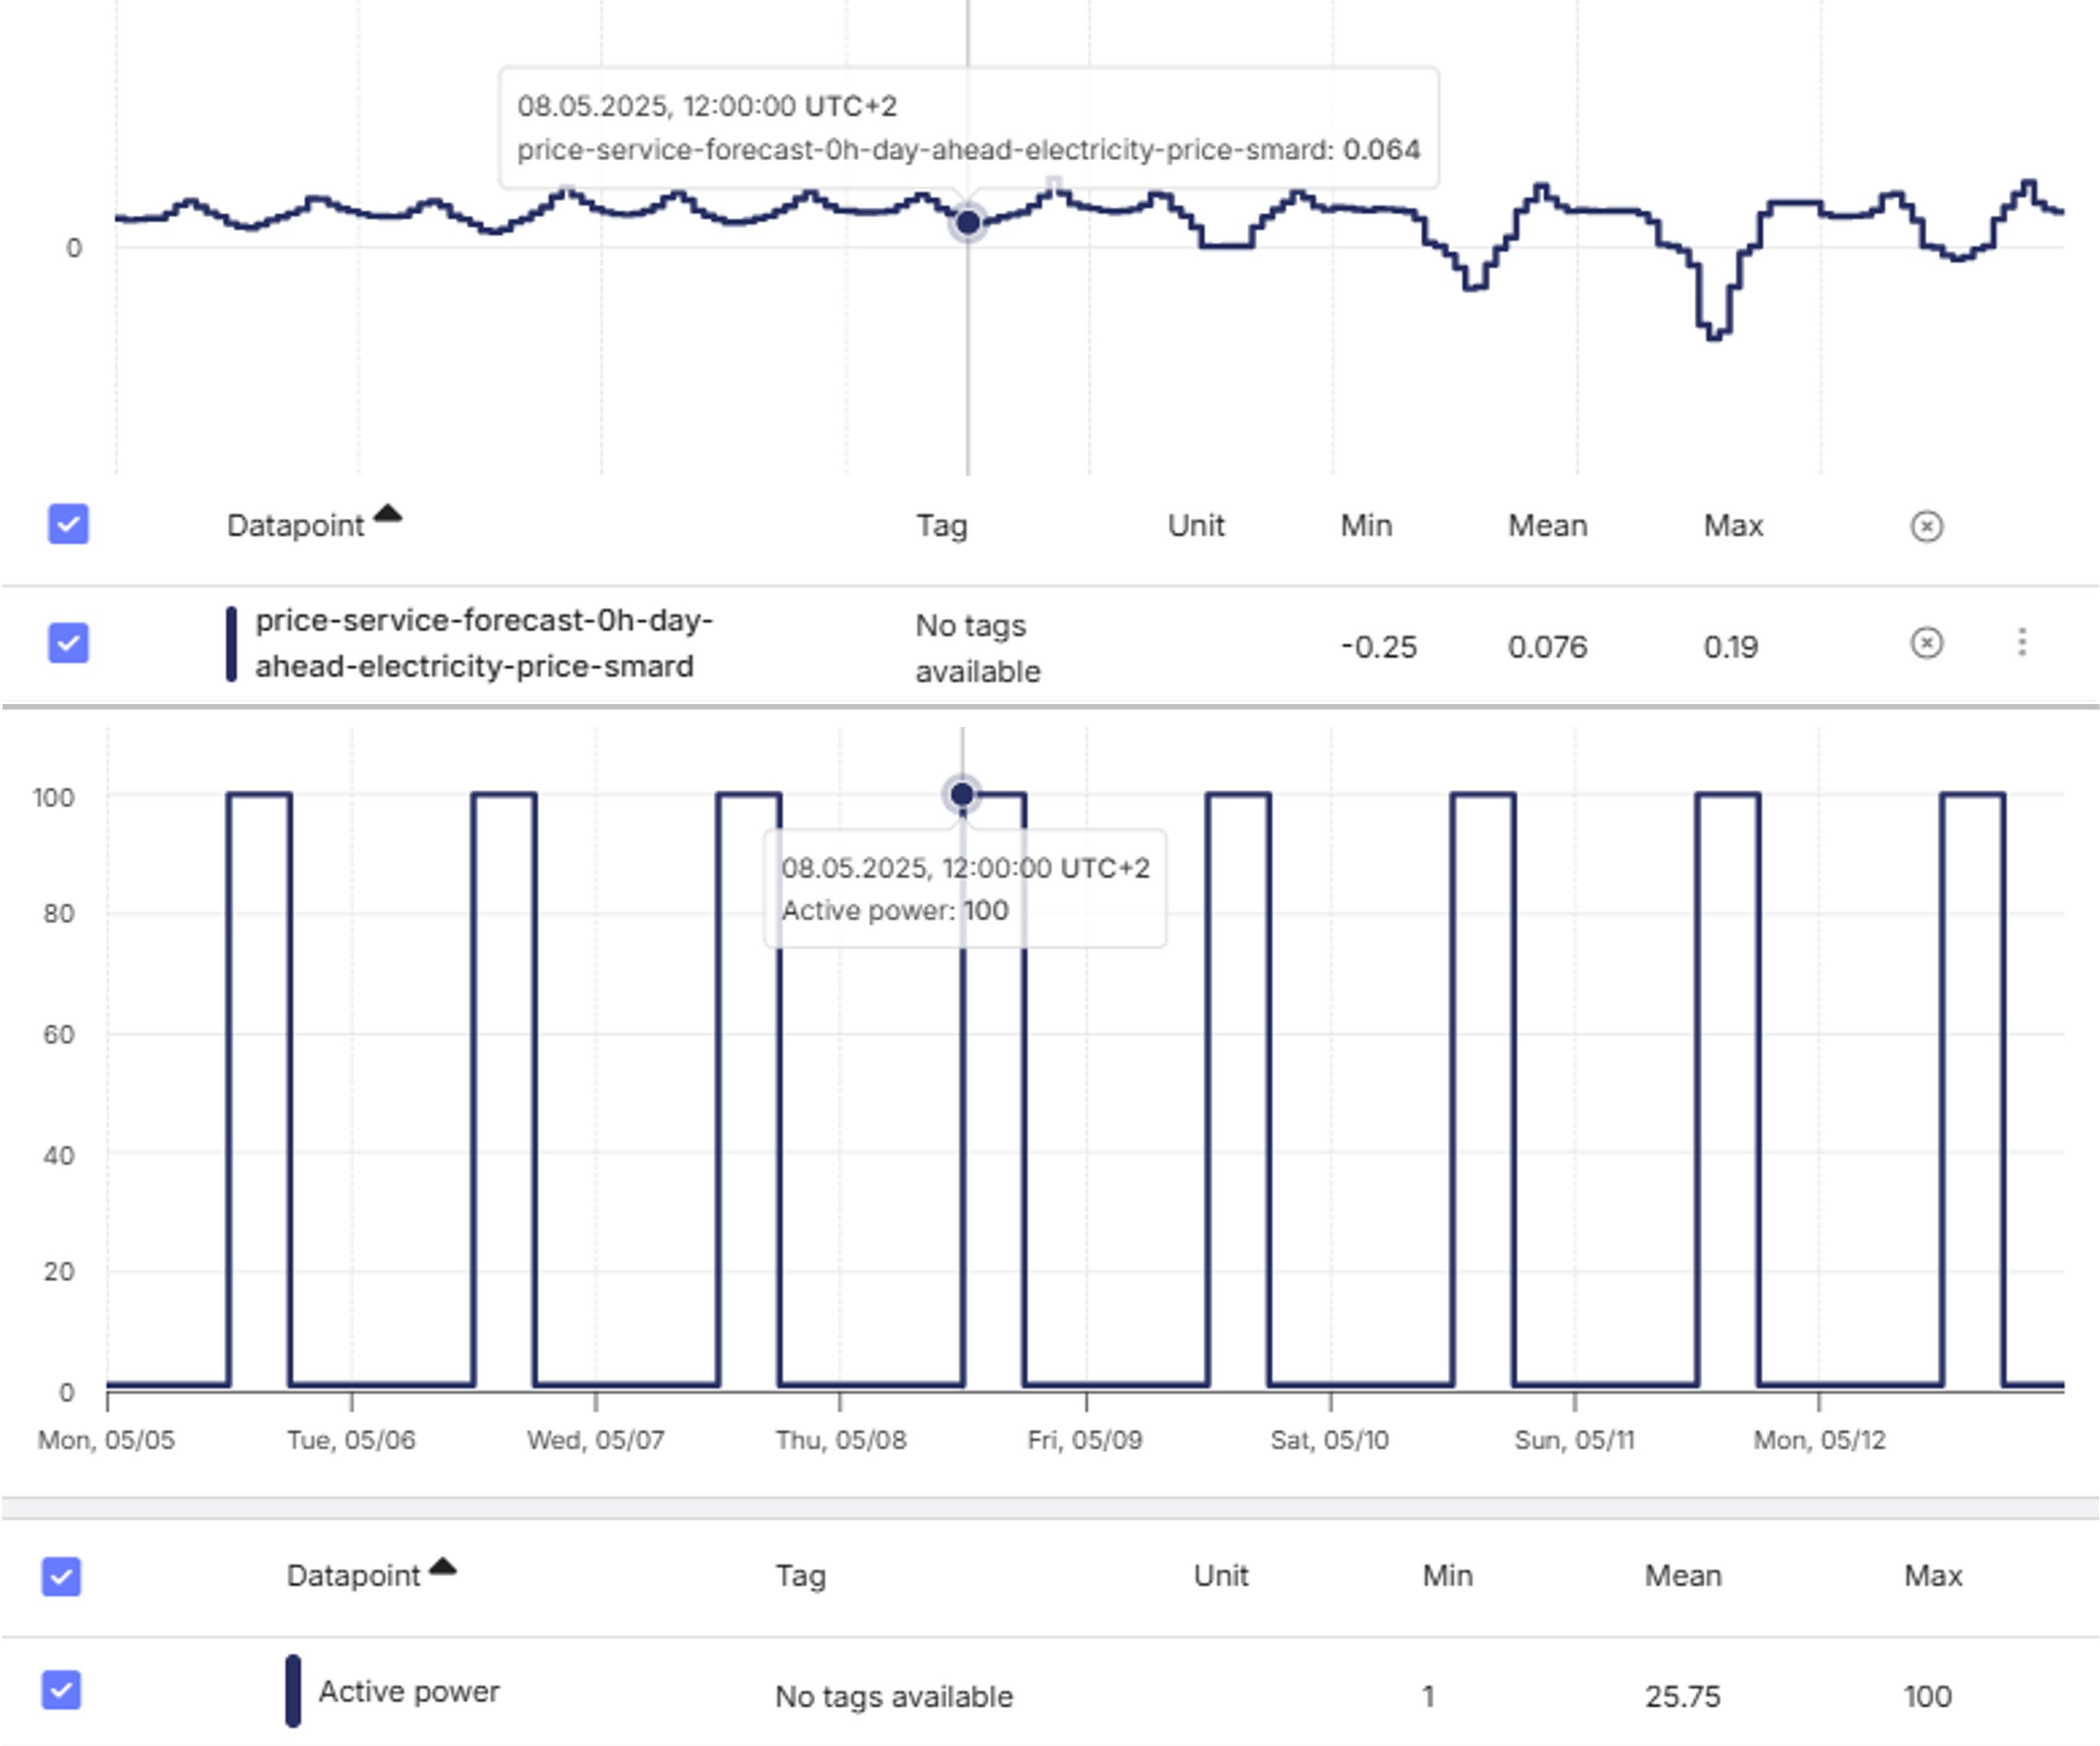
In this scenario, a flexible tariff would have saved 27.37 % of the costs compared to the costs with the current fixed tariff. Hence, the analysis returns a red signal color and a recommendation to consider a flexible tariff. The following KPIs are calculated:
| KPI | Value | Unit |
|---|---|---|
| Electrical energy | 4326 | kWh |
| Energy cost | 1298 | € |
| Energy cost.flexible tariff | 942.6 | € |
| savings potential | 355.2 | € |
| savings potential.relative | 27.37 | % |
Signal colors
To determine the signal color the KPI savings potential.relative is evaluated.
| Signal color | Available | Info |
|---|---|---|
| red | Yes | Savings potential found and the relative saving potential is greater than 10% |
| yellow | Yes | Savings potential found and the relative saving potential is below 10% |
| green | Yes | No savings potential found |
Interpretations
| Available | Info |
|---|---|
| Yes | Information if a saving potential is found or not |
Recommendations
| Available | Info |
|---|---|
| Yes | Recommendation to consider a flexible tariff. In addition, it is indicated if the datapoint smard-price-service-forecast-00h-day-ahead-electricity-price is missing. |
KPIs
| KPI Identifier | Info | Value Range | Unit |
|---|---|---|---|
| Electrical energy | Consumption of electrical energy during the analysis period | 0 to inf | kWh |
| Energy cost | Electricity costs of the current electricity tariff | 0 to inf | € |
| Average electricity price | Average electricity price of the current electricity tariff | 0 to inf | €/kWh |
| Energy cost.flexible tariff | Electricity costs if a flexible tariff had been used | -inf to inf | € |
| Average electricity price.flexible tariff | Average electricity price if a flexible tariff had been used | 0 to inf | €/kWh |
| savings potential | Costs savings if a flexible tariff had been used. Equal to the difference between Energy cost and Energy cost.flexible tariff | 0 to inf | € |
| savings potential.relative | Relative cost savings | 0 to 100 | % |
The analysis can be applied to the electricity meter or building component. The analysis function is very similar for both components. However, for the electricity meter component only one electricity meter is considered, whereas for the building component multiple electricity meters from the project are aggregated as sub-components.
| Pin | Required | Mapping info |
|---|---|---|
| Active energy | No | Candidate #1 for the electricity consumption |
| Active energy consumption values | No | Candidate #2 for the electricity consumption |
| Active power | No | Candidate #3 for the electricity consumption |
| Electricity price | No | The price of the current, fixed tariff needs to be provided by the attribute Electricity price or alternatively by the pin Electricity price |
| Attribute | Required | Mapping info |
|---|---|---|
| Electricity price | No | The price of the current, fixed tariff needs to be provided by the attribute Electricity price or alternatively by the pin Electricity price |
| Static part of the flexible electricity tariff | Yes | Default: 0.2 €/kWh |
In addition, the datapoint smard-price-service-forecast-00h-day-ahead-electricity-price must be available in the project to execute the analysis. This datapoint defines the dynamic part of the flexible electricity tariff.
There are no pins required for the building component because the information about the electricity consumption is obtained from the sub-components, which are the electricity meters of the project. Consequently, at least one electricity meter is required. All electricity meters with the attribute Cost measurement device not set to True are neglected.
| Pin | Required | Mapping info |
|---|---|---|
| - | - | - |
| Attribute | Required | Mapping info |
|---|---|---|
| Electricity price | No | The price of the current, fixed tariff needs to be provided by the attribute Electricity price of the electricity meter, by the pin Electricity price of the electricity meter or alternatively by the attribute Electricity price of the building. |
| Static part of the flexible electricity tariff | Yes | Default: 0.2 €/kWh |
Electricity meter as sub-component
| Pin | Required | Mapping info |
|---|---|---|
| Active energy | No | Candidate #1 for the electricity consumption |
| Active energy consumption values | No | Candidate #2 for the electricity consumption |
| Active power | No | Candidate #3 for the electricity consumption |
| Electricity price | No | The price of the current, fixed tariff needs to be provided by the attribute Electricity price of the electricity meter, by the pin Electricity price of the electricity meter or alternatively by the attribute Electricity price of the building. |
| Attribute | Required | Mapping info |
|---|---|---|
| Cost measurement device | Yes | Set to 'True' if this component should be considered in this analysis |
| Electricity price | No | The price of the current, fixed tariff needs to be provided by the attribute Electricity price of the electricity meter, by the pin Electricity price of the electricity meter or alternatively by the attribute Electricity price of the building. |
In addition, the datapoint smard-price-service-forecast-00h-day-ahead-electricity-price must be available in the project to execute the analysis. This datapoint defines the dynamic part of the flexible electricity tariff.
Recommended Time Span
1 month to 12 months
Recommended Repetition
Every month
Heat Demand
The heat demand analysis consolidates all billing-relevant heat energy meters to calculate the total heat demand of the building. The algorithm establishes a correlation between the heat demand and the outside air temperature of the building. The objective is to create a mathematical model that estimates the heat demand based on the outside air temperature. The base load energy, such as water heating, is calculated separately.
The analysis compares the current analysis period with a reference period to calculate energy savings.
Value
- Linear model representing the heat demand of the building
- Determination of a basic heat load e.g. for hot water energy demand
- Determination of a heating limit temperature
- Determination of a maximum heating power within one period
- Determination of zero heating power duration within one period
Recommended for components
Building with gas heating or district heating
Checked conditions
- Heat energy consumption of the building
- Comparison of heat energy consumption between different periods
- Energy saving calculation of reference period to analysis period
This example shows the monthly sampled heat energy of the main heat meter over the period of more than one year. As shown in Figure 1, a heating period between November and April and a period without required heating were selected.
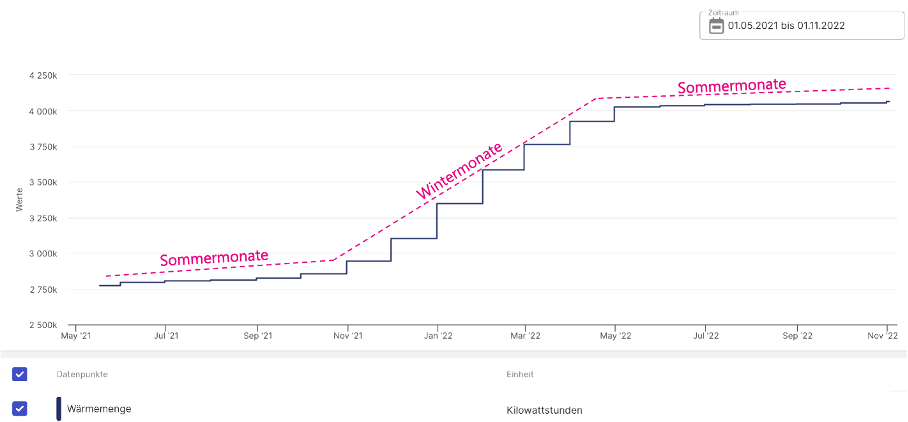
Figure 1: Heat meter energy samples with monthly resolution
The heat power values are derived from the energy demand values and after sorting in descending order they form the annual duration curve shown in Figure 2. The annual duration curve contains a part with zero heat demand (green) and a part with the greatest heat power of 1% (orange). Both parts and not considered when the heat demand model for the building is calculated.
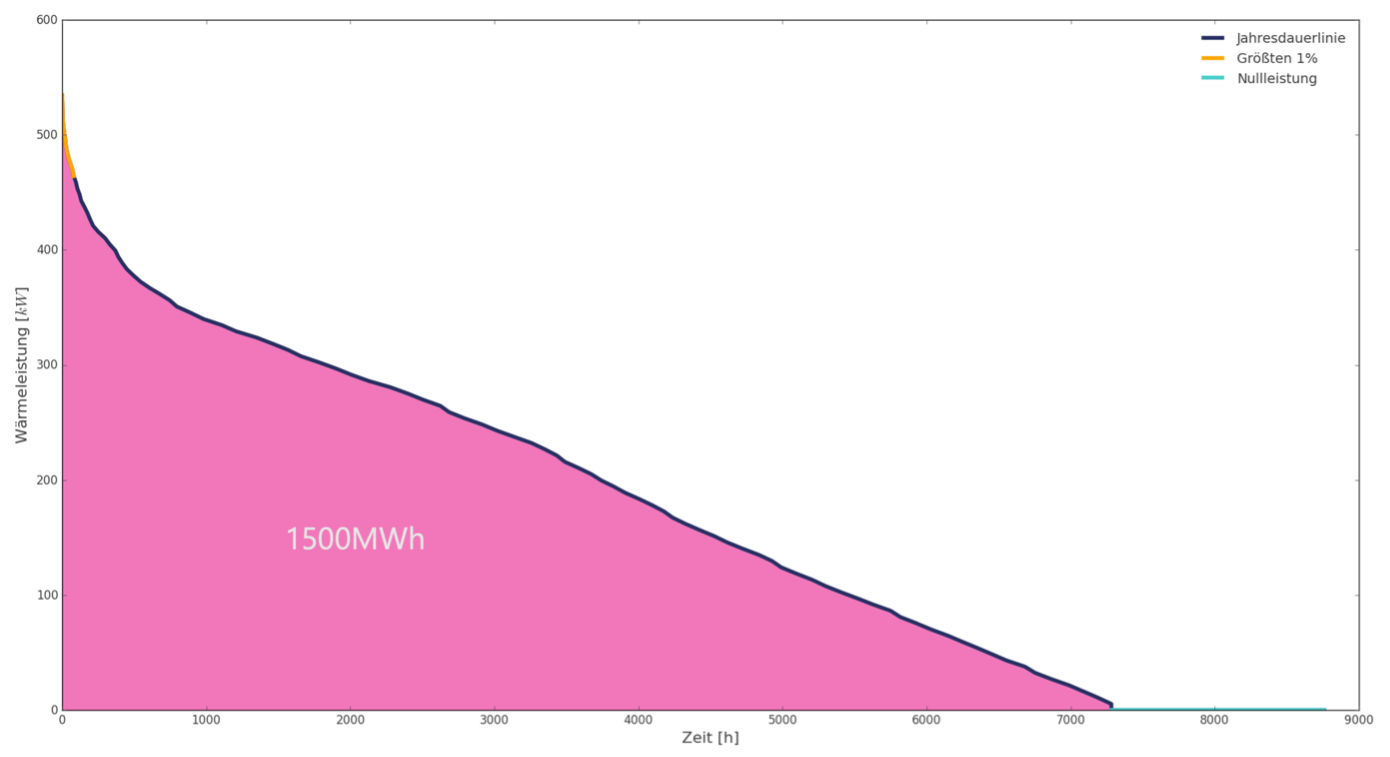
Figure 2: Annual duration curve of the heat power
With the help of the remaining parts of the annual load duration curve the heat demand model is fitted. The fitted model can be seen in Figure 3. The model requires information about the outside air temperature at every heat power observation. The values for the outside air temperature are obtained from the weather station component. With the power values assigned to the corresponding outdoor air temperature, a regression can be calculated to determine the heat demand as a linear function over the outside air temperature. As shown in Figure 3, the function has a slope of 18.7 kW/K and a heating power of 380 kW at an outside air temperature of 0 °C.
[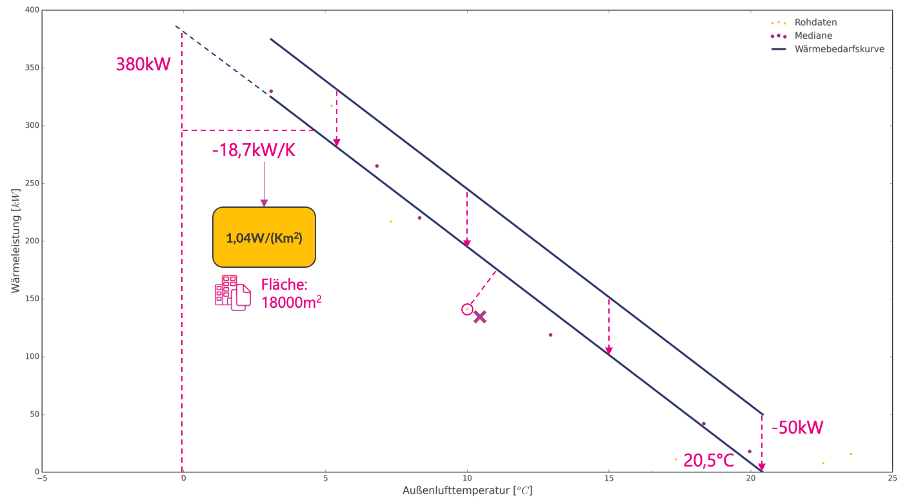 ]
]
Figure 3: Heat demand curve with base load power
Assuming a heating limit temperature of 20.5 °C, the basic heat output power requirement is 50 kW for e.g. hot water.
By determining a model for the heating behavior of the building in a reference period, a comparability with an analysis period can be achieved. If the heat energy demand in the analysis period has decreased by more than 5%, compared to the reference period, an energy saving is recognized as shown in Figure 4

Signal colors
| Signal color | Energy deviation | Info |
|---|---|---|
| red | positive | Energy consumption deviation > 5 % |
| yellow | equal | Energy consumption nearly equal |
| green | negative | Energy consumption deviation < -5 % |
Interpretations
| Signal color | Info |
|---|---|
| red | Energy losses are too high |
| yellow | Neither savings nor losses detected |
| green | Energy savings detected |
Recommendations
| Signal color | Info |
|---|---|
| red | Check in detail why the heat consumption has increased |
| yellow | - |
| green | Heat consumption has decreased |
KPIs
Summary KPI
Note
try: test reference year
anls: analysis period
| KPI reference | Info | Value Range | Unit |
|---|---|---|---|
| heat demand curve.offset | heat demand power \(\dot{Q}(\vartheta = 0\) \(^oC)\) | > 0 | kW |
| heat demand curve.slope | heat demand power slope \(m = \frac{d\dot{Q}}{d\vartheta}\) | < 0 | kW/K |
| heat demand curve.slope.specific | heat demand power slope \(m_A = \lvert \frac{m}{A} \rvert\) | > 0 | kW/Km2 |
| heat demand curve.outside temperature heating limit | heating limit temperature \(\vartheta_{limit}\) | > 0 | °C |
| heat demand curve.base load power | heat base load power \(\dot{Q}_{water}(\vartheta >= \vartheta_{limit})\) | > 0 | kW |
| test reference year.hot water demand.model-based | hot water energy in test reference year \(Q_{water} = \int\dot{Q}_{water}\) \(dt\) for \(T = T_{try}\) | > 0 | MWh |
| test reference year.total heat demand.model-based | total energy in test reference year \(Q_{total} = \int\dot{Q}_{total}\) \(dt\) for \(T = T_{try}\) | > 0 | MWh |
| test reference year.heat demand.model-based | heat energy in test reference year \(Q_{heat} = Q_{total} - Q_{water}\) | > 0 | MWh |
| analysis period.total heat demand.model-based | total energy in analysis period calculated by model \(Q_{total}\) for \(T = T_{anls}\) | > 0 | MWh |
| analysis period.hot water demand.model-based | hot water energy in analysis period calculated by model \(Q_{water}\) for \(T = T_{anls}\) | > 0 | MWh |
| analysis period.heat demand.model-based | heat energy in analysis period calculated by model \(Q_{heat}\) for \(T = T_{anls}\) | > 0 | MWh |
| analysis period.total heat demand.measured | total energy in analysis period measured by meter \(Q_{meas}\) for \(T = T_{anls}\) | > 0 | MWh |
| total heat demand difference | difference between model based and measured total energy \(\Delta Q = Q_{model} - Q_{meas}\) | \(\mathbb{R}\) | MWh |
| total heat demand difference.relative | relative difference total energy \(q = \frac{\Delta Q}{Q_{model}}\) | \(\mathbb{R}\) | % |
| Pin | Required | Mapping info | Unit |
|---|---|---|---|
| - | - | - | - |
Choose Base load power or Heating limit temperature upper limit. Only one of both attributes is necessary. The other value will be calculated as KPI
| Attribute | Required | Mapping info | Unit |
|---|---|---|---|
| Heating limit temperature upper limit | Yes* | Temperature limit where the heating system is not active | °C |
| Net floor area | Yes | Used to calculate the per area KPI for current value | m2 |
| Reference period end | Yes | End of reference period to calculate model | YYYY-MM-DD |
| Reference period start | Yes | Start of reference period to calculate model | YYYY-MM-DD |
| Thermal base load | Yes* | Power consumption independent of heat demand | kW |
Sub-components
Adding the weather station is mandatory. The analysis uses the outside air temperature as one of two input values.
The larger the temperature interval, the more accurate the heat demand analysis. If there are several weather stations, the first one is selected in alphabetical order of the component in project name.
| Pin | Required | Mapping info |
|---|---|---|
| Temperature | Yes | Needed as one of the key input values |
| Attribute | Required | Mapping info | Unit |
|---|---|---|---|
| - | - | - | - |
At least only one meter component is needed to get a result for this analysis function.
| Pin | Required | Mapping info |
|---|---|---|
| Gas quantity | Yes | Cumulating timeseries in m3 |
| Attribute | Required | Mapping info | Unit |
|---|---|---|---|
| Calorific value of natural gas | Yes | Change to calorific value of delivered natural gas. Default: 13 kWh/m3 | kWh/m3 |
| Pressure compensation factor of natural gas | Yes | Additional factor to compensate for elevation and line pressure at the termination point. Default: 1 | - |
| Cost measurement device | Yes | Indicates whether it is a relevant meter | bool |
| Pin | Required | Mapping info |
|---|---|---|
| Heating energy | Yes | Cumulating timeseries in kWh |
| Attribute | Required | Mapping info | Unit |
|---|---|---|---|
| Cost measurement device | Yes | Indicates whether it is a relevant meter | bool |
Recommend Time Span
1 year, but at least one full heating period and one period without heating demand
Recommended Repetition
monthly
- Continuously monitor energy savings in comparison to the reference period
Heat Pump Investment
The Heat pump investment analysis is an extension of the heat demand analysis with a heat pump simulation and an economic efficiency calculation.
The user can vary the boundary conditions of the physical and monetary domain to check if a heat pump is economically feasible for the heating system.
An electric heating element is assumed as an additional part of the heating system. Its electrical energy consumption is taken into account in the calculation of the annual coefficient of performance. The electrical energy is assumed to be equal to the thermal energy.
Value
- Hourly operating point simulation depending on heat demand and environmental heat
- Choice of different heat pump models and technologies from several manufacturers
- Energy saving calculation and conversion in cost and CO2 emission savings potential
- Investment calculation depending on
- cost savings
- interest rate
- depreciation rate (optional)
Recommended for components
Building with gas heating or district heating
Checked conditions
- Heat energy consumption of the building
- Efficiency potential of heat pump usage
- Payback period for heat pump investment
This example shows a simulation of an air/water heat pump. For a brief technical explanation, see Figure 1.

The schematic shows only one of several operating points with a coefficient of performance (COP) about 3. This means that with 150 kW of electric power, a heating power of 450 kW can be provided by taking 300 kW from the environment. In reality, small transmission losses occur, but they are neglected for this simulation.
For a detailed simulation, all operating points must be taken into account. As shown in Figure 2, a coefficient of performance map is used to calculate several operating points, depending on the condenser and evaporator temperature. The evaporator temperature is nearly equal to the outside air temperature. Therefore, the outside air temperature acts as one of two input values. The condenser temperature is nearly equal to the supply temperature of the heating system. Therefore, the supply temperature acts as the second input value.
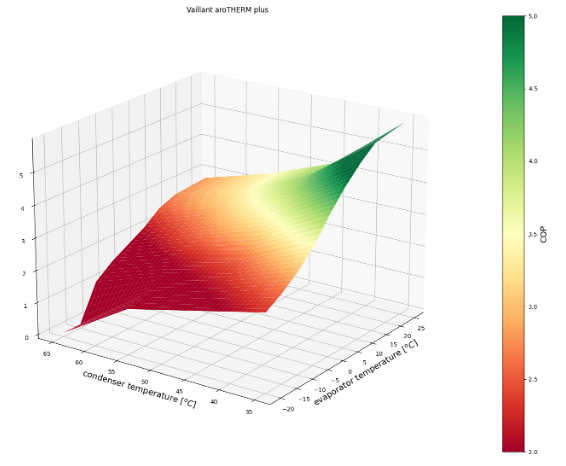
Figure 2: COP map air/water heat pump
To simulate an entire year of average weather conditions of the last decade, a test reference year is used with hourly resolution. As shown in Figure 3, the outside air temperature ranges from -8°C to 34°C, while in previous years lower and higher temperatures have been measured sporadically. Since these more extreme temperatures only occur on a few hours per year, they are not significant for a general heat pump design.
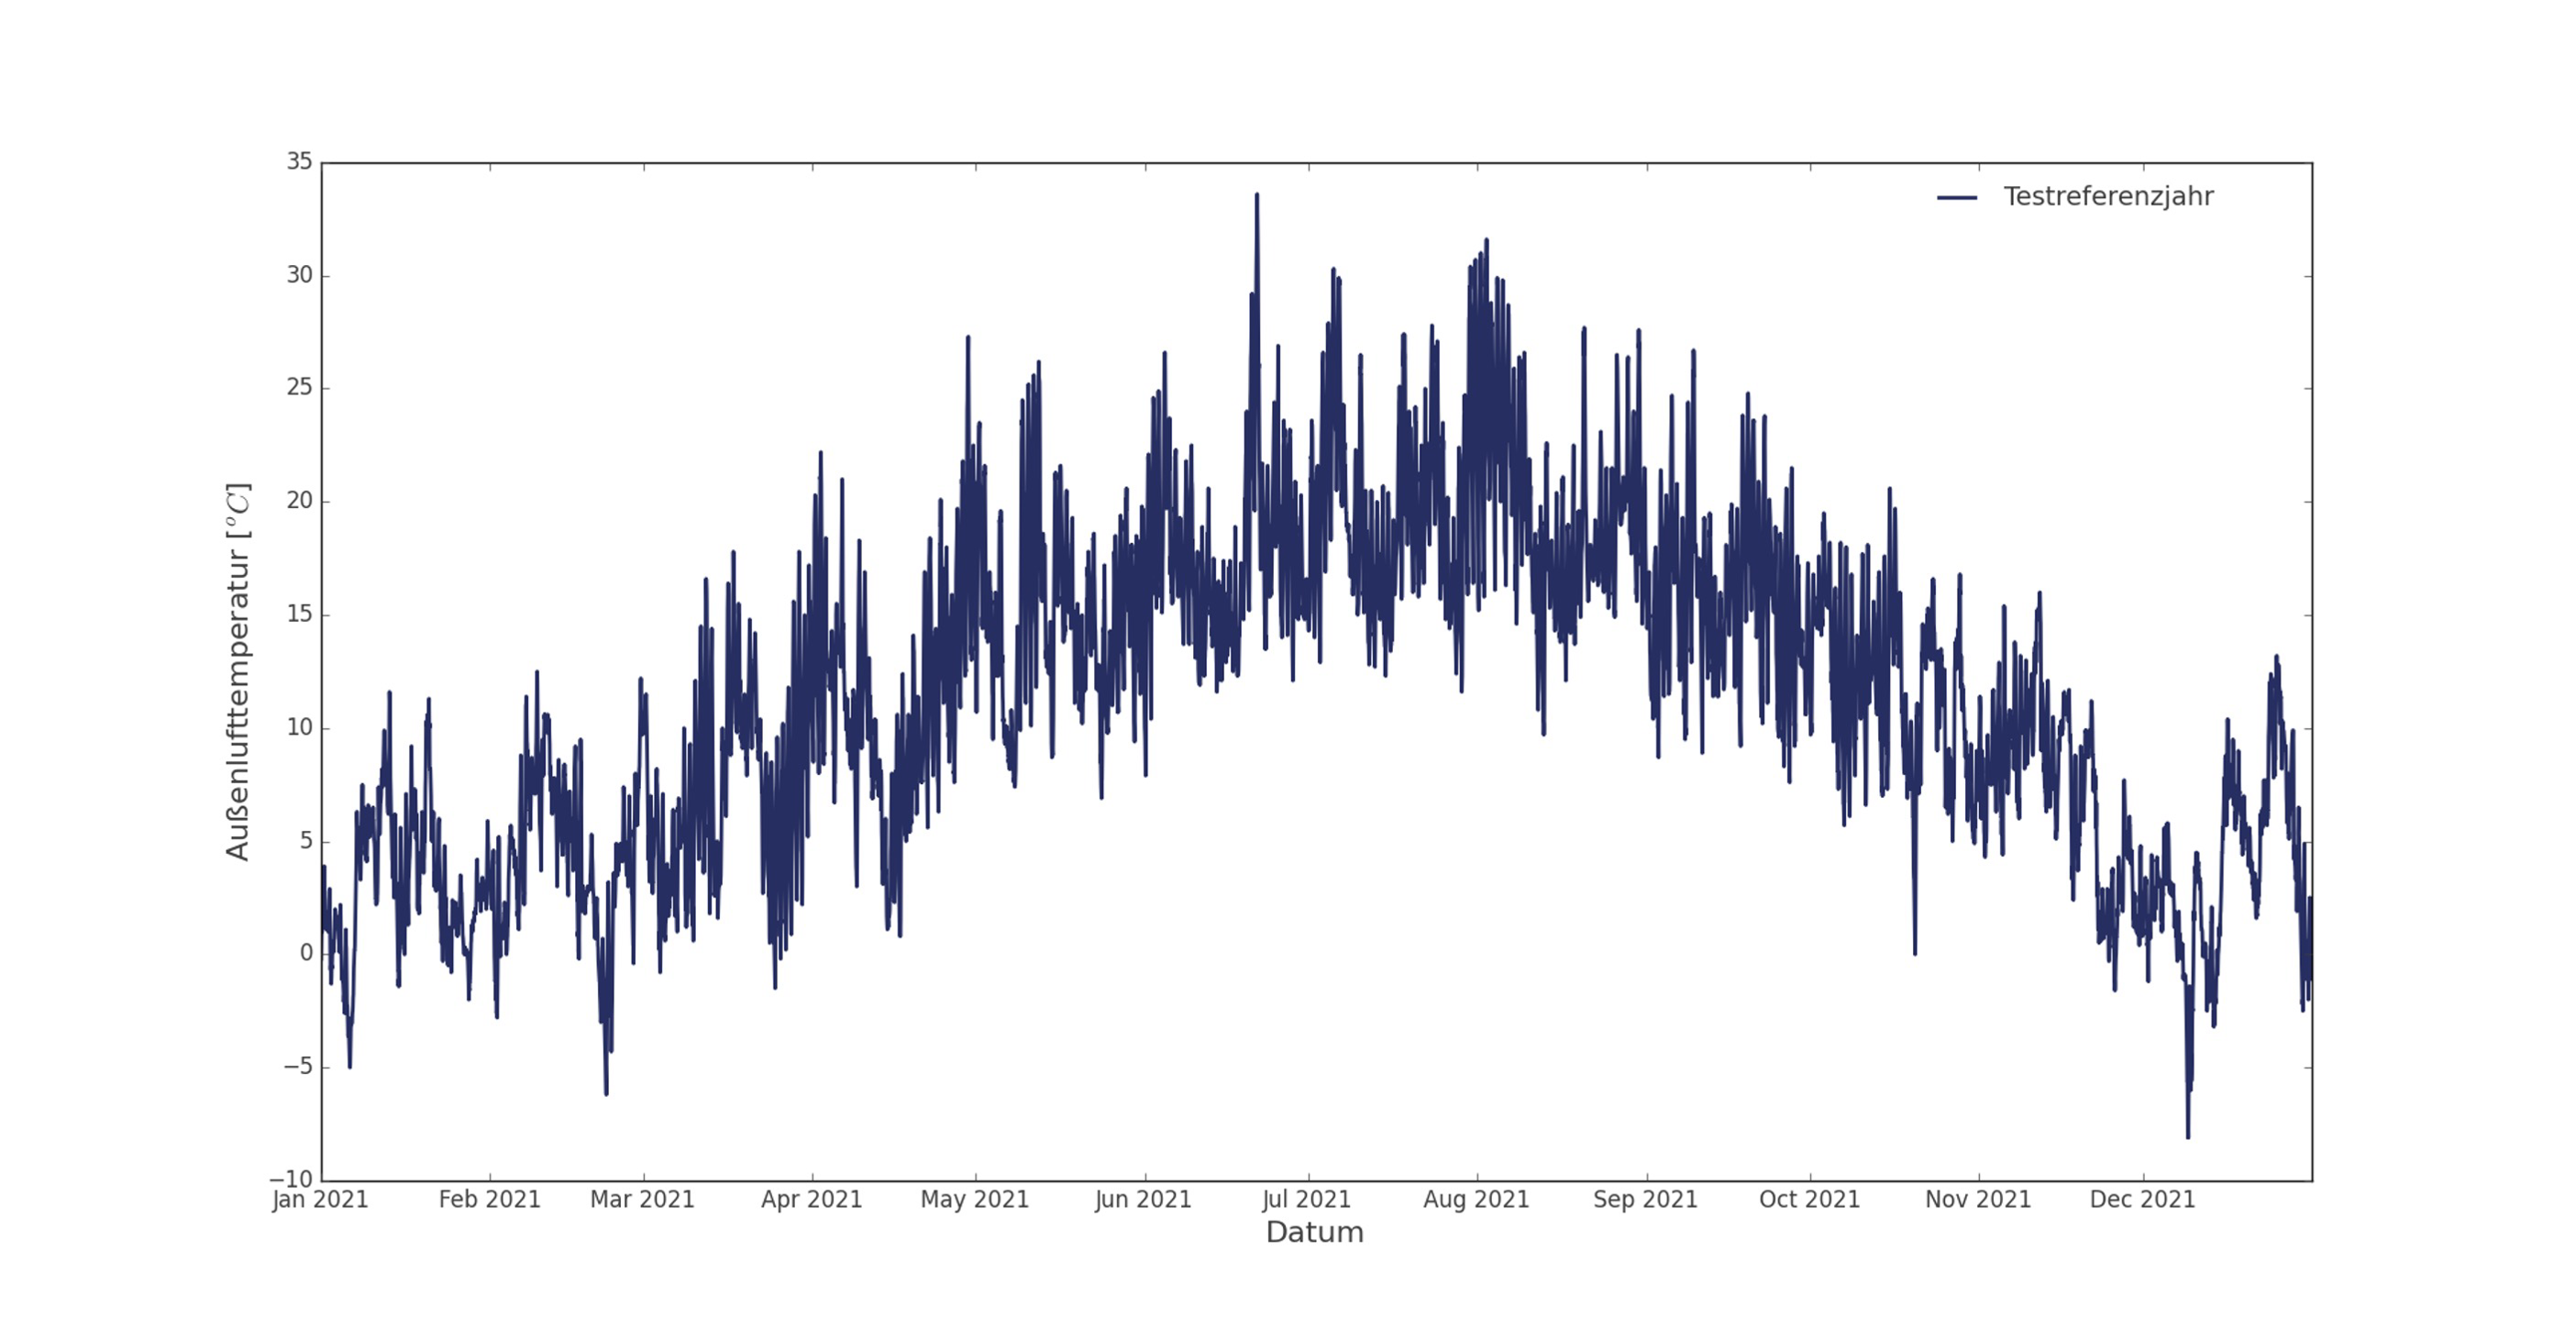
Figure 3: Test reference year outside air temperature
The example is continued to calculate the heating power based on the outside air temperature. As shown in Figure 4 the resulting power ranges from 0 to 530 kW.
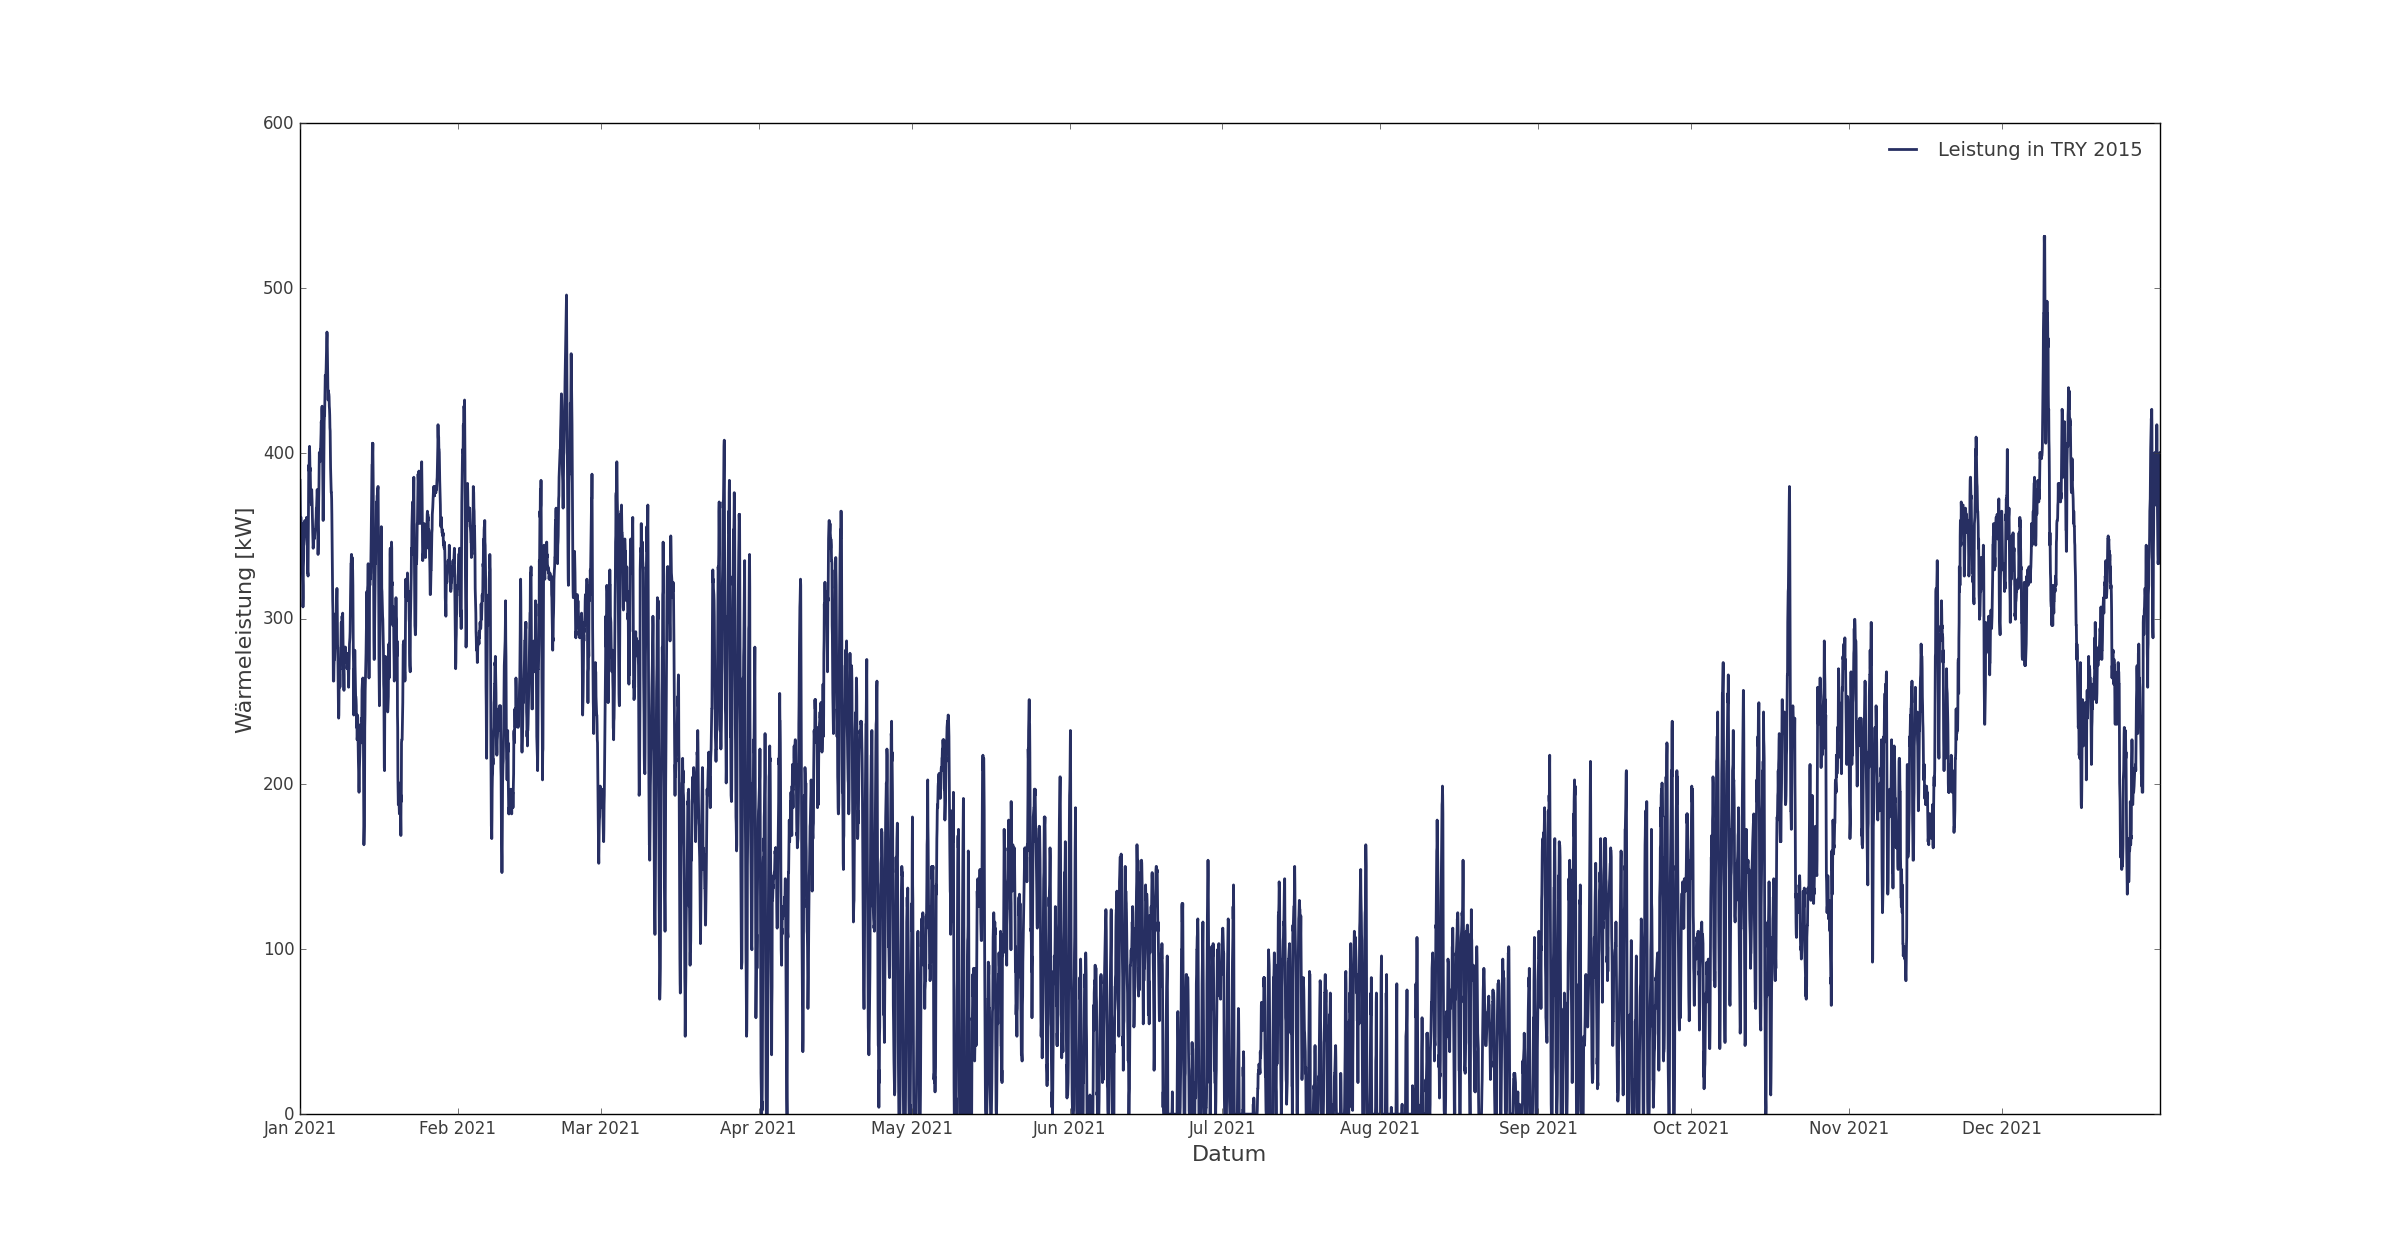
Figure 4: Heating power (TRY2015)
To determine the supply temperature, it is assumed that the temperature spread relates directly to the heating power, where the mass flow is constant. By specifying a maximum supply temperature as a simulation parameter, a function increasing with the heating power and decreasing with the outside air temperature is obtained. Depending on the current heating power, the temperature spread is assumed to calculate the sink temperature. As shown in Figure 5, the supply temperature decreases down from 65 °C to the outside air temperature of 20.5 °C, where the heating power becomes 0 kW. Since the heating power is zero from this point, the temperature spread is also set to zero. Thus, the supply temperature and sink temperature do not change anymore.
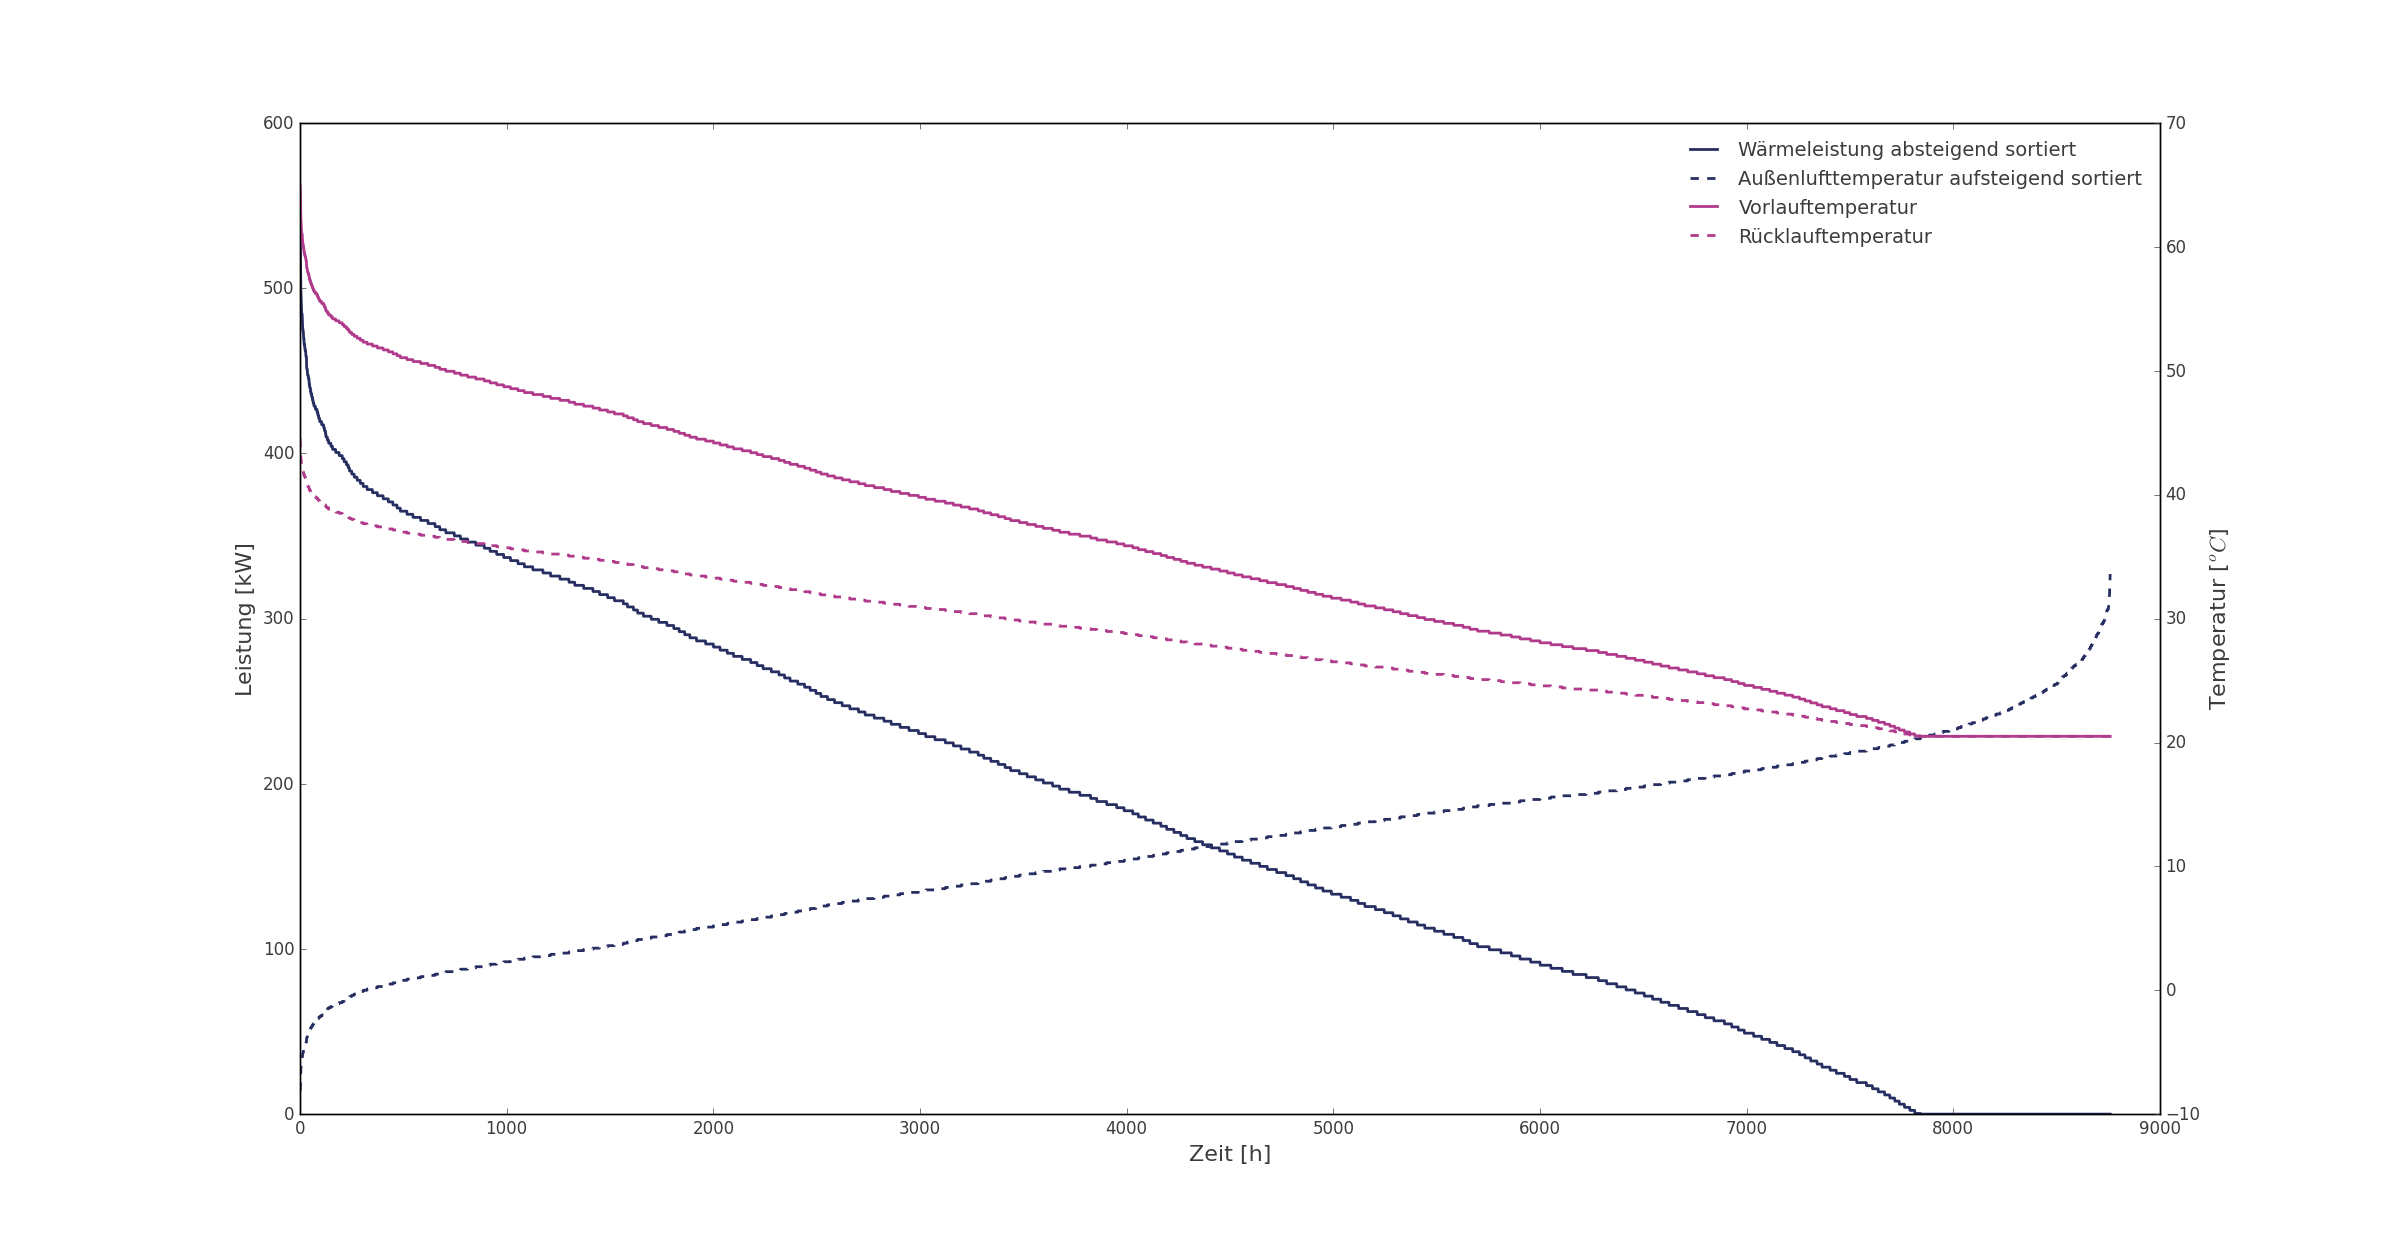
Figure 5: Supply temperature and sink temperature (TRY2015)
By varying the nominal heating power and the maximum supply temperature, an optimum can be found at which the electrical energy consumption is minimized and the resulting annual coefficient of performance is maximized. At all operating points that cannot be covered by the heat pump alone, the electric heating element supports the heat pump. The energy of the electric heating element is taken into account when calculating the annual coefficient of performance. Figure 6 visualizes the results of all calculations, where the annual coefficient of performance is shown in a heat map.
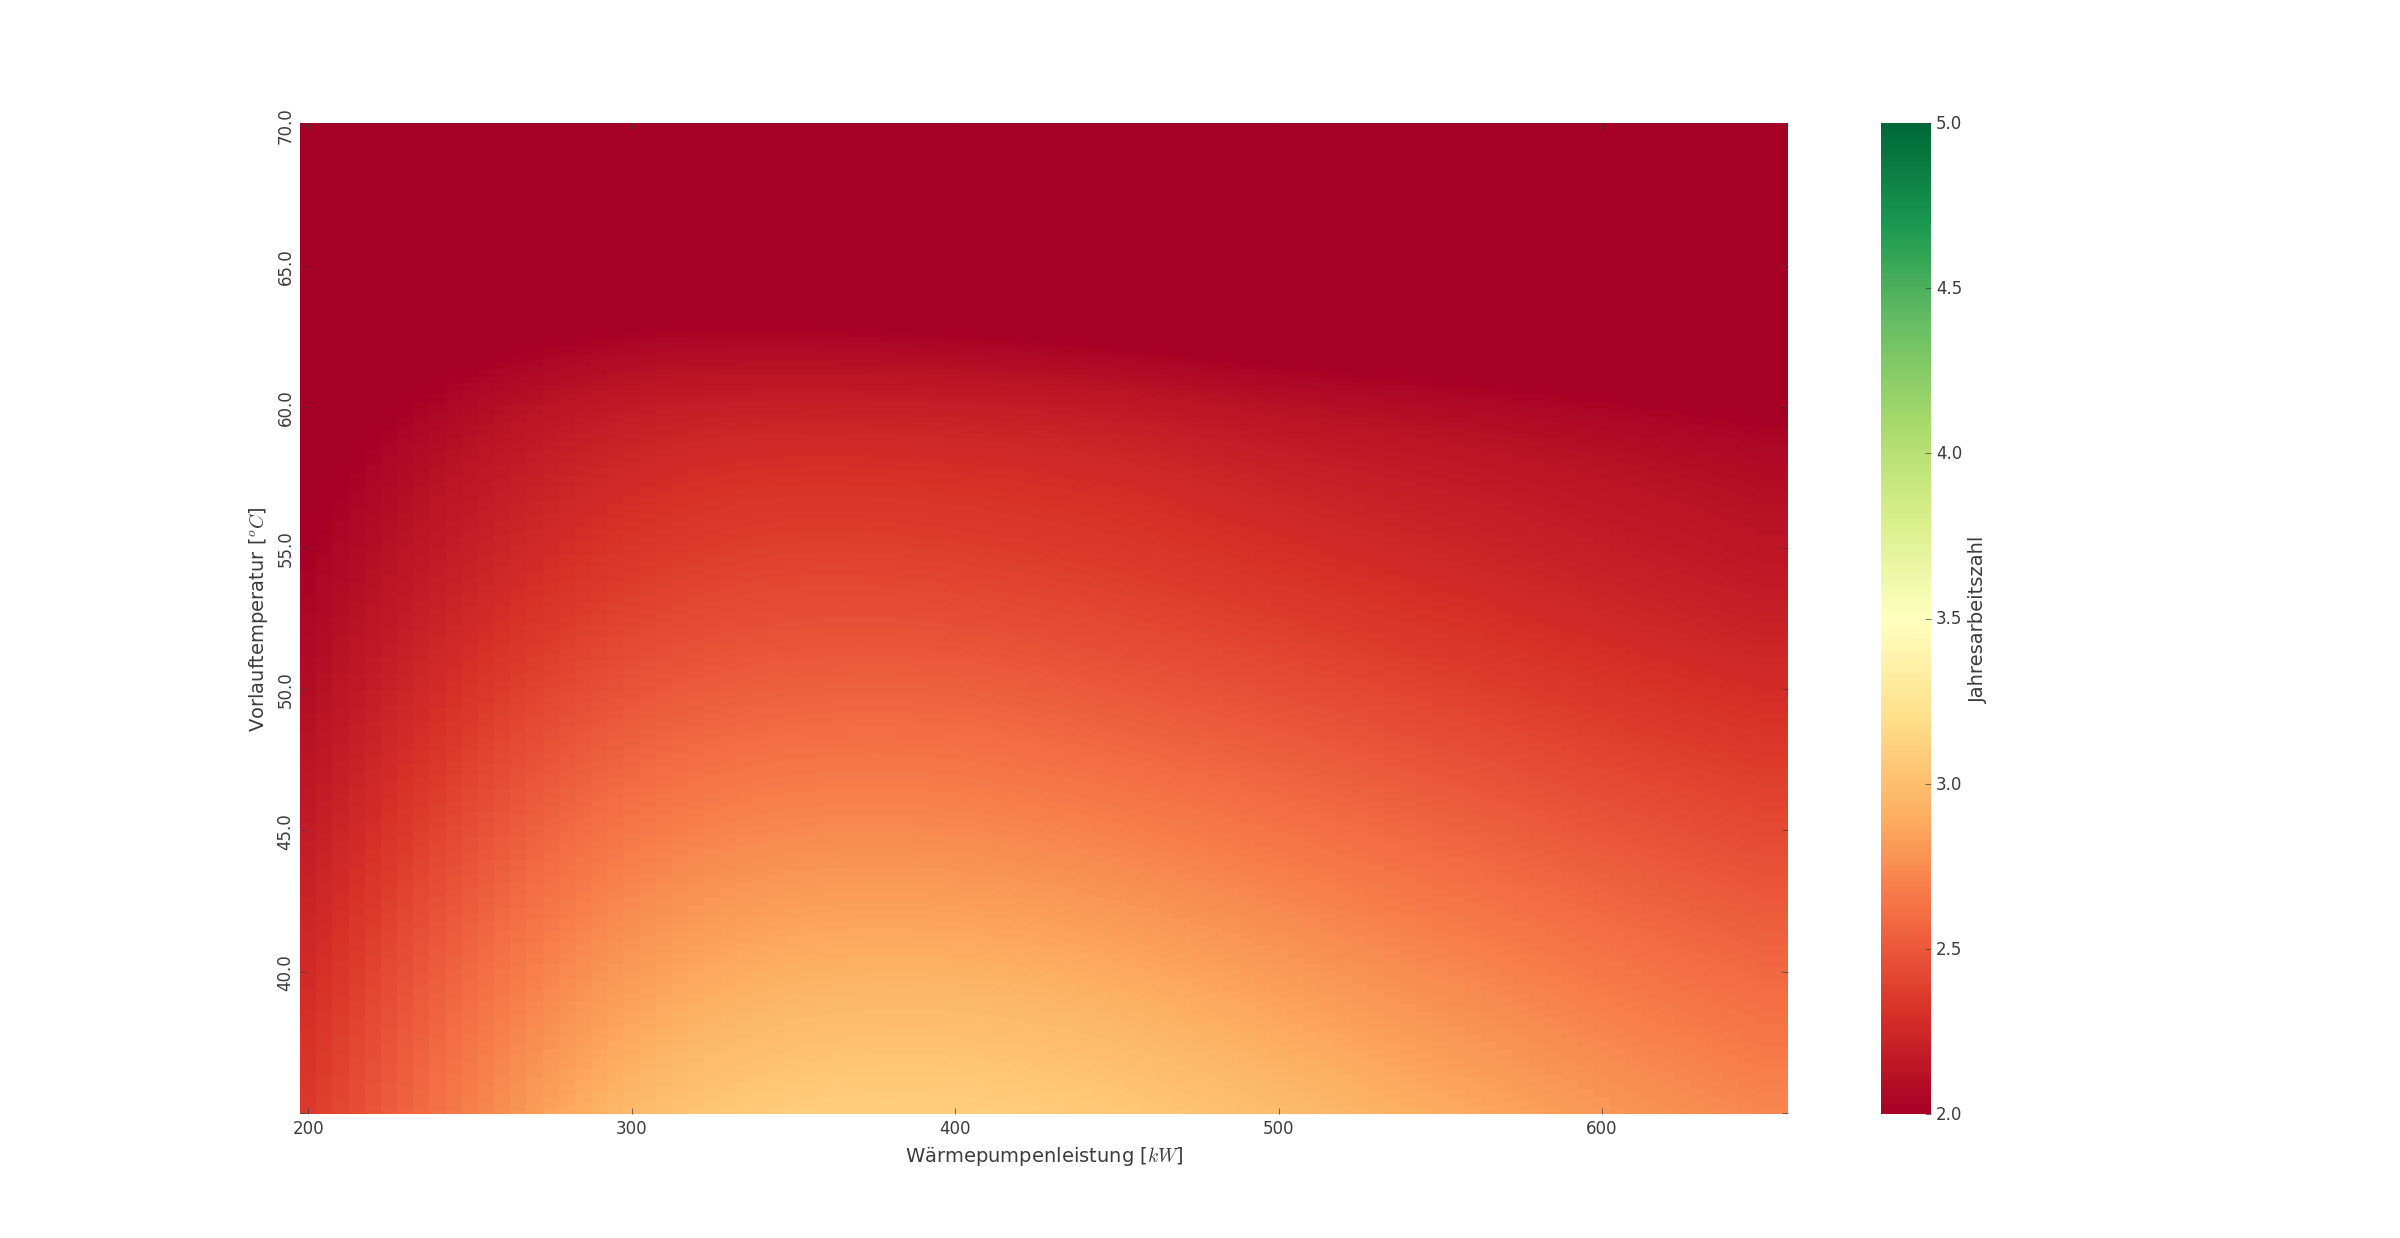
Figure 6: Simulation results at different supply temperature and nominal power
Technical heat pump KPIs
While the maximum demanded heat power is 530 kW, the optimum heat pump power is selected to 360 kW at a design supply temperature of 50 °C. Thus, the majority of all operating points in the test reference year can be covered with 1400 MWh, especially for this heating system. The remaining heat energy about 100 MWh is provided by a heating element with 170 kW. With an annual cop about 2.53, the electric energy consumption is about 570 MWh.
Economic heat pump KPIs
Assuming an electricity price and a heat energy/gas price of the existing heating system, a cost saving can be calculated. In addition to the investment cost of the heat pump installation, other investment parameters can be taken into account. This includes:
-   Price increase rate of energy costs
-   Calculation interest rate
-   Depreciation period
With an installation price of 800 €/kW the heat pump, including installation and material, the total investment is about 295700 €. Assuming an electricity price about 0.24 €/kWh and a heat energy price about 0.12 €/kWh, we get a total cash flow about 298600 € after 5 years. The cash flow considers a yearly price increase rate of energy costs about 3% and a calculation interest rate about 12%. Thus, the annual cash flow is discounted and accumulated to a total cash flow. Where the CO2 emission factor of the current heating system is assumed with 0.2 kg/kWh, the CO2 emission factor of the electric net supply is assumed with 0.4 kg/kWh. Nevertheless, a CO2 saving of 63 t/a is achieved, since the primary amount of energy is significantly lower with 570 MWh.
As a result, a payback period of 5 years is sufficiently small to consider a closer look.
The interpretation would be:
The conditions for a heat pump investment are suitable
The recommendation would be:
It might make sense to further review the energy system. For this you could contact a specialist planner.
In this case red is chosen to attract attention, as the investment seems to be profitable
Signal colors
| Signal color | Payback period time | Info |
|---|---|---|
| red | short | Payback period < 5 years |
| yellow | medium | Payback period <= 10 years |
| green | too long | Payback period > 10 years |
Interpretations
| Signal color | Info |
|---|---|
| red | The conditions for a heat pump investment are satisfying |
| yellow | The conditions for a heat pump investment are suitable |
| green | The conditions for a heat pump investment are not suitable |
Recommendations
| Signal color | Info |
|---|---|
| red | It is recommended to further check the energy system. To do this, you should contact a specialist planner. |
| yellow | It might make sense to further review the energy system. For this you could contact a specialist planner. |
| green | A closer look at the energy system is not recommended. |
KPIs
Summary KPI
Note
try: test reference year
| KPI reference | Info | Value Range | Unit |
|---|---|---|---|
| annual cop | annual coefficient of performance \(\frac{Q_{total}}{W_{electric}} = \frac{Q_{heat\_pump}+Q_{peak\_unit}}{W_{heat\_pump}+Q_{peak\_unit}}\) | > 0 | - |
| nominal power.heat pump.thermal | thermal nominal power of the heat pump \(\dot{Q}_{heat\_pump}\) | > 0 | kW |
| nominal power.peak power unit.thermal | thermal nominal power of the peak power unit \(\dot{Q}_{peak\_unit}\) | > 0 | kW |
| total heating energy | Total heat energy consumption of the building in a test reference year \(Q=Q_{heat\_pump}+Q_{peak\_unit}\), \(T = T_{try}\) | > 0 | MWh |
| energy supply.heat pump.thermal | Thermal energy supply of the heat pump \(Q_{heat\_pump} = \int\dot{Q}_{heat\_pump}\) \(dt\) for \(T = T_{try}\) | > 0 | MWh |
| energy consumption.heat pump.electric | Electric energy consumption of the heat pump \(W_{heat\_pump} = \int P_{heat\_pump}\) \(dt\) for \(T = T_{try}\) | > 0 | MWh |
| energy supply.peak power unit.thermal | Thermal energy supply of the peak power unit \(Q_{peak\_unit} = \int\dot{Q}_{peak\_unit}\) \(dt\) for \(T = T_{try}\) | > 0 | MWh |
| investment | The investment cost for a heat pump where the installation and the peak power unit is included | > 0 | € |
| annual cash flow | The net cash flow due to cost savings from primary energy reduction per year | \(\mathbb{R}\) | €/a |
| amortization period | The number of years until the investment is payed back by the discounted cumulated cashflow | > 0 | a |
| CO2 emissions.new energy system | CO2 emissions emitted by the new energy system in a test reference year | > 0 | kg |
| CO2 emissions.old energy system | CO2 emissions emitted by the old energy system in a test reference year | > 0 | kg |
| Pin | Required | Mapping info | Unit |
|---|---|---|---|
| - | - | - | - |
Choose Base load power or Heating limit temperature. Only one of both attributes is necessary. The other value will be calculated as KPI
| Attribute | Required | Mapping info | Unit |
|---|---|---|---|
| Base load power | Yes* | Power consumption independent of heat demand | kW |
| Heating limit temperature | Yes* | Temperature limit where the heating system is not active | °C |
| Net floor area | Yes | Used to calculate the per area KPI for current value | m2 |
| Reference period start | No | Start of reference period to calculate model | YYYY-MM-DD |
| Reference period end | No | End of reference period to calculate model | YYYY-MM-DD |
| Investment - CO2 emission factor current energy system | Yes | CO2 emissions per energy unit for current heating system | kg/kWh |
| Investment - CO2 factor new energy system | Yes | CO2 emissions per energy unit for the heat pump | kg/kWh |
| Investment - Heat pump type | Yes | Distinguished in Water/Water and Air/Water. Choose from dropdown Heat pump types below | - |
| Investment - depreciation period new energy system | Yes | Depreciation period to consider the tax effect | a |
| Investment - design temperature heating system | Yes | Supply temperature of the heating system | °C |
| Investment - electricity price heat pump | Yes | Energy price new heating system | €/kWh |
| Investment - interest rate | Yes | Calculation interest rate to discount the annual cash flow | % |
| Investment - specific energy price current heating system | Yes | Current energy price | €/kWh |
| Investment - specific installation price new energy system | Yes | Specific installation price for the heat pump | €/kW |
Heat pump types
Sub-components
Adding the weather station is mandatory. The analysis uses the outside air temperature as one of two input values.
If the temperature value of the current weather station does not seem reliable or plausible, it is recommended to create a weather station component Analyse Wetterstation. The pin Temperatur should be mapped with the weather service data point to get a reliable and gap free time series. The weather station is sorted alphabetically. The first one will be chosen for the analysis.
The larger the temperature interval, the more accurate the heat demand analysis.
| Pin | Required | Mapping info |
|---|---|---|
| Temperature | Yes | Needed as one of the key input values |
| Attribute | Required | Mapping info | Unit |
|---|---|---|---|
| - | - | - | - |
At least only one meter component is needed to get a result for this analysis function.
| Pin | Required | Mapping info |
|---|---|---|
| Gas quantity | Yes | Cumulating timeseries in m3 |
| Attribute | Required | Mapping info | Unit |
|---|---|---|---|
| Calorific value of natural gas | Yes | Change to calorific value of delivered natural gas. Default: 13 kWh/m3 | kWh/m3 |
| Pressure compensation factor of natural gas | Yes | Additional factor to compensate for elevation and line pressure at the termination point. Default: 1 | - |
| Cost measurement device | Yes | Indicates whether it is a relevant meter | bool |
| Pin | Required | Mapping info |
|---|---|---|
| Heating energy | Yes | Cumulating timeseries in kWh |
| Attribute | Required | Mapping info | Unit |
|---|---|---|---|
| Cost measurement device | Yes | Indicates whether it is a relevant meter | bool |
Recommend Time Span
1 year, but at least one full heating period and one period without heating demand
Recommended Repetition
monthly
- Continuously monitor the energy consumption for a replacement investment recommendation
Humidity Conditioning
The Humidity Conditioning analysis compares the outside air humidity with the actual supply air humidity of the Air Handling Unit (AHU).
This analysis does not take into account air recirculation and humidity recovery modes. Make sure that the system is operated without such operational modes.
Value
- Detect operating conditions of AHUs that are not appropriate to the outside air conditions
- Avoids unnecessary changes in humidity, which cost a lot of energy
- Verifies sufficient supply air humidity
Recommended for components
- Air handling units with humidity conditioning
Checked conditions
- Compare actual operating hours with humidification, dehumidification, and no operation with the corresponding expected hours
This example shows a week of analysis for a summer scenario in July. The AHU is operating throughout the week. Relative humidity conditions are displayed in red and orange, green and blue are temperature conditions and brown and purple are the water load conditions.
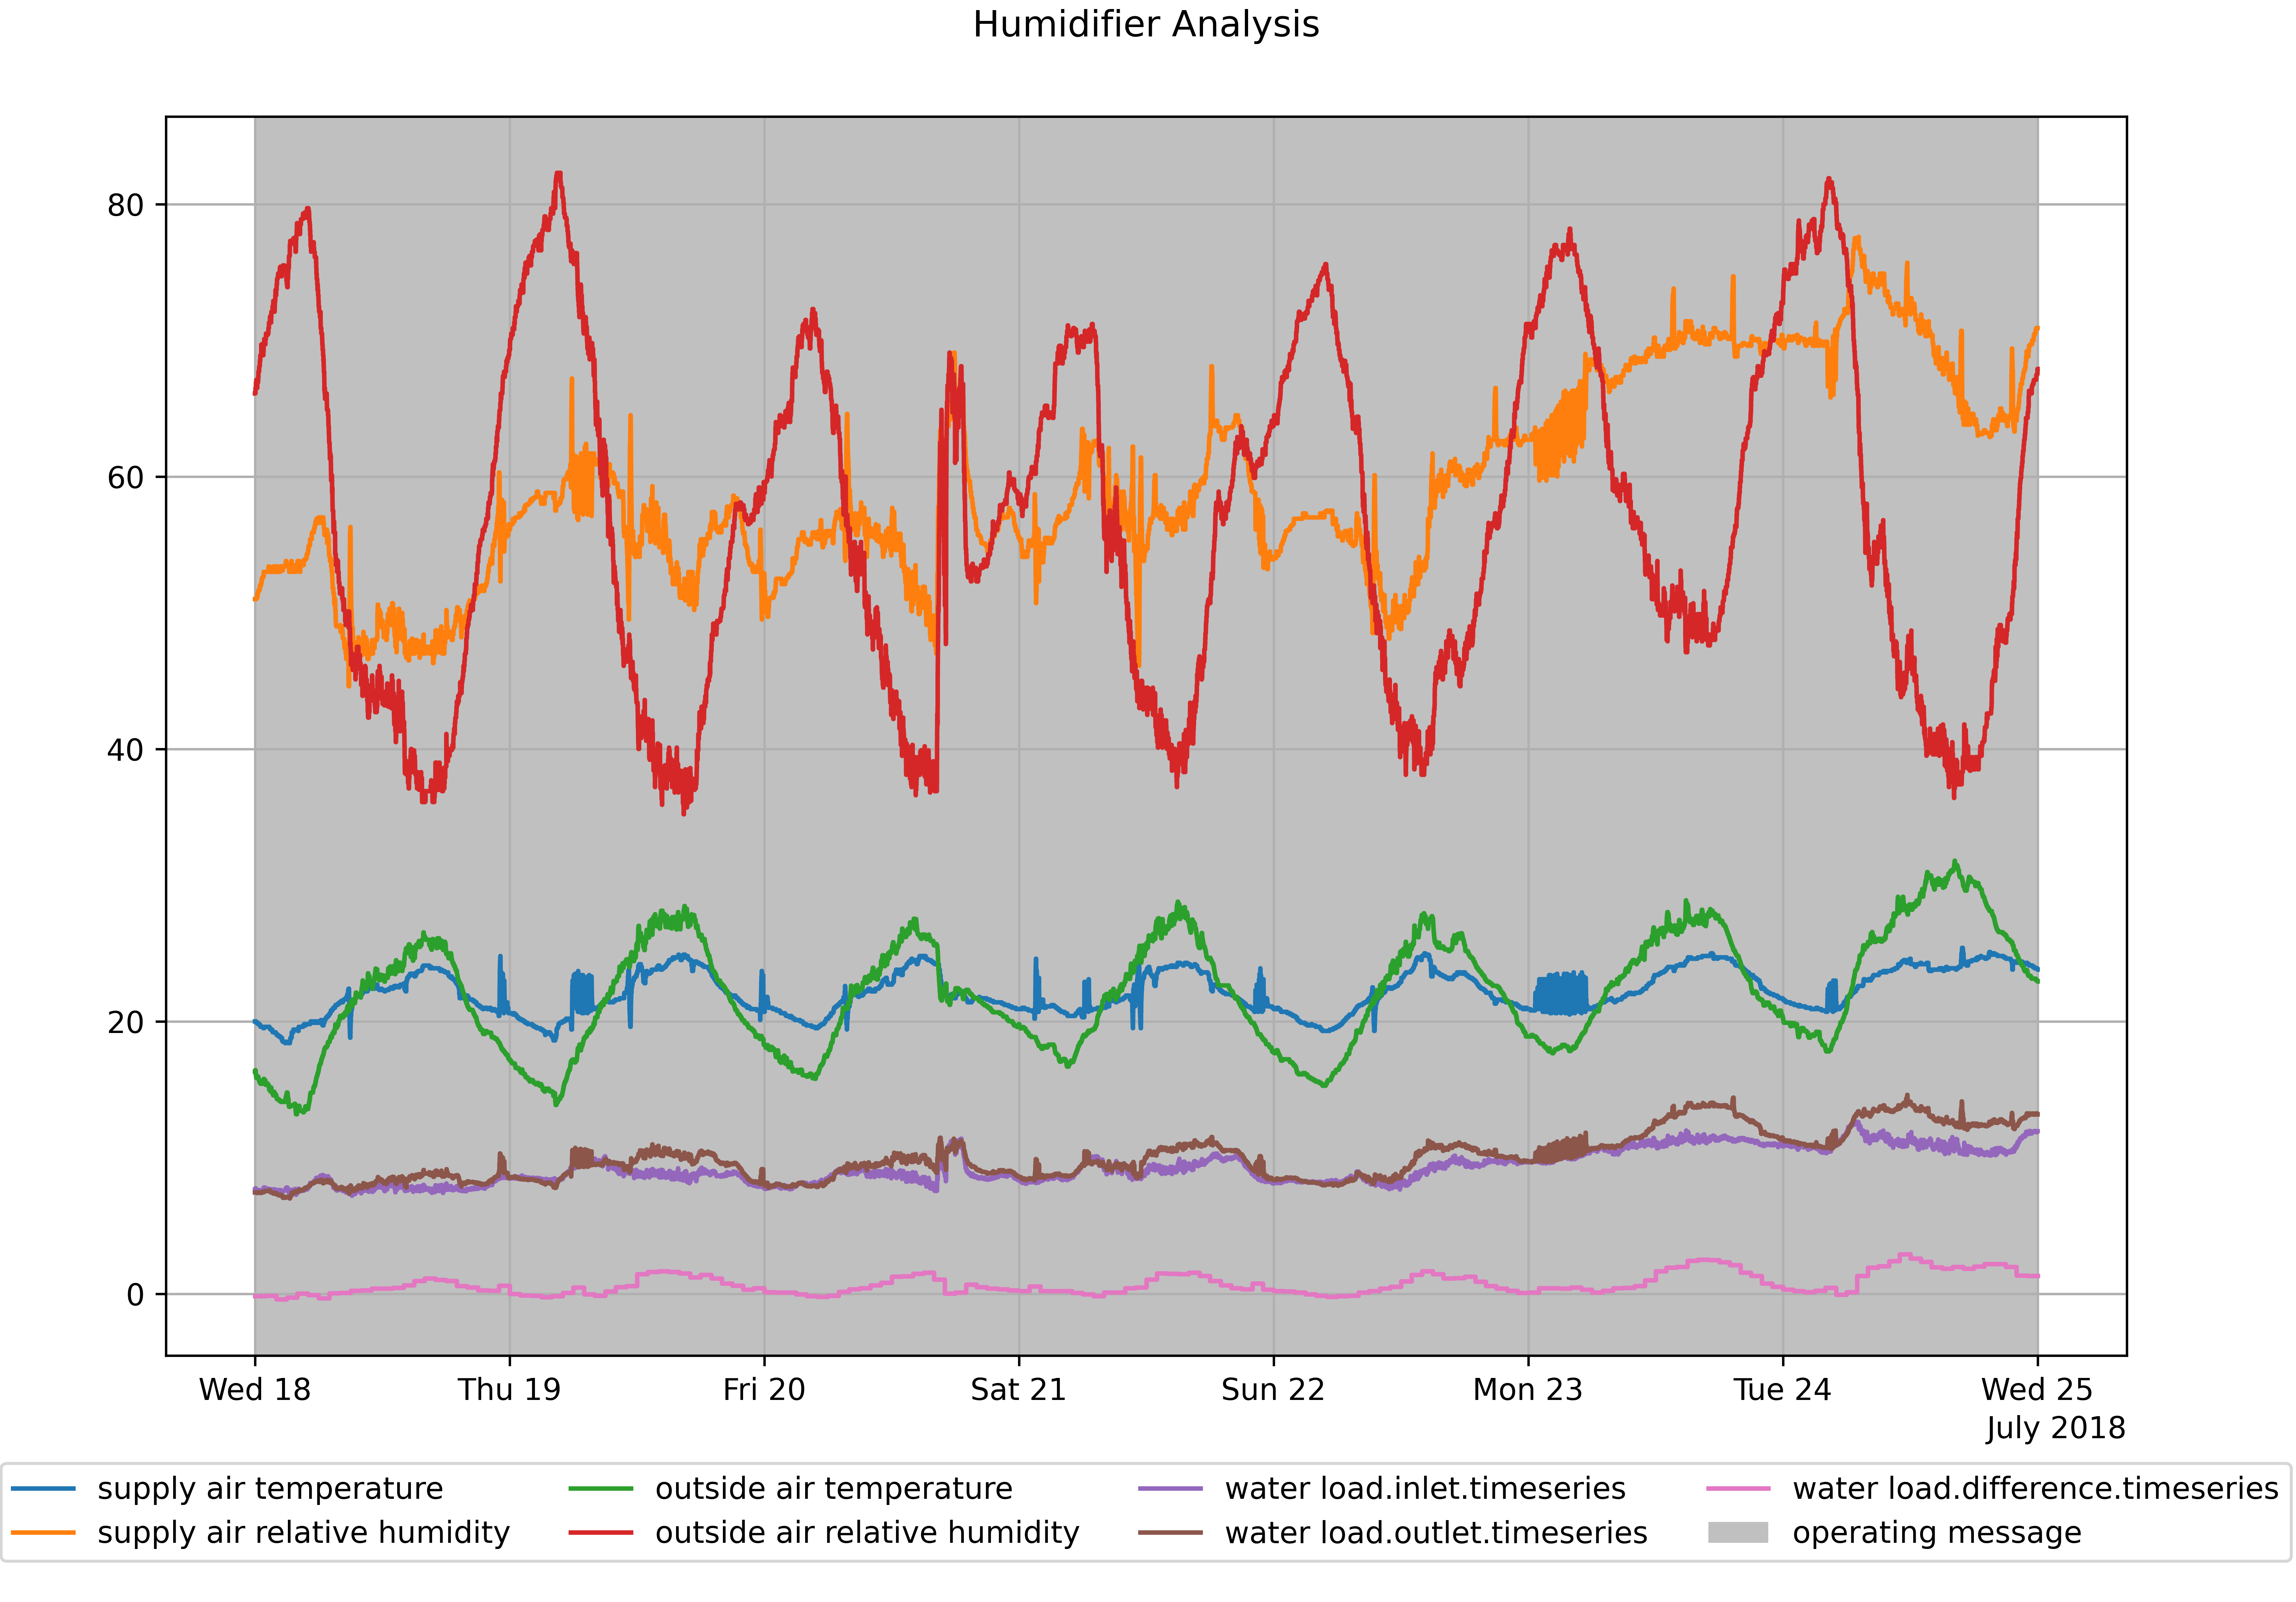
Figure 1: Analysis of humidity, temperature and water load conditions over a whole week
The analysis uses two positions, intake (outside conditions) and outlet (supply conditions) to calculate water loads. A difference in these water loads corresponds to the pink line at the bottom. The operating hours will now be divided into three categories. Hours of humidification, hours of dehumidification, and hours of neither humidification nor dehumidification. These values are then compared to the expected hours in these categories derived from outside conditions. The total hours of correct operation (according to the expectation) are then evaluated for a recommendation.
| KPI | Value | Unit |
|---|---|---|
| operating time | 168 | h |
| operating time.relative | 100 | % |
| humidification detected | 135 | h |
| dehumidification detected | 18 | h |
| humidification necessary | 0 | h |
| dehumidification necessary | 49 | h |
| humidification missing | 0 | h |
| dehumidification missing | 49 | h |
| humidification unnecessary | 135 | h |
| dehumidification unnecessary | 18 | h |
| total hours savings possible.relative | 91.1 | % |
| total hours increase air quality.relative | 92.3 | % |
Signal colors
| Signal color | Available | Info |
|---|---|---|
| red | No | - |
| yellow | Yes | - |
| green | Yes | The AHU operates in accordance to the expected operating conditions. |
Interpretations
| Available | Info |
|---|---|
| Yes | Either the expected operating conditions are met by the operation of the AHU or the operating conditions do not fit. |
Recommendations
| Available | Info |
|---|---|
| Yes | Recommendations regarding which operating mode (humidification, dehumidification) should be looked into to change the operating modes of the AHU. |
KPIs
| KPI Identifier | Info | Value Range | Unit |
|---|---|---|---|
| operating time | Total time of operation | 0 to inf | h |
| operating time.relative | Total time component was operated compared to analysis period | 0 to 100 | % |
Operating Conditions
| KPI Identifier | Info | Value Range | Unit |
|---|---|---|---|
| humidification detected | The amount of time the component operates in humidification mode according to inflow/outflow analysis | 0 to inf | h |
| dehumidification detected | The amount of time the component operates in dehumidification mode according to inflow/outflow analysis | 0 to inf | h |
| humidification necessary | The amount of time the component should operate in humidification mode according to outside air conditions | 0 to inf | h |
| dehumidification necessary | The amount of time the component should operate in dehumidification mode according to outside air conditions | 0 to inf | h |
| humidification missing | The amount of time the component did not operate in humidification mode but should | 0 to inf | h |
| dehumidification missing | The amount of time the component did not operate in dehumidification mode but should | 0 to inf | h |
| humidification unnecessary | The amount of time the component operated in humidification mode but should not | 0 to inf | h |
| dehumidification unnecessary | The amount of time the component operated in dehumidification mode but should not | 0 to inf | h |
| total hours savings possible.relative | Percentage of time (de)humidification can be switched off according to outside air conditions relative to operating time | 0 to 100 | % |
| total hours increase air quality.relative | Percentage of time (de)humidification should be switched on according to outside air conditions relative to operating time | 0 to 100 | % |
| Pin | Required | Mapping info |
|---|---|---|
| Supply air temperature | Yes | - |
| Supply air relative humidity | Yes | - |
| Outside air temperature | Yes | - |
| Outside air relative humidity | Yes | - |
| Operating message | No | Mapping of operating message is strongly recommended. Default: Always operating |
Recommended Time Span
1 week
Recommended Repetition
Every month
- After changes of operational modes
- After changes in the control system
Limit Violation
The Limit Violation analysis identifies and evaluates limit violations of component pins. There are three types of limit values: upper limit, lower limit and tolerance band. The tolerance band is the combination of an upper and a lower limit. Lower and upper limits can be specified by pins or attributes. For attributes, the limit value is a fixed value, but for pins, it can change during the analysis period. Only limit violations that occur during operating time are assessed.
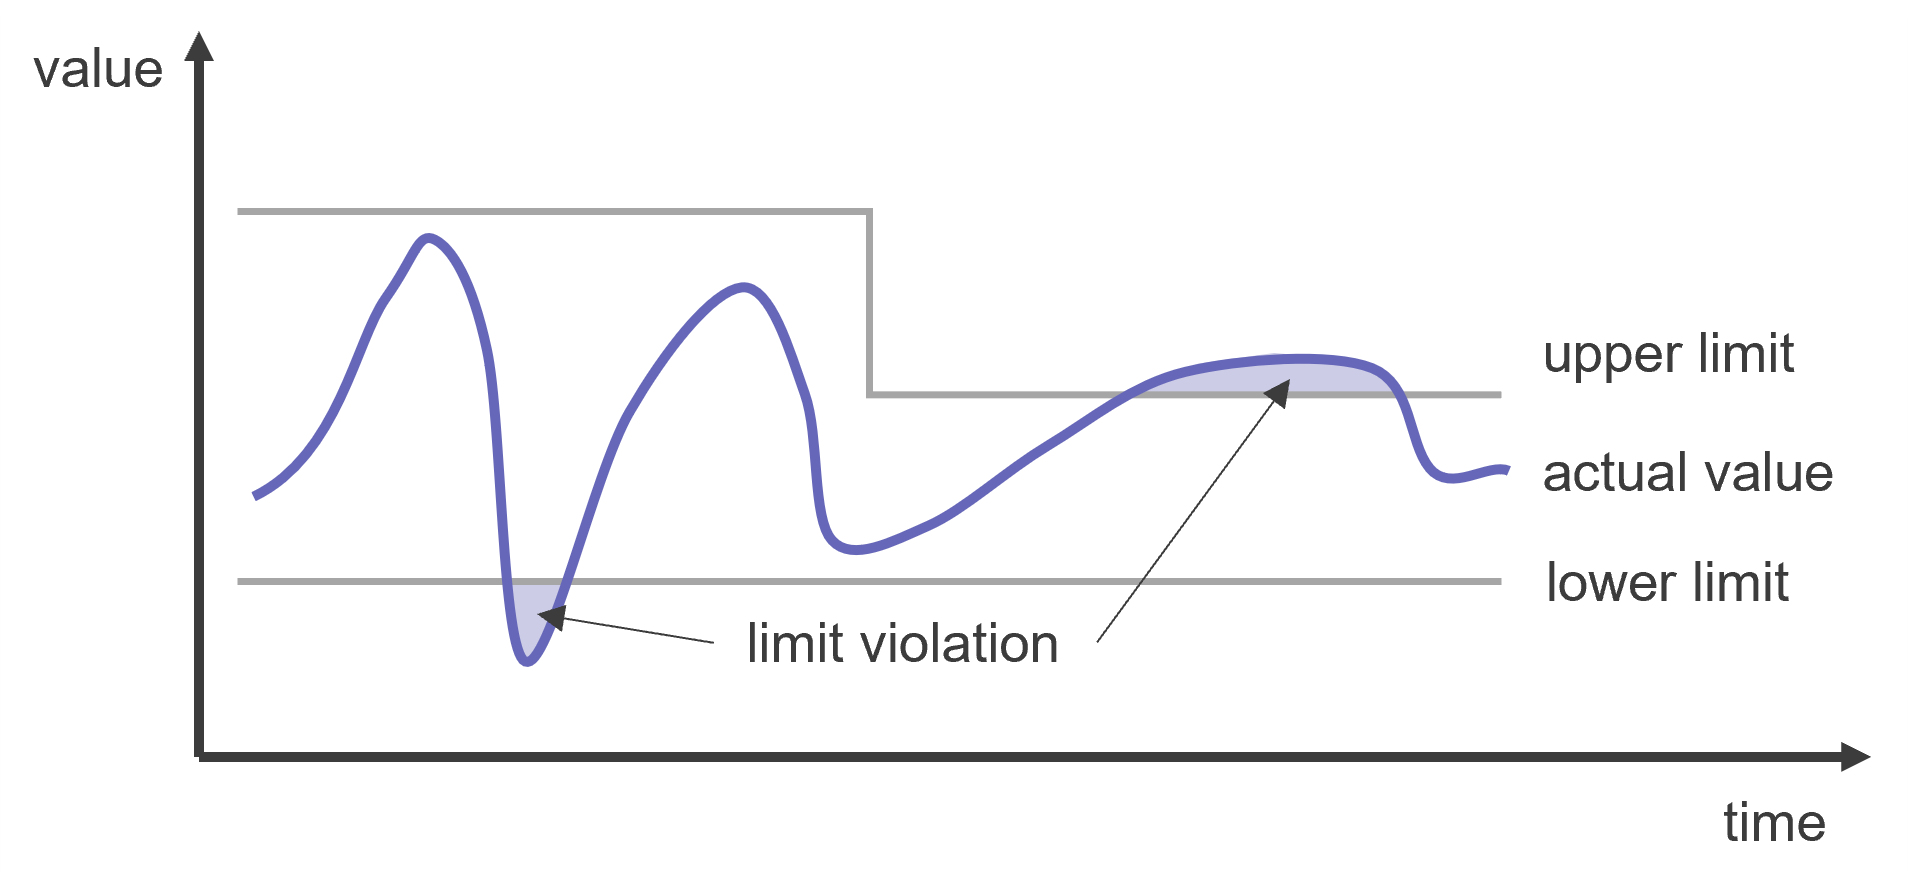
Value
Limit violation is a strong symptom for faulty control loop operation, e.g., caused by
- Technical defects in the control loop supply
- Control loop malfunctions
- Faulty control loop parameter settings
Benefits of improving insufficient setpoint value attainment are
- Higher occupant comfort, health, and performance
- Lower operating costs
- Higher energy efficiency
Recommended for components
The analysis is available for the following components:
- Air handling unit
- Cooling circuit
- Heating circuit
- Heat transfer unit
- Hybrid circuit
- Room
The analysis can be applied for the following pin types:
- CO2 concentration
- Temperatures
- Supply/Return temperature
- Room temperature
- Heating/cooling limit
Checked conditions
- Upper and lower limit violations of pins during operating time
In this example, the supply air temperature of an air handling unit (AHU) is analyzed. The lower limit is set to 18 °C, while the upper limit is initially set to 24 °C but changes to 21 °C during the analysis period. Since the upper limit changes over time, the source of the upper limit is a pin. The lower limit is fixed and therefore an attribute or a pin with a constant value. The lower limit is violated for nine hours and the upper limit for 35 hours.
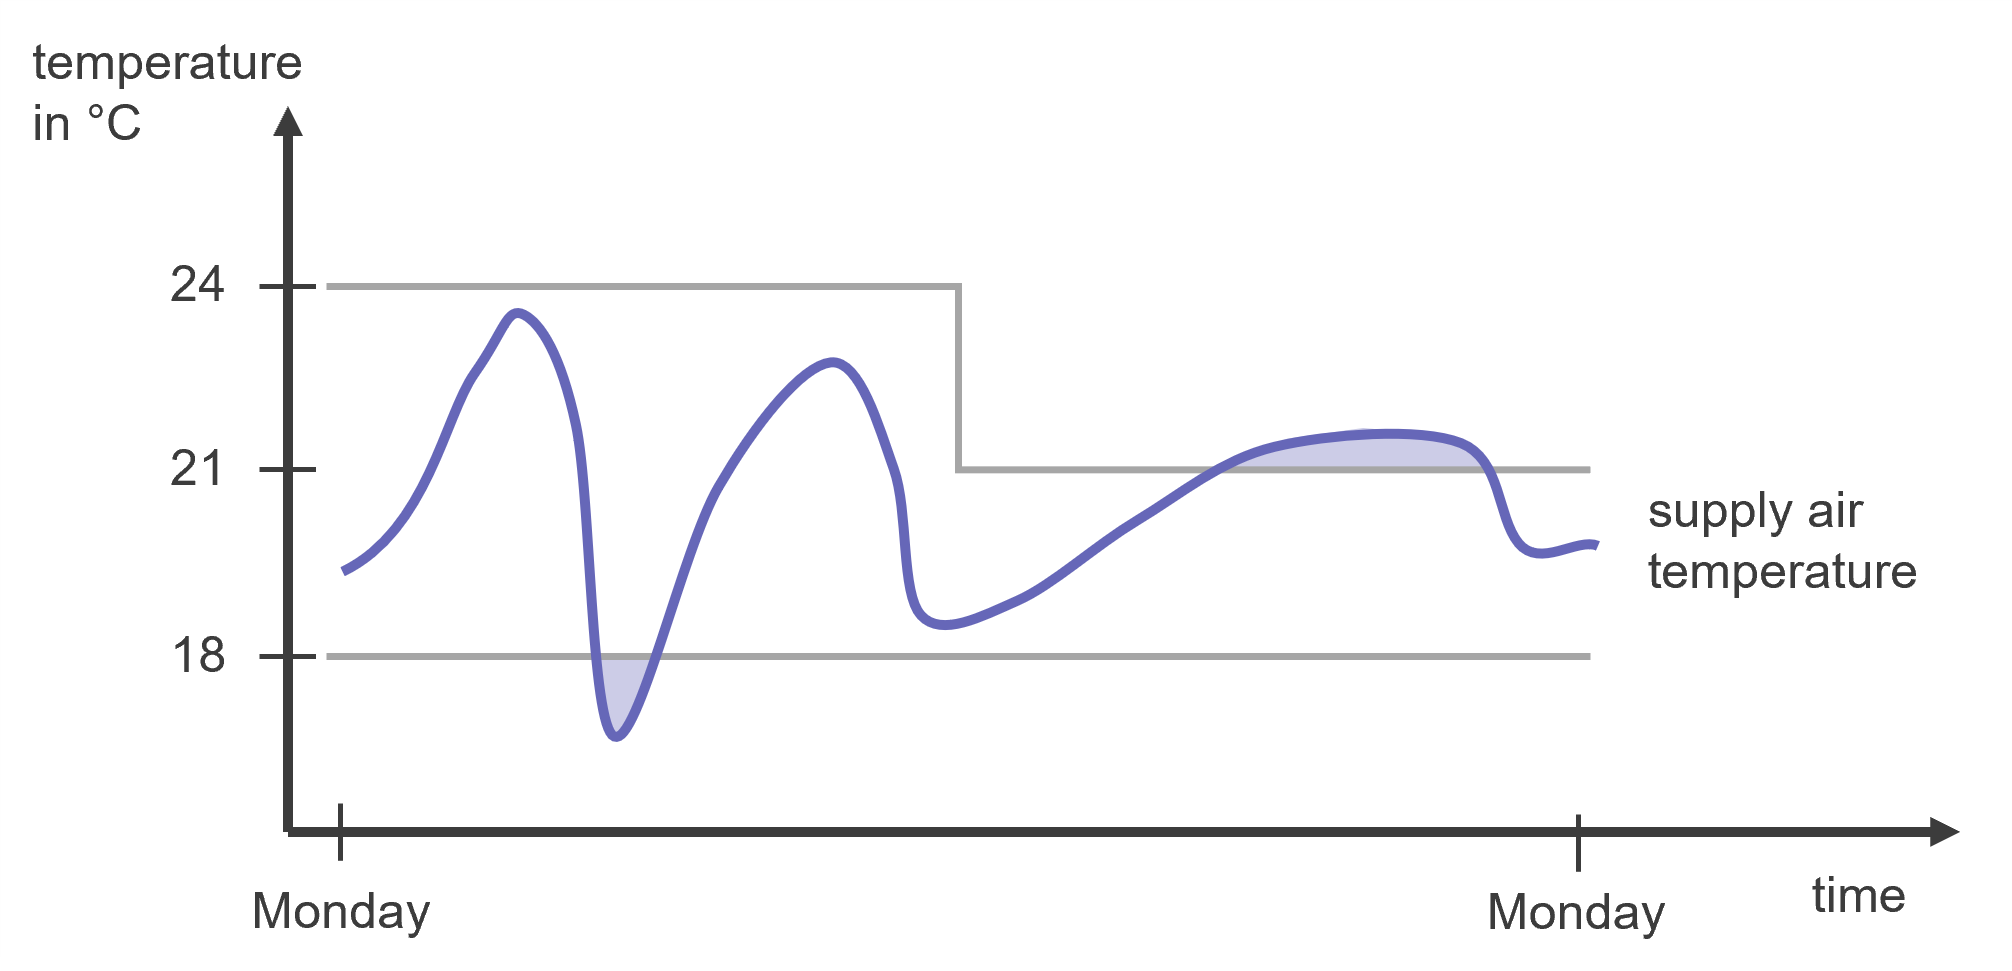
Since the KPI Supply air temperature.limit violation.duration.relative is between 20 % and 50 %, the signal color is yellow. The Interpretation is "Large limit violation detected".
The KPIs are shown in the following table:
| KPI | Value | Unit |
|---|---|---|
| operating time | 168 | h |
| operating time.relative | 100 | % |
| Supply air temperature.limit violation.duration | 44 | h |
| Supply air temperature.limit violation.duration.relative | 26.19 | % |
| Supply air temperature.upper limit violation.duration | 35 | h |
| Supply air temperature.upper limit violation.duration.relative | 20.83 | % |
| Supply air temperature.maximum | 23.8 | °C |
| Supply air temperature.lower limit violation.duration | 9 | h |
| Supply air temperature.lower limit violation.duration.relative | 5.36 | % |
| Supply air temperature.minimum | 17.1 | °C |
Signal colors
In order to determine the signal color the KPI <pin>.limit violation.duration.relative is evaluated.
| Signal color | Available | Info |
|---|---|---|
| red | Yes | The relative time of the limit violation is at least 50 %. |
| yellow | Yes | The relative time of the limit violation is between 20 % and 50 %. |
| green | Yes | The relative time of the limit violation is below 20 %. |
Interpretations
| Available | Info |
|---|---|
| Yes | The interpretation expresses whether a Large limit violation, Small limit violation or No limit violation was detected. |
Recommendations
| Available | Info |
|---|---|
| Yes | Information if a limit violation was detected for the considered pin. |
| Yes | Additional recommendation pointing at a possible cause of the limit violation depending on the pin type, e.g. CO2 limit violation or heating limit violation. |
KPIs
<pin> refers to the name of the pin that is analyzed regarding the limit violation.
The available pin types are:
- CO2 concentration
- Temperatures
- Supply/Return temperature
- Room temperature
- Heating/cooling limit
Operating Time
| KPI Identifier | Info | Value Range | Unit |
|---|---|---|---|
| operating time | Total operating time | 0 to inf | h |
| operating time.relative | Relative operating time | 0 to 100 | % |
Limit violation KPIs
| KPI Identifier | Info | Value Range | Unit |
|---|---|---|---|
| <pin>.limit violation.duration | Duration of the limit being exceeded or undercut | 0 to inf | h |
| <pin>.limit violation.duration.relative | Relative duration of the limit being exceeded or undercut | 0 to 100 | % |
| <pin>.upper limit violation.duration | Duration of the limit being exceeded | 0 to inf | h |
| <pin>.upper limit violation.duration.relative | Relative duration of the limit being exceeded | 0 to 100 | % |
| <pin>.checked value.maximum | Maximum value of the pin | -inf to inf | unit of pin |
| <pin>.lower limit violation.duration | Duration of the limit being undercut | 0 to inf | h |
| <pin>.lower limit violation.duration.relative | Relative duration of the limit being undercut | 0 to 100 | % |
| <pin>.checked value.minimum | Minimum value of the pin | -inf to inf | unit of pin |
The component model often offers both a pin and an attribute to define the lower and upper limit. If the pin is mapped, it is used. If the pin is not mapped, the attribute is used instead. This order is labeled “Priority” in the tables below.
Return air CO2 concentration
| Name | Type | Limit type | Priority | Mapping info |
|---|---|---|---|---|
| Return air CO2 | Pin | - | - | Required if return air CO2 concentration is to be analyzed. |
| Return air CO2 upper limit | Pin | upper | 1 | - |
| Return air CO2 upper limit | Attribute | upper | 2 | Default: 1500 ppm |
Supply air temperature
| Name | Type | Limit type | Priority | Mapping info |
|---|---|---|---|---|
| Supply air temperature | Pin | - | - | Required if supply air temperature is to be analyzed. |
| Supply air temperature setpoint lower limit | Pin | lower | 1 | - |
| Supply air temperature setpoint lower limit | Attribute | lower | 2 | Default: 17 °C |
| Supply air temperature setpoint upper limit | Pin | upper | 1 | - |
| Supply air temperature setpoint upper limit | Attribute | upper | 2 | Default: 25 °C |
Supply air temperature setpoint
| Name | Type | Limit type | Priority | Mapping info |
|---|---|---|---|---|
| Supply air temperature setpoint | Pin | - | - | Required if supply air temperature setpoint is to be analyzed. |
| Supply air temperature setpoint lower limit | Pin | lower | 1 | - |
| Supply air temperature setpoint lower limit | Attribute | lower | 2 | Default: 17 °C |
| Supply air temperature setpoint upper limit | Pin | upper | 1 | - |
| Supply air temperature setpoint upper limit | Attribute | upper | 2 | Default: 25 °C |
Return temperature
| Name | Type | Limit type | Priority | Mapping info |
|---|---|---|---|---|
| Return temperature | Pin | - | - | Required if return temperature is to be analyzed. |
| Return temperature upper limit | Pin | upper | 1 | Required if return temperature is to be analyzed. |
Outside air temperature
| Name | Type | Limit type | Priority | Mapping info |
|---|---|---|---|---|
| Outside air temperature | Pin | - | - | Required if outside air temperature is to be analyzed. |
| Cooling limit | Pin | lower | 1 | Required if outside air temperature is to be analyzed. |
Return temperature
| Name | Type | Limit type | Priority | Mapping info |
|---|---|---|---|---|
| Primary side - return temperature | Pin | - | - | Required if return temperature is to be analyzed. |
| Return temperature upper limit - primary heating | Pin | upper | 1 | - |
| Primary heating - return temperature upper limit | Attribute | upper | 2 | Default: 65 °C |
Outside air temperature
| Name | Type | Limit type | Priority | Mapping info |
|---|---|---|---|---|
| Outside air temperature | Pin | - | - | Required if outside air temperature is to be analyzed. |
| Heating limit | Pin | upper | 1 | Required if outside air temperature is to be analyzed. |
Circulation side - Return temperature
| Name | Type | Limit type | Priority | Mapping info |
|---|---|---|---|---|
| Circulation side - Return temperature | Pin | - | - | Required if Circulation side - Return temperature is to be analyzed. |
| Circulation side - Return temperature lower limit | Pin | lower | 1 | - |
| Circulation side - Return temperature lower limit | Attribute | lower | 2 | Default: 55 °C |
Cooling limit - Outside air temperature
| Name | Type | Limit type | Priority | Mapping info |
|---|---|---|---|---|
| Outside air temperature | Pin | - | - | Required if Cooling limit - Outside air temperature is to be analyzed. |
| Cooling limit | Pin | lower | 1 | Required if Cooling limit - Outside air temperature is to be analyzed. |
Heating limit - Outside air temperature
| Name | Type | Limit type | Priority | Mapping info |
|---|---|---|---|---|
| Outside air temperature | Pin | - | - | Required if Heating limit - Outside air temperature is to be analyzed. |
| Heating limit | Pin | upper | 1 | Required if Heating limit - Outside air temperature is to be analyzed. |
Cooling circuit - Supply temperature setpoint
| Name | Type | Limit type | Priority | Mapping info |
|---|---|---|---|---|
| Cooling circuit - Supply temperature setpoint | Pin | - | - | Required if Cooling circuit - Supply temperature setpoint is to be analyzed. |
| Cooling circuit - Supply temperature setpoint minimum | Pin | lower | 1 | - |
| Cooling circuit - Supply temperature setpoint minimum | Attribute | lower | 2 | Default: 8 °C |
| Cooling circuit - Supply temperature setpoint maximum | Pin | upper | 1 | - |
| Cooling circuit - Supply temperature setpoint maximum | Attribute | upper | 2 | Default: 20 °C |
Heating circuit - Supply temperature setpoint
| Name | Type | Limit type | Priority | Mapping info |
|---|---|---|---|---|
| Heating circuit - Supply temperature setpoint | Pin | - | - | Required if Heating circuit - Supply temperature setpoint is to be analyzed. |
| Heating circuit - Supply temperature setpoint minimum | Pin | lower | 1 | - |
| Heating circuit - Supply temperature setpoint minimum | Attribute | lower | 2 | Default: 45 °C |
| Heating circuit - Supply temperature setpoint maximum | Pin | upper | 1 | - |
| Heating circuit - Supply temperature setpoint maximum | Attribute | upper | 2 | Default: 80 °C |
CO2 concentration
| Name | Type | Limit type | Priority | Mapping info |
|---|---|---|---|---|
| CO2 | Pin | - | - | Required if CO2 concentration is to be analyzed. |
| CO2 upper limit | Pin | upper | 1 | - |
| CO2 upper limit | Attribute | upper | 2 | Default: 1500 ppm |
Room air temperature
| Name | Type | Limit type | Priority | Mapping info |
|---|---|---|---|---|
| Room air temperature | Pin | - | - | Required if Room air temperature is to be analyzed. |
| Room air temperature limit cooling | Pin | upper | 1 | - |
| Upper limit for room air temperature | Attribute | upper | 2 | - |
| Room air temperature limit heating | Pin | lower | 1 | - |
| Lower limit for room air temperature | Attribute | lower | 2 | - |
Recommended Time Span
1 day to 1 week
Recommended Repetition
Every week
Operating Cycle
The Operating Cycle analysis identifies excessive start and stop processes which lead to energy losses, energy consumption peaks due to higher energy consumption on plant start, and higher wear-and-tear of the component compared to a constant operation. Further, a frequently alternating operation of a component, e.g., a heat pump, has negative effects on adjacent components, which are enforced to alternate as well. Further, the algorithm takes low cycle rates as an indication of a possible under-supply of the adjacent systems.
Value
- Lower operating costs
- Higher energy efficiency
- Peak energy consumption reduction
- Longer equipment and component lifetimes
- Smoother system integration
Recommended for components
Energy conversion plants and components with high start-up energy consumption or wear, such as
- Heat pump
- Combined heat and power
- Boiler
- Fan
Checked conditions
- Short cycling of component operation, evaluated component-specific
- Long cycling of component operation, evaluated component-specific
- Expected cycling of component operation, evaluated component-specific
- Condition checks on times of components operation
The Operating Cycle analysis was applied to a heat pump. Thus, a heat pump component model was instanced and the respective datapoint mapped to the pin operating message. Figure 1 shows the time series recorded for an exemplary period of 1 week in winter.
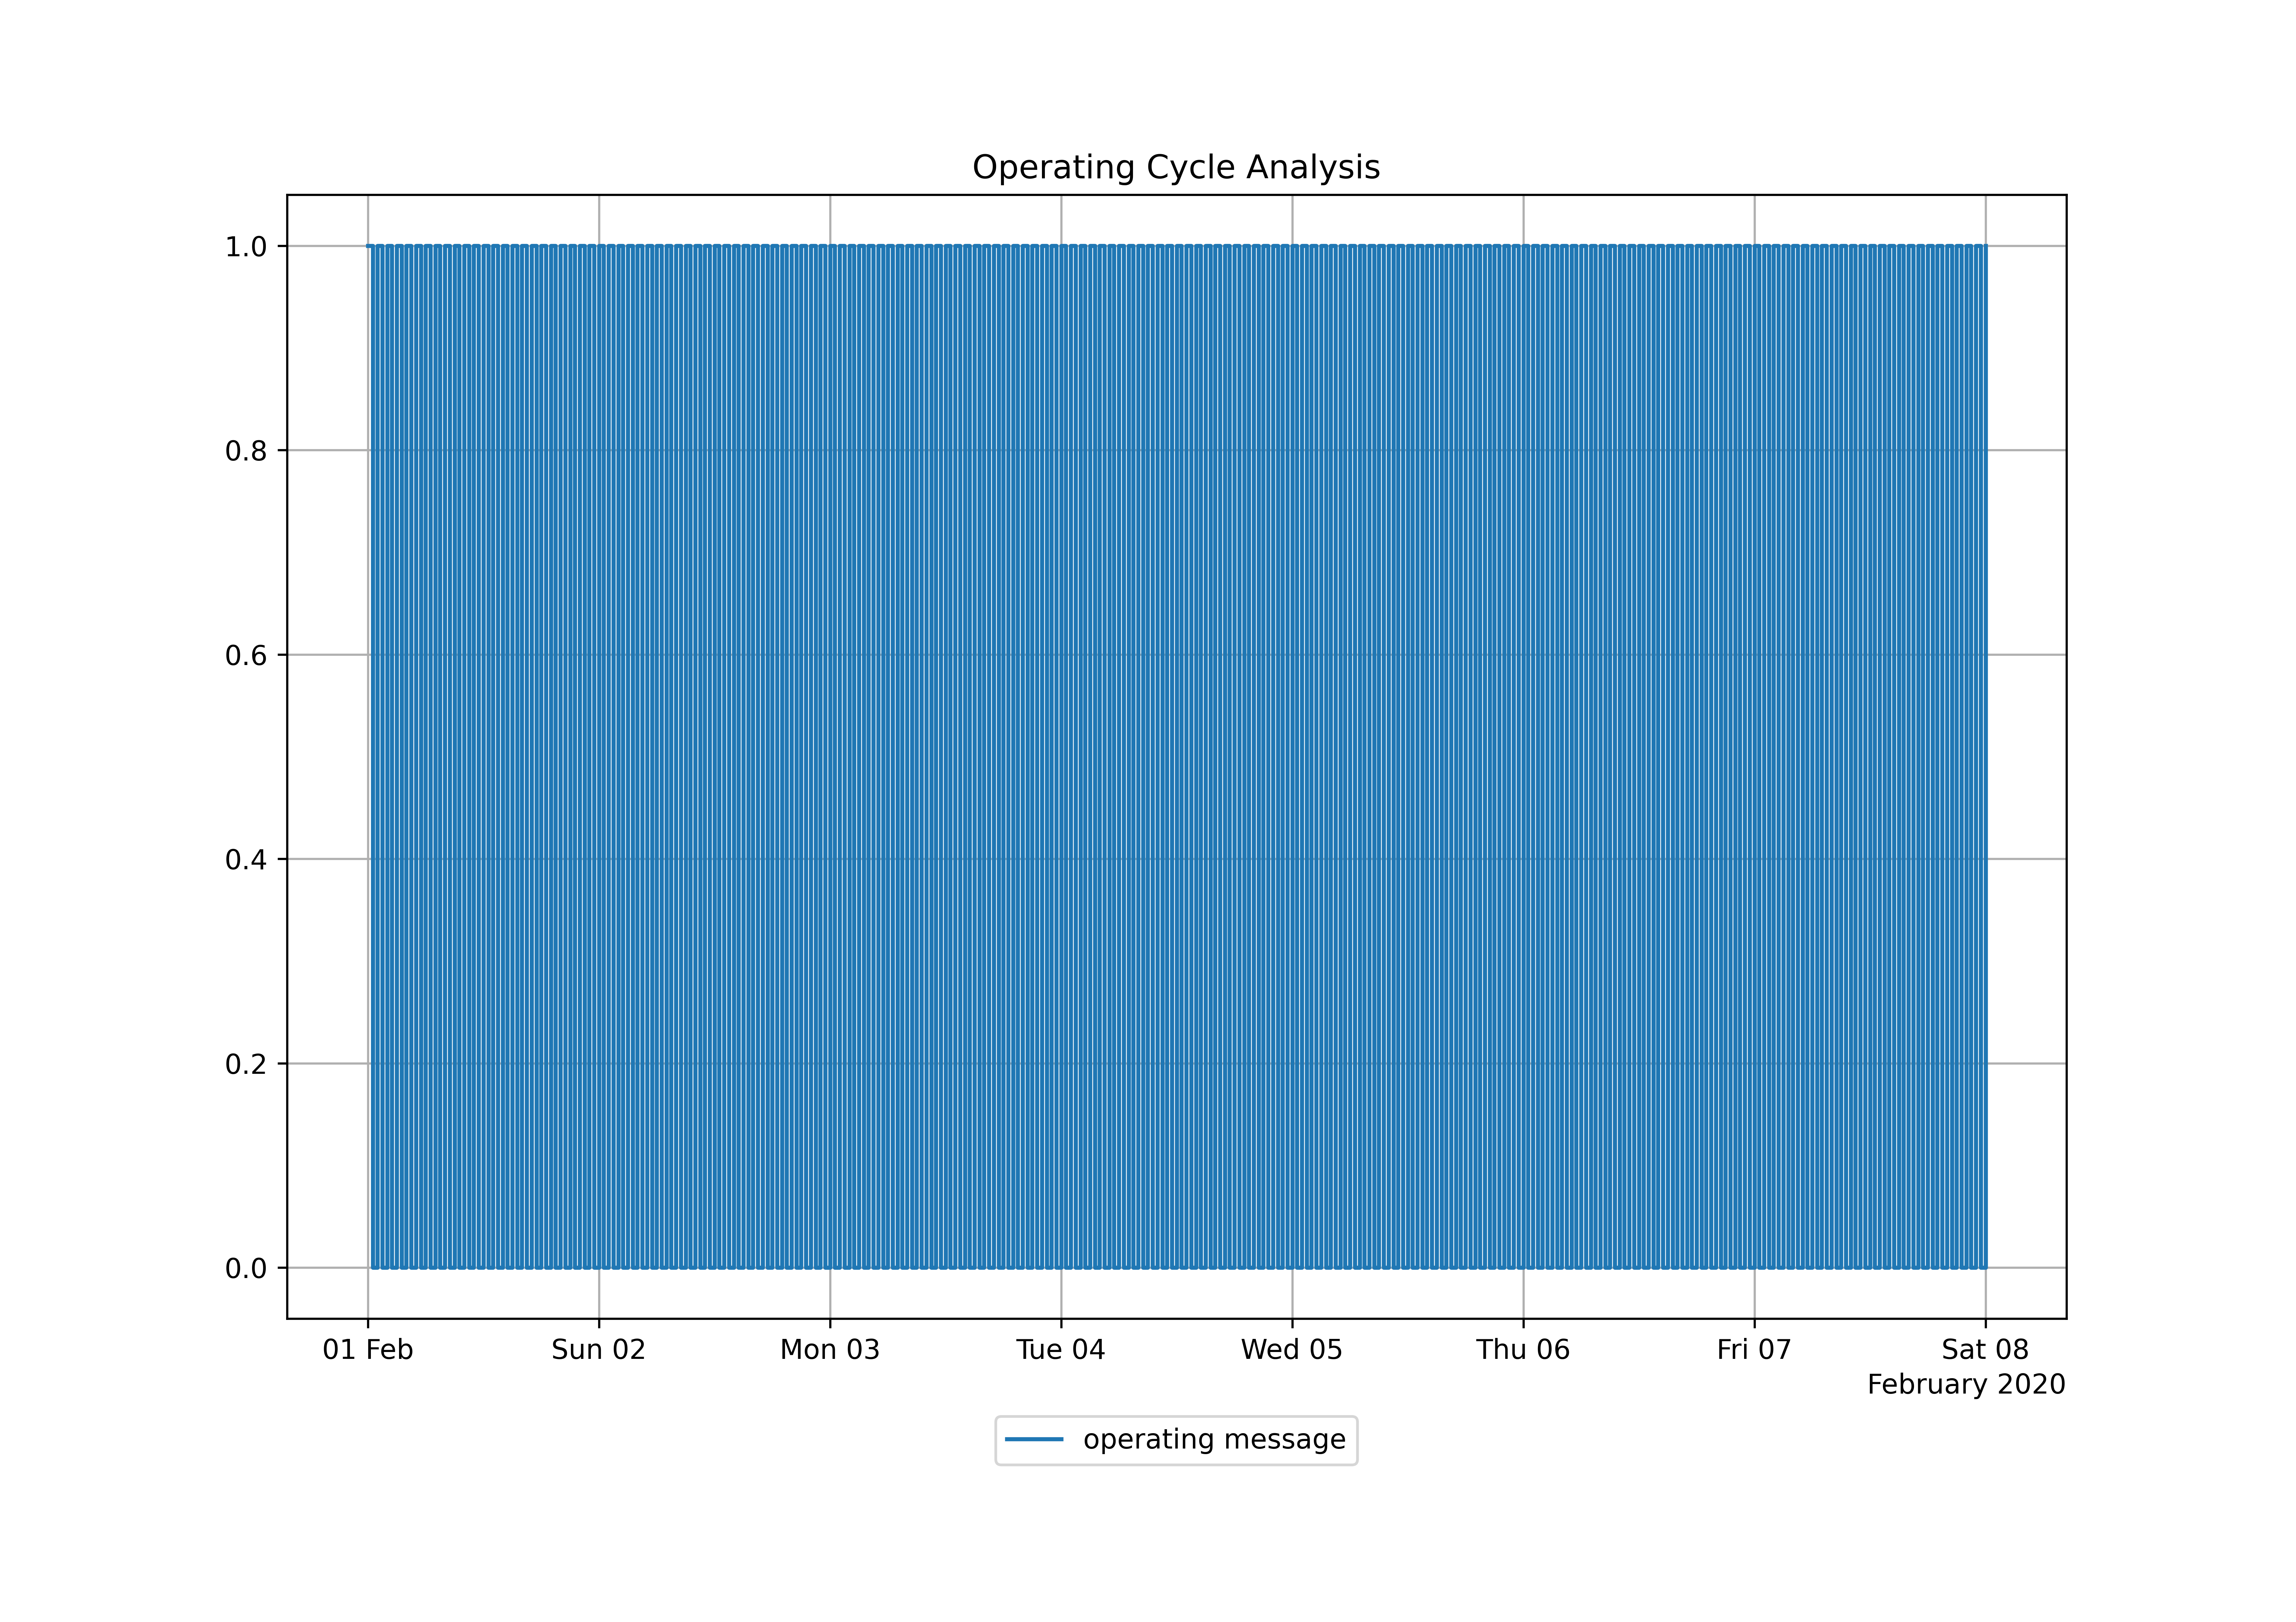
Figure 1: Operating message and cycle behavior of heat pump
Short shut-down times are observed between periods of duty indicating excessive start and stop processes of the heat pump. This not only leads to energy losses and electricity consumption peaks, but also increased wear-and-tear of the heat pump's compressor.
The attributes "Coefficient of performance", "Nominal heat production" and "Electricity price" are set to 4, 1000kW, and 0.18€/kWh. This enables Economic KPIs with the accuracy level "High". The calculations show daily start-up costs of 66 €/d and costs of one start to be 2.75 € (start-up cost).
The automated interpretation confirms our visual analysis of the time series shown in the figure, summed up by the qualitative warning level "yellow". The recommendations provide further instruction on how to isolate and fix the cause for the increased number of start and stop processes. Furthermore, the result offers an advanced set of KPIs, providing additional insights into the cycle behavior of the heat pump.
| KPI | Value | Unit |
|---|---|---|
| operating time | 84 | h |
| operating time.relative | 50 | h |
| starts | 168 | count |
| closed operating cycles | 167 | count |
| cycle times.median | 1 | h |
| cycle times.mean | 1 | h |
| cycle times.maximum | 1 | h |
| cycle times.minimum | 1 | h |
| duty times.median | 0.5 | h |
| duty times.mean | 0.5 | h |
| duty times.maximum | 0.5 | h |
| duty times.minimum | 0.5 | h |
| switch-off times.median | 0.5 | h |
| switch-off times.mean | 0.5 | h |
| switch-off times.maximum | 0.5 | h |
| switch-off times.minimum | 0.5 | h |
| start-up costs.daily | 66 | €/d |
| start-up costs.weekly | 462 | €/week |
| start-up costs | 2.75 | € |
Signal colors
| Signal color | Available | Info |
|---|---|---|
| red | No | - |
| yellow | Yes | Unwanted cycling rates are a strong symptom for suboptimal control and system performance. Investing the extra effort to identify the root cause and fixing it is strongly recommended. |
| green | Yes | Sufficient cycle rates are detected in respect to usual operation in buildings. |
Interpretations
| Available | Info |
|---|---|
| Yes | Interpretations summarize the result of the analysis. |
Recommendations
| Available | Info |
|---|---|
| Yes | Recommendations on how to investigate the root cause of an unwanted cycle rate. No recommendation, if cycle rate is sufficient. |
KPIs
Operating Time and Operating Cycles
| KPI Identifier | Info | Value Range | Unit |
|---|---|---|---|
| operating time | Total time of operation | 0 to inf | h |
| operating time.relative | Total time of operation divided by total time span | 0 to 100 | % |
| starts | Count of starts | 0 to inf | count |
| closed operating cycles | Count of closed operating cycles: cycles are counted form start(\(n_i\)) to start(\(n_{i+1}\)) and both starts are within the analyzed period. | 0 to inf | count |
| cycle times.median | Median of cycle periods: not returned in case no closed cycle was observed. | 0 to inf | h |
| cycle times.mean | Time-weighted average of cycle periods: not returned in case no closed cycle was observed. | 0 to inf | h |
| cycle times.maximum | Longest cycle period: not returned in case no closed cycle was observed. | 0 to inf | h |
| cycle times.minimum | Shortest cycle period: not returned in case no closed cycle was observed. | 0 to inf | h |
| duty times.median | Median of duty periods: not returned in case no closed cycle was observed. | 0 to inf | h |
| duty times.mean | Time-weighted average of duty periods: not returned in case no closed cycle was observed. | 0 to inf | h |
| duty times.maximum | Longest duty period: not returned in case no closed cycle was observed. | 0 to inf | h |
| duty times.minimum | Shortest duty period: not returned in case no closed cycle was observed. | 0 to inf | h |
| switch-off times.median | Median of switch-off periods: not returned in case no closed cycle was observed. | 0 to inf | h |
| switch-off times.mean | Time-weighted average of switch-off periods: not returned in case no closed cycle was observed. | 0 to inf | h |
| switch-off times.maximum | Longest switch-off period: not returned in case no closed cycle was observed. | 0 to inf | h |
| switch-off times.minimum | Shortest switch-off period: not returned in case no closed cycle was observed. | 0 to inf | h |
Economic KPIs
Economic KPIs estimate the economic optimization potentials of the observed operational state. The KPIs indicate the total startup costs based on KPI "starts" and the costs of one cycle of the investigated component.
| KPI Identifier | Info | Value Range | Unit |
|---|---|---|---|
| start-up costs.daily | Identified daily costs of start-ups | 0 to inf | €/day |
| start-up costs.weekly | Identified weekly costs of start-ups | 0 to inf | €/week |
| start-up costs | Estimation of the cost of one start-up including the shutdown of the device | 0 to inf | € |
The Economic KPIs are provided for the components:
- Boiler
- Combined heat and power
- Heat Pump
Their availability and accuracy depend on the component's mapping. The analysis function always determines the highest possible accuracy.
Accuracy Levels:
The following tables summarize the pins and attributes required to achieve various accuracy levels for the economic KPIs.
High
| Components | Pins | Attributes |
|---|---|---|
| Combined heat and power | - | Start-up costs Generator nominal power |
| Boiler | - | Start-up costs Nominal heat production |
| Heat pump | - | Coefficient of performance Electricity price Nominal heat production |
Medium
| Components | Pins | Attributes |
|---|---|---|
| Boiler | - | Nominal heat production |
| Heat pump | - | Nominal heat production |
| Combined heat and power | - | Generator nominal power |
If the available attributes and mapped pins are not sufficient enough to reach a "Medium" accuracy for the economic KPIs, no economic KPIs are calculated.
| Pin | Required | Mapping info |
|---|---|---|
| Return air fan - operating message | No | Both or just one fan can be connected for this analysis function to work. |
| Supply air fan - operating message | No | Both or just one fan can be connected for this analysis function to work. |
| Pin | Required | Mapping info |
|---|---|---|
| Operating message | Yes | - |
| Attribute | Required | Mapping info | Unit |
|---|---|---|---|
| Nominal heat production | No | Necessary for Economic KPIs, all accuracy levels. Used to scale "Start-up costs". Default: None. | kW |
| Startup costs | No | Necessary for Economic KPIs, accuracy level "High". Scaled with "Nominal heat production". Default: 0.01 €/kW. | €/kW |
| Pin | Required | Mapping info |
|---|---|---|
| Operating message | Yes | - |
| Attribute | Required | Mapping info | Unit |
|---|---|---|---|
| Coefficient of performance | No | Necessary for Economic KPIs, accuracy level "High" Default: 4 | |
| Nominal cooling production | No | Necessary for Economic KPIs, all accuracy levels. Used to scale "Start-up costs". Default: None | kW |
| Startup costs | No | Necessary for Economic KPIs, accuracy level "High". Scaled with "Generator nominal power". Default: 0.18 €/kW | €/kW |
| Pin | Required | Mapping info |
|---|---|---|
| Operating message | Yes | - |
| Attribute | Required | Mapping info | Unit |
|---|---|---|---|
| Generator nominal power | No | Necessary for Economic KPIs, all accuracy levels. Used to scale "Start-up costs". Default: None | kW |
| Startup costs | No | Necessary for economic KPIs, accuracy level "High". Scaled with "Generator nominal power". Default: 0.02 €/kW | €/kW |
| Pin | Required | Mapping info |
|---|---|---|
| Operating message | Yes | - |
| Pin | Required | Mapping info |
|---|---|---|
| Operating message | Yes | - |
| Attribute | Required | Mapping info | Unit |
|---|---|---|---|
| Coefficient of performance | No | Necessary for Economic KPIs, accuracy level "High". Default: 4 | |
| Nominal heat production | No | Necessary for Economic KPIs, all accuracy levels. Used to scale "Start-up costs". Default: None | kW |
| Startup costs | No | Necessary for Economic KPIs, accuracy level "High". Scaled with "Generator nominal power". Default: 0.18 €/kW | €/kW |
| Pin | Required | Mapping info |
|---|---|---|
| Operating message | No | Mapping of either operating message (preferred) or pump - operating message is mandatory. If both pins are mapped, operating message is used. |
| Pump - operating message | No | Mapping of either operating message (preferred) or pump - operating message is mandatory. If both pins are mapped, operating message is used. |
Recommend Time Span
1 day to 1 week
Recommended Repetition
Every month
- Cycle rates have a strong seasonal effect
- Frequent repetition allows to identify operational bad points
- After changes of operational modes, e.g., transfers to heating mode
- After changes in the control system
- After maintenance or replacements
Reduced Load
The Reduced Load analysis identifies the presence of a reduced load mode based on temperature setpoints of the system under consideration. A reduced load mode offers the possibility of operational cost and energy reductions. Recommendations are made to implement a reduced load mode if it is not detected or only results in small changes to the temperature setpoint. Moreover, the analysis checks if there is a correlation between the temperature and the outdoor temperature which indicates the precence of a heating curve. If no heating curve is detected, the recommendation is to implement one. Additionally, a comparison with a user-defined schedule reveals times when the component could be in a reduced load operating mode.
Value
- Lower operating costs
- Lower energy consumption
Recommended for components
Heat and cold distribution systems, energy conversion plants, and indoor areas, such as
- Heating circuits
- Thermal control loops
- Boilers
- Combined heat and power units
- Rooms
Checked conditions
- Existence of a load reduction period, e.g., night-time temperature reduction for heating
- Condition checks on times of components operation
- Estimation of times when the load can be reduced according to a user-defined schedules
- Negative correlation between temperature setpoint and outside temperature, indicating the presence of a heating curve
This example shows the results of a Reduced Load analysis performed on a heating circuit.
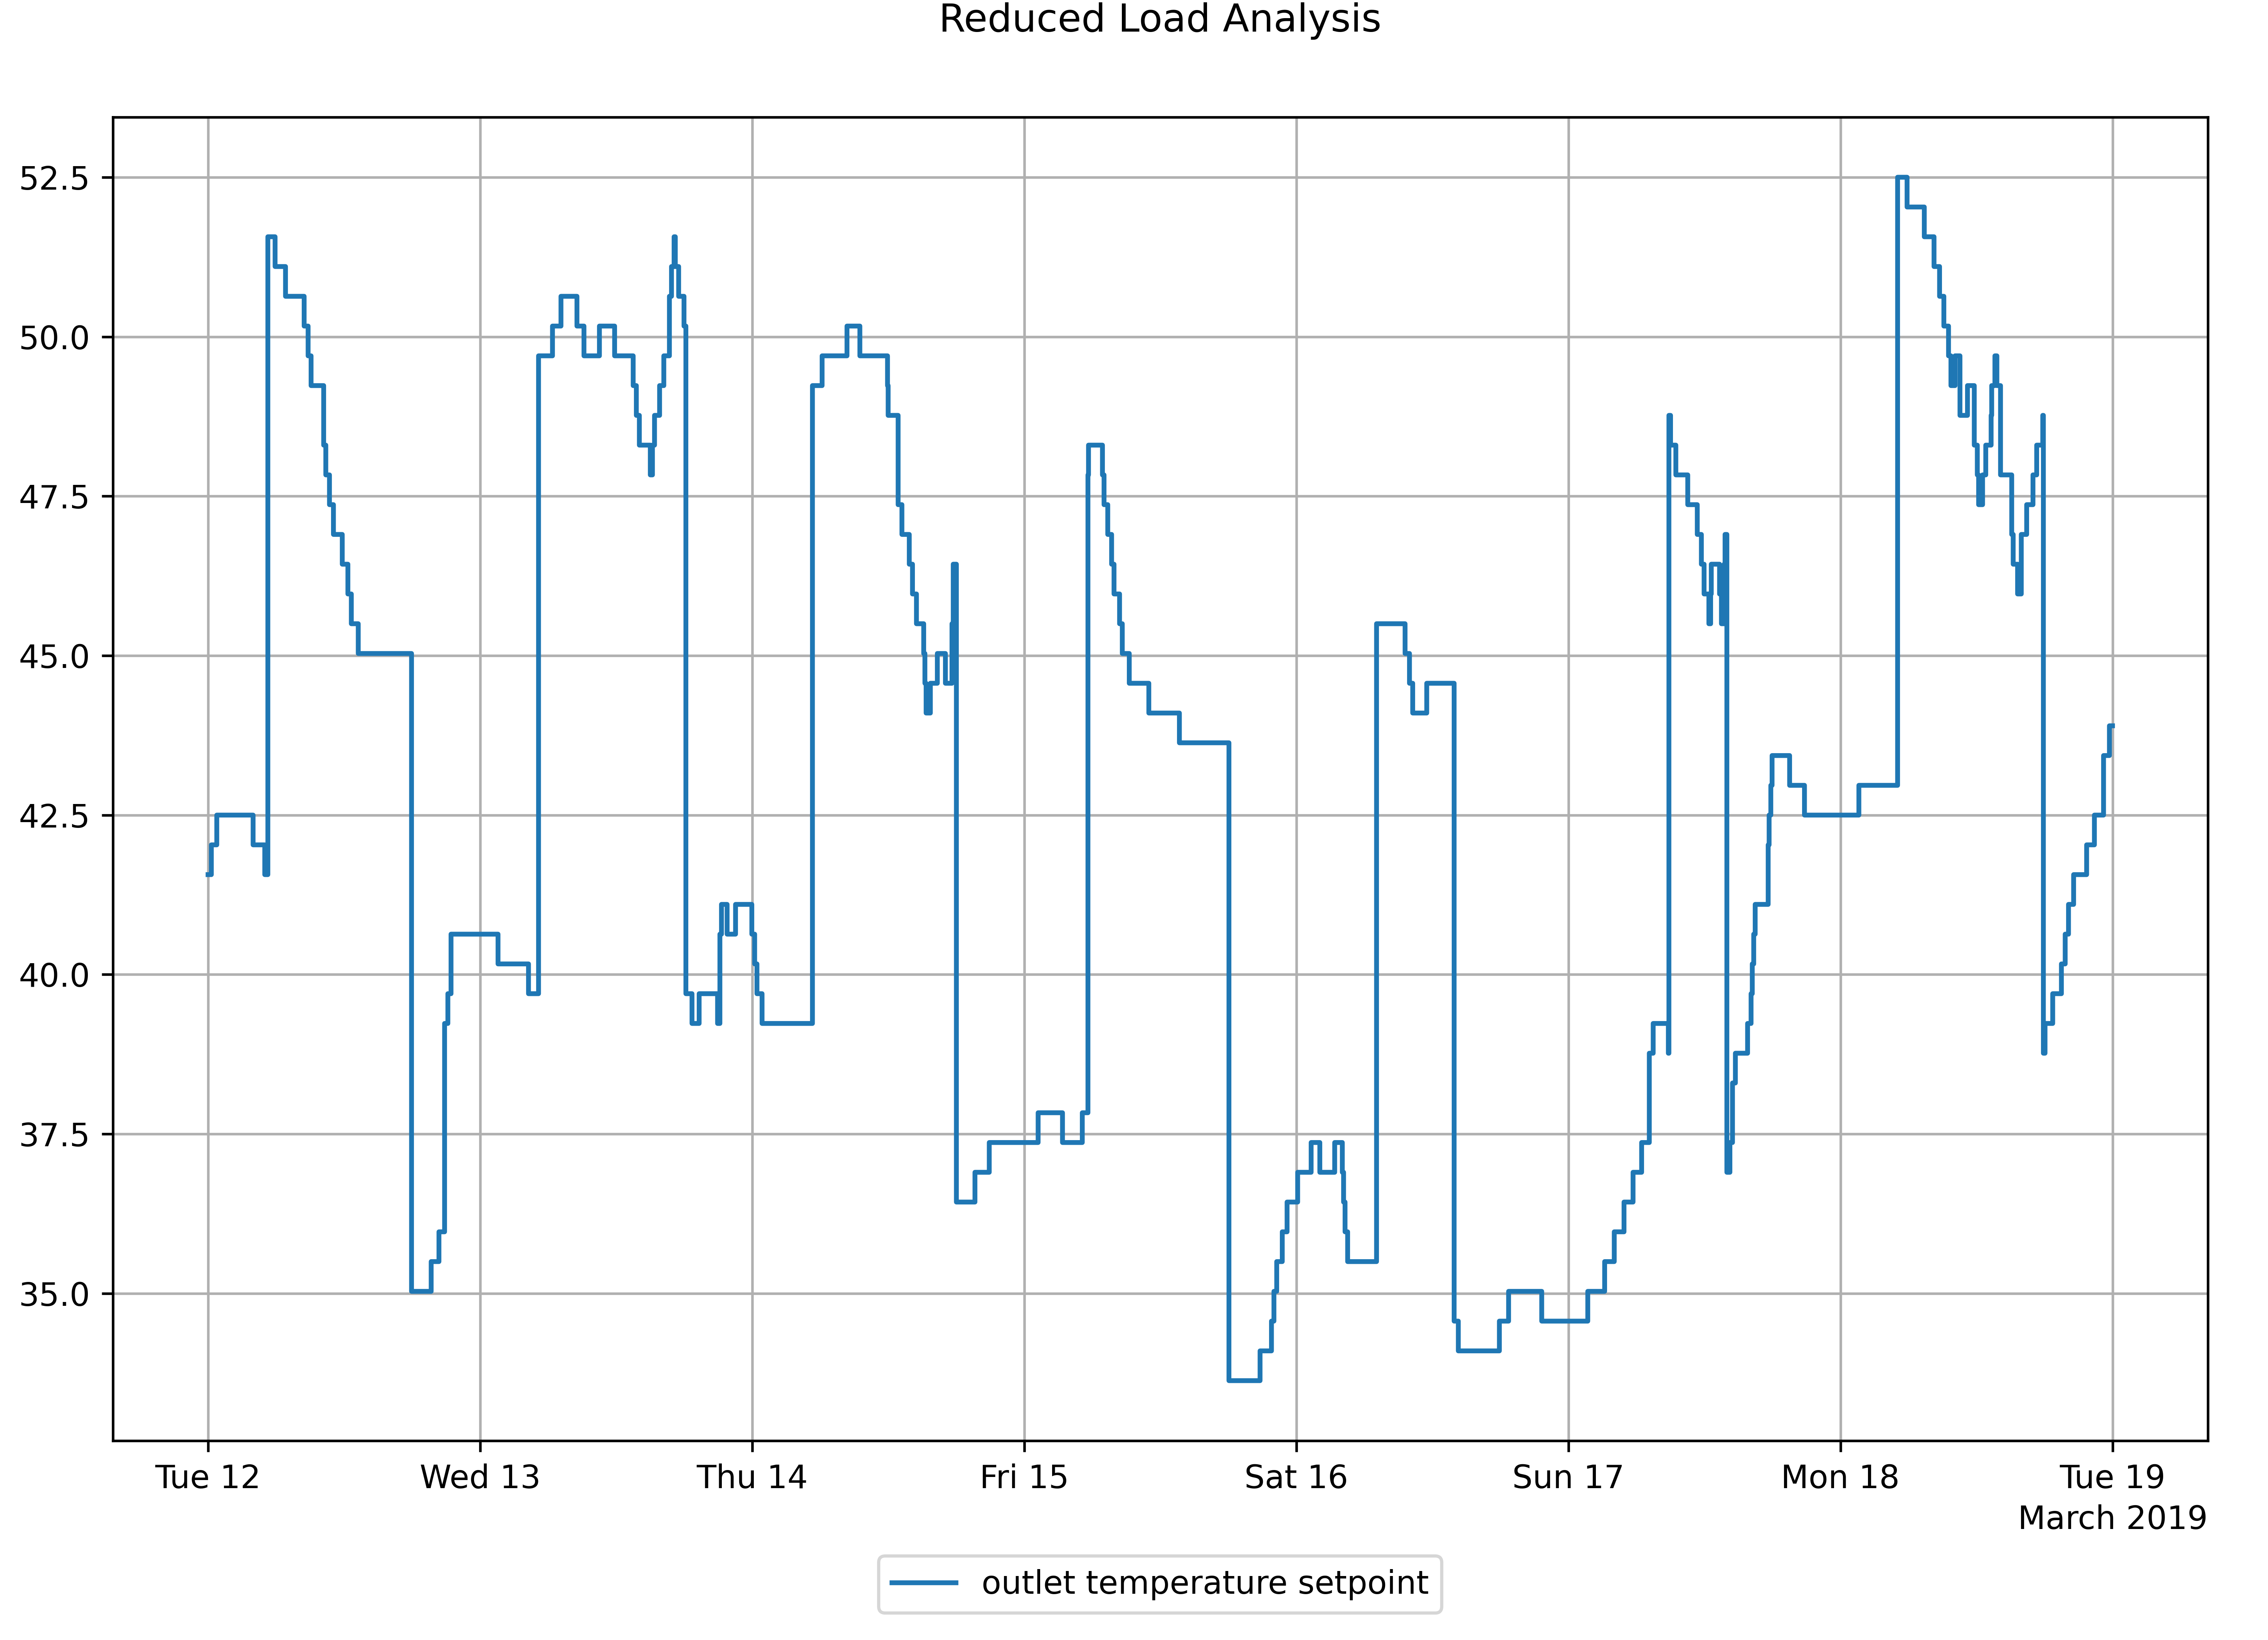
Figure 1: Temperature setpoint of the heating circuit
Schedule
| Day | Time |
|---|---|
| Mon | 05:00 - 18:00 |
| Tue | 05:00 - 18:00 |
| Wed | 05:00 - 18:00 |
| Thu | 05:00 - 18:00 |
| Fri | 05:00 - 18:00 |
| Sat | 07:00 - 14:00 |
| Sun | 07:00 - 14:00 |
| KPI | Value | Unit |
|---|---|---|
| reduced load operation | Yes | binary |
| temperature level shift | 10 | °C |
| operating time | 62.4 | h |
| operating time.normal load.reducible | 1.77 | h |
| operating time.normal load.reducible.relative | 2.84 | % |
| operating time.normal load.scheduled | 60.6 | h |
Signal colors
| Signal color | Available | Info |
|---|---|---|
| red | Yes | No load reduction identified (applied for thermal control loop). |
| yellow | Yes | No load reduction identified (applied for any component other than thermal control loop). |
| green | Yes | Load reduction identified. |
Interpretations
| Available | Info |
|---|---|
| Yes | Either the operational rule checks if the analysis were tested positive or not. |
Recommendations
| Available | Info |
|---|---|
| Yes | Implementation hints for load reduction. No recommendation, in case of sufficient measurement quality. |
KPIs
Identification of reduced load mode
| KPI Identifier | Info | Value Range | Unit |
|---|---|---|---|
| reduced load operation | Reduced load mode was detected No = no reduced load identified Yes = reduced load identified | Yes, No | binary |
| Slope heating curve | The slope of the identified heating curve | -100 to 100 | - |
Statistics of temperature level shift
| KPI Identifier | Info | Value Range | Unit |
|---|---|---|---|
| temperature level shift | Difference between setpoint temperature levels at the time of load reduction negative values = reduced temperature level for heating load reduction positive values = raised temperature level for cooling load reduction | -inf to inf | °C |
Schedule operating times
KPIs of this category analyze if the load reduction is in accordance to a schedule and if there are further savings by adjusting/implementing a load reduction schedule.
| KPI Identifier | Info | Value Range | Unit |
|---|---|---|---|
| operating time | Total time of operation | 0 to inf | h |
| operating time.normal load.reducible | Total time component was operated under normal load outside the reviewed schedule | 0 to inf | h |
| operating time.normal load.reducible.relative | Percentage of reducible operating time under normal load relative to the total operating time | 0 to 100 | % |
| operating time.normal load.scheduled | Total time of operation under normal load that is scheduled | 0 to inf | h |
Prioritization of the operating message pins
Order for operating messages is Pump - operating message, Operating message, Pump - control signal. If no pin is available the operating message will be considered as always on.
| Pin | Required | Mapping info |
|---|---|---|
| Operating message | No | - |
| Pump - control signal | No | - |
| Pump - operating message | No | - |
| Supply temperature setpoint | Yes | - |
| Outside air temperature | No | - |
| Attribute | Required | Mapping info |
|---|---|---|
| Custom day schedules | No | Deprecated |
| Custom holiday | No | Deprecated |
| Pre-conditioning period | No | Deprecated |
| Regional key | No | Deprecated |
| Schedule | No | Times for operation at normal load |
| Schedule timezone | No | The project location is used to automatically determine the timezone. Default: Europe/Berlin |
| Shutdown flexibility | No | Deprecated |
| Pin | Required | Mapping info |
|---|---|---|
| Temperature setpoint | Yes | - |
| Attribute | Required | Mapping info |
|---|---|---|
| Custom day schedules | No | Deprecated |
| Custom holiday | No | Deprecated |
| Pre-conditioning period | No | Deprecated |
| Regional key | No | Deprecated |
| Schedule | No | Times for operation at normal load |
| Schedule timezone | No | The project location is used to automatically determine the timezone. Default: Europe/Berlin |
| Shutdown flexibility | No | Deprecated |
Prioritization of the operating message pins
Order for operating messages is Pump - operating message, Operating message, Pump - control signal. If no pin is available the operating message will be considered as always on.
| Pin | Required | Mapping info |
|---|---|---|
| Operating message | No | - |
| Pump - control signal | No | - |
| Pump - operating message | No | - |
| Outlet temperature setpoint | Yes | - |
| Attribute | Required | Mapping info |
|---|---|---|
| Custom day schedules | No | Deprecated |
| Custom holiday | No | Deprecated |
| Pre-conditioning period | No | Deprecated |
| Regional key | No | Deprecated |
| Schedule | No | Times for operation at normal load |
| Schedule Timezone | No | The project location is used to automatically determine the timezone. Default: Europe/Berlin |
| Shutdown flexibility | No | Deprecated |
Recommend Time Span
1 day to 1 week
Recommended Repetition
Every 3 months
- After changes of operational modes, e.g., transfers to heating mode
- After changes in the control system
- After maintenance or replacements
Room Air Quality
The Room Air Quality analysis checks and interprets the measured CO2 concentration in a room and calculates a continuous air quality index ranging from 0% (low air quality) up to 100% (high air quality). If the air quality is poor, measures to improve it are recommended.
The algorithm also detects and automatically corrects calibration errors in the measured CO2 values. In general, human performance is affected by air quality and a lower performance can be expected when air quality is low.
Value
- Higher occupant comfort, health and performance
Recommended for components
- Room
Checked conditions
- Identification of higher room ventilation needs
- Detection of poor air quality during peak usage times
- Condition checks on times of components operation
- Sensor calibration check and automated correction
In order to calculate the air quality index, the measured CO2 (PPM) values are first sorted in a descending order. For an example timeseries, this can be seen as the grey dashed line in Figure 1.
The time period of the recorded data is then normalized to a percentage of time (see x-axis of figure 1) and the timeseries is corrected (blue line in figure 1). This is done by calculating a correction factor at the 98.5 percentile (pink bar), so that CO2 at this point is 450 ppm. The 450 ppm value is chosen to reflect outside conditions and it is expected that the 98.5 percentile PPM value should not be below outside conditions. The entire timeseries is raised or lowered by this factor (see blue vs. grey line in Figure 1). The value of this correction offset factor is returned as a KPI "Correction offset CO2 sensor".
Following this, the air quality index is now calculated with the CO2 value at the upper 1.5 percentile of the corrected CO2 timeseries (yellow bar).
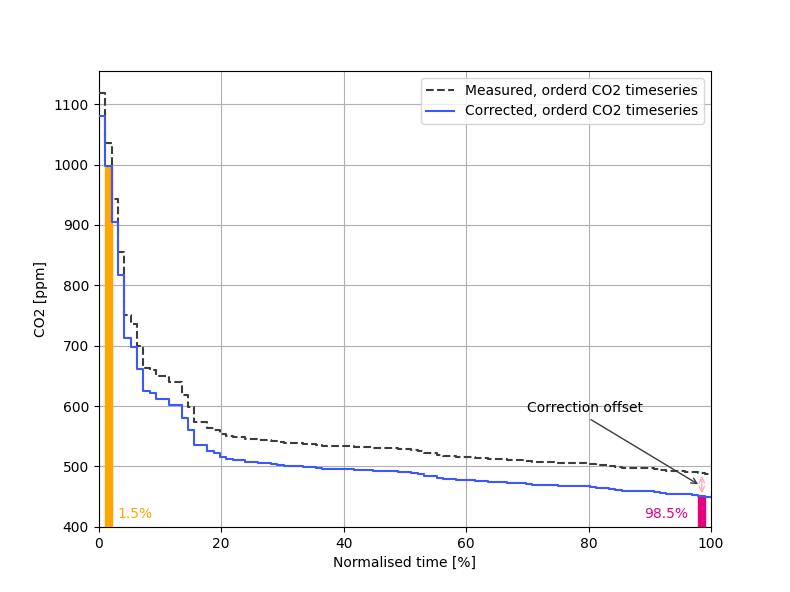
Using this CO2 value and the curve shown in figure 2, an overall air quality index between 0-100% is calculated.
For a standard week of 168h, the absolute time for the 1.5% percentile is approximately 2.52h. The use of the 1.5% percentile value ensures that a warning is triggered if the room has a high CO2 reading longer than a cumulative period of 2.5h. However, no warning is triggered if extremely high values occur for only a very short time, as this could be due to a possible measurement error.
The default value of the "1.5% percentile" can be changed via the attribute "Percentile value for calculating air quality". There are also 4 attributes to adjust the two points 1 and 2 of the curve in Figure 2 as well as the limits for the red and yellow signal colors.
For further default values see attributes under the section components.
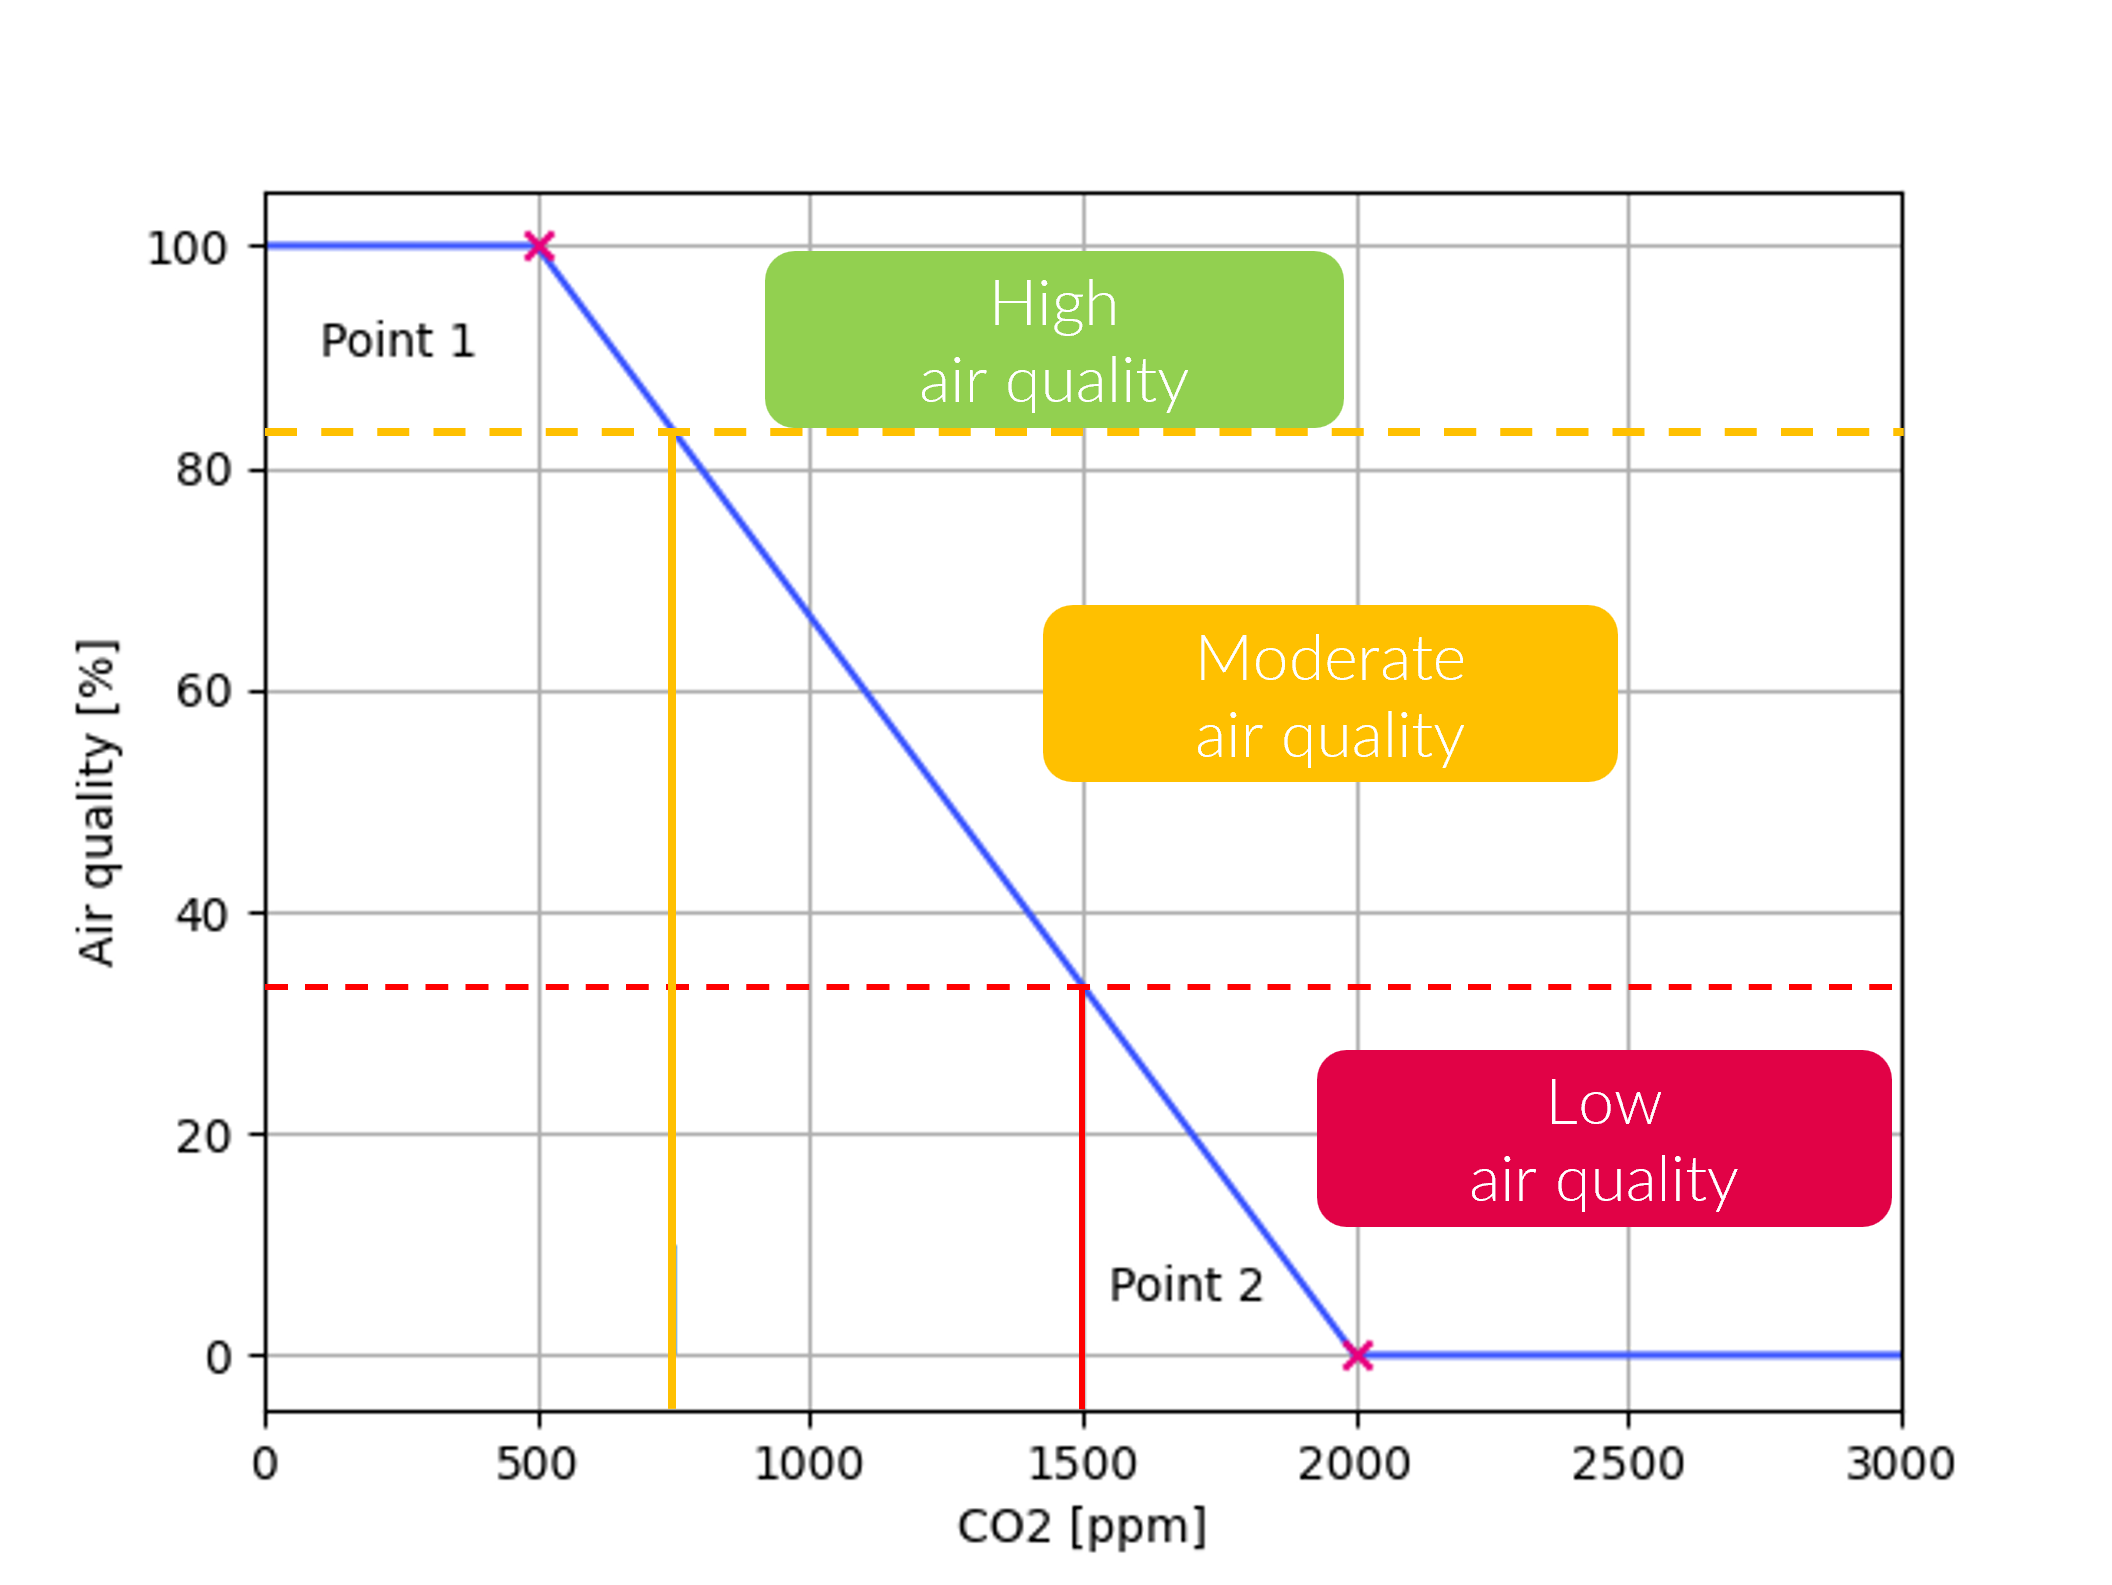
Signal colors
| Signal color | Available | Info |
|---|---|---|
| red | Yes | Low air quality. CO2 concentrations are critical to human health. |
| yellow | Yes | Moderate air quality. CO2 concentrations can reduce human comfort, decisiveness, and performance. |
| green | Yes | High air quality. CO2 concentrations sufficient for high comfort. |
Interpretations
| Available | Info |
|---|---|
| Yes | Interpretations summarize the result of the analysis. |
Recommendations
| Available | Info |
|---|---|
| Yes | Recommendations to improve air quality. No recommendation, in case of sufficient air quality. |
KPIs
Operational KPIs
calculations room is active less than 8h
If the active time of the room is less then 8h only the KPIs "Overall air quality", and the "CO2 value at overall air quality" are calculated.
| KPI Identifier | Info | Value Range | Unit |
|---|---|---|---|
| Operating time | Duration of presence, the active room control, or a set schedule attribute if the presence is not being measured. If nothing is connected the room is considered as always off | 0 to inf | h |
| Operating time.relative | Duration of presence, the active room control, or a set schedule attribute if the presence is not being measured relative to the evaluation period. If nothing is connected the room is considered as always off | 0 to 100 | % |
Default values KPIs
Returns some relevant default values that were used to calculate the air quality
| KPI Identifier | Info | Value Range | Unit |
|---|---|---|---|
| Resample rate for CO2 measurement data | Resample rate for measured CO2 timeseries, Default: 30T | Pandas offset aliases | string |
| Percentile value for calculating air quality | Percentile value at which the CO2 concentration is used for air quality calculation, Default: 1.5% | 0 to 100 | % |
| Yellow limit | Default: 750 ppm. | 0 to inf | ppm |
| Red limit | Default: 1500 ppm. | 0 to inf | ppm |
Air quality KPIs
| KPI Identifier | Info | Value Range | Unit |
|---|---|---|---|
| Overall air quality | Air quality index at the 1.5% percentile. | 0 to 100 | % |
| CO2 value at overall air quality | CO2 concentration at the 1.5% percentile. | 0 to inf | ppm |
| Air quality top percentile (worst) | Percentage of air quality at the highest percentile (0%). Worst air quality concentration for 30 minutes during evaluation period. | 0 to 100 | % |
| CO2 value at air quality top percentile (worst) | CO2 concentration at the highest percentile. Highest CO2 concentration for 30 minutes during evaluation period. | 0 to inf | ppm |
| Duration.air quality category.high.relative | Duration of high air quality during active room usage relative to total time usage of room. | 0 to 100 | % |
| Duration.air quality category.moderate.relative | Duration of moderate air quality uring active room usage relative to total time usage of room. | 0 to 100 | % |
| Duration.air quality category.low.relative | Duration of low air quality uring active room usage relative to total time usage of room. | 0 to 100 | % |
| Duration.air quality category.high | Absolute duration with high air quality uring active room usage. | 0 to inf | h |
| Duration.air quality category.moderate | Absolute duration with moderate air quality uring active room usage. | 0 to inf | h |
| Duration.air quality category.low | Absolute duration with “low“ air quality uring active room usage. | 0 to inf | h |
Statistical KPIs of CO2 concentration
Providing deeper insights into the carbon dioxide concentrations over the analyzed period.
Correction of measured timeseries
Positive values indicate that the readings are above 450 ppm at the 98.5 percentile and the corrected timeseries is lowered by this factor; negative values indicate that the readings are below 450 ppm and the timeseries is raised.
| KPI Identifier | Info | Value Range | Unit |
|---|---|---|---|
| CO2 measured value.mean | Mean measured CO2 concentration during active time. | 0 to inf | ppm |
| CO2 measured value.maximum | Maximum measured CO2 concentration during active time. | 0 to inf | ppm |
| CO2 measured value.minimum | Minimum measured CO2 concentration during active time. | 0 to inf | ppm |
| Correction offset CO2 sensor | Correction offset factor to raise or lower the corrected timeseries to 450 ppm at the 98.5 time percentile | -inf to inf | ppm |
| CO2 measured value.corrected.mean | Mean corrected CO2 concentration during active time. | 0 to inf | ppm |
| CO2 measured value.corrected.maximum | Maximum corrected CO2 concentration during active time. | 0 to inf | ppm |
| CO2 measured value.corrected.minimum | Minimum corrected CO2 concentration during active time. | 0 to inf | ppm |
| Pin | Required | Mapping info | Unit |
|---|---|---|---|
| CO2 | Yes | Necessary for all KPIs. | ppm |
| Operating message | No | Mapping of either presence (preferred) or operating message is strongly recommended. If both pins are mapped, presence is used. If both pins are not available and a schedule attribute is set, the schedule is used to calculate an operating message Default: Always absent | binary |
| Presence | No | Mapping of either presence (preferred) or operating message is strongly recommended. If both pins are mapped, presence is used. If both pins are not available and a schedule attribute is set, the schedule is used to calculate an operating message Default: Always absent | binary |
| Attribute | Required | Mapping info | Unit |
|---|---|---|---|
| CO2 curve - upper point 1 CO2 | No | Default: 500 | ppm |
| CO2 curve - upper point 1 percent | No | Default: 100 | % |
| CO2 curve - lower point 2 CO2 | No | Default: 2000 | ppm |
| CO2 curve - lower point 2 percent | No | Default: 0 | % |
| Percentage time for room air quality calculation | No | Default: 1.5 | % |
| Room air quality yellow limit | No | Default: 750 | ppm |
| Room air quality red limit | No | Default: 1500 | ppm |
Recommend Time Span
1 day to 1 week
- Utilize on days with room occupation
Recommended Repetition
Every month
- After changes of room occupation or usage
- After changes of operational modes, e.g., transfers to heating mode
- After changes in the control system of the ventilation systems
- After maintenance or replacements in ventilation systems
Savings Aggregation
The Savings Aggregation analysis aggregates savings from the savings page into project-level yearly KPIs. The savings are either manually added by the user or selected based on savings potential identified by analysis functions. Unlike the other analysis functions, it does not evaluate a time period. It reports the current static state of the project's savings at the moment the analysis runs. The savings are reported for three states (open, potential and realized), three contexts (energy, financial and CO2) and three metrics (absolute, per net floor area and relative to a yearly reference consumption). See Savings potential for how the underlying per-analysis savings are produced.
Value
- Project-wide overview of energy, financial and CO2 savings
- Tracks savings across their lifecycle: open, potential and realized
- ESG-reporting of realized savings and remaining potential
- Benchmarks savings against the building's yearly reference consumption (relative savings)
Recommended for components
Complete buildings. The analysis aggregates the savings of the whole project.
Checked conditions
- Aggregated yearly savings per state (open, potential, realized)
- Aggregated yearly savings per context (energy, financial, CO2)
- Availability of the building attributes required for per-area and relative savings
In this example a project has savings configured on several components. The analysis sums their yearly savings into project-level KPIs. The building has a net floor area of 1,000 m2 and a yearly reference energy consumption of 120,000 kWh, which allows the per-area and relative savings to be calculated. Because all required attributes are available, the result is green with the interpretation Savings-KPIs calculated.
| KPI | Value | Unit |
|---|---|---|
| yearly potential savings.energy.absolute | 12000 | kWh |
| yearly realized savings.energy.absolute | 4000 | kWh |
| yearly open savings.energy.absolute | 8000 | kWh |
| yearly potential savings.energy.per area | 12 | kWh/m2 |
| yearly potential savings.energy.relative | 10 | % |
| yearly absolute reference energy consumption | 120000 | kWh |
Signal colors
| Signal color | Available | Info |
|---|---|---|
| red | No | This analysis does not produce a red result. |
| yellow | Yes | Savings KPIs were only partially calculated because building attributes are missing, e.g. net floor area or reference consumption. |
| green | Yes | All savings KPIs were calculated, or no savings are configured in the project yet. |
A grey result with the interpretation Invalid configuration is returned if the building component or the project savings could not be loaded.
Interpretations
| Available | Info |
|---|---|
| Yes | One of Savings-KPIs calculated, Savings-KPIs partially calculated or Savings-KPIs not calculated. |
Recommendations
| Available | Info |
|---|---|
| Yes | If no savings are configured, a recommendation to set up savings on the savings page. |
| Yes | If attributes are missing, a recommendation listing the building attributes to set for a full or more accurate calculation. |
KPIs
<state\> is one of potential, realized or open:
- potential: total identified savings potential
- realized: savings that have already been realized
- open: identified savings that have not yet been realized
The relative metric expresses the savings as a percentage of the building's yearly reference consumption, costs or emissions. The per area metric relates the savings to the building's net floor area.
Savings KPIs
| KPI Identifier | Info | Value Range | Unit |
|---|---|---|---|
| yearly <state> savings.energy.absolute | Aggregated yearly energy savings | 0 to inf | kWh |
| yearly <state> savings.energy.per area | Aggregated yearly energy savings per net floor area | 0 to inf | kWh/m2 |
| yearly <state> savings.energy.relative | Aggregated yearly energy savings relative to the yearly reference energy consumption | 0 to inf | % |
| yearly <state> savings.financial.absolute | Aggregated yearly financial savings | 0 to inf | € |
| yearly <state> savings.financial.per area | Aggregated yearly financial savings per net floor area | 0 to inf | €/m2 |
| yearly <state> savings.financial.relative | Aggregated yearly financial savings relative to the yearly reference energy costs | 0 to inf | % |
| yearly <state> savings.co2.absolute | Aggregated yearly CO2 emission savings | 0 to inf | kg |
| yearly <state> savings.co2.per area | Aggregated yearly CO2 emission savings per net floor area | 0 to inf | kg/m2 |
| yearly <state> savings.co2.relative | Aggregated yearly CO2 emission savings relative to the yearly reference CO2 emissions | 0 to inf | % |
Reference base KPIs
The reference base KPIs are only added when the relative savings could be calculated.
| KPI Identifier | Info | Value Range | Unit |
|---|---|---|---|
| yearly absolute reference energy consumption | Sum of the yearly reference energy consumption attributes; basis for relative energy savings | 0 to inf | kWh |
| yearly absolute reference energy costs | Yearly reference energy costs derived from reference consumption and prices; basis for relative financial savings | 0 to inf | € |
| yearly absolute reference co2 emissions | Yearly reference CO2 emissions derived from reference consumption and emission factors; basis for relative CO2 savings | 0 to inf | kg |
| Pin | Required | Mapping info | Unit |
|---|---|---|---|
| - | - | - | - |
| Attribute | Required | Mapping info | Unit |
|---|---|---|---|
| Net floor area | No | Required to calculate the per-area savings KPIs. | m2 |
| Reference energy consumption electricity | No | Annual reference electric energy consumption; basis for relative savings. | kWh/a |
| Reference energy consumption heat | No | Annual reference heat energy consumption; basis for relative savings. | kWh/a |
| Reference energy consumption cold | No | Annual reference cold energy consumption; basis for relative savings. | kWh/a |
| Reference energy consumption fuel | No | Annual reference fuel energy consumption; basis for relative savings. | kWh/a |
| Electricity price | No | Used to derive the financial reference base. Default: 0.25 | €/kWh |
| Heat price | No | Used to derive the financial reference base. Default: 0.15 | €/kWh |
| Cold price | No | Used to derive the financial reference base. Default: 0.1 | €/kWh |
| Fuel price | No | Used to derive the financial reference base. Default: 0.1 | €/kWh |
| CO2 emission factor electricity | No | Used to derive the CO2 reference base. Default: 0.56 | kg/kWh |
| CO2 emission factor heat | No | Used to derive the CO2 reference base. Default: 0.36 | kg/kWh |
| CO2 emission factor cold | No | Used to derive the CO2 reference base. Default: 0.3 | kg/kWh |
| CO2 emission factor fuel | No | Used to derive the CO2 reference base. Default: 0.24 | kg/kWh |
This analysis has no recommended time span and no automated or scheduled execution.
It is triggered automatically whenever a saving is added, changed or removed on the savings page, so that the aggregated savings KPIs always reflect the current state.
Schedule
The Schedule analysis is used to compare the actual occurred switch on/switch off times of the component with a schedule/timetable stored inside analytics. This analysis aims at identifying the number of hours the component is active outside the scheduled times and the potential savings of implementing a schedule. See Savings potential for how this fits the general pattern. In addition to a one-time check, the analysis is suitable for permanent checks, e.g., to identify manual overwriting of the operating schedule. The analysis considers holidays and customized schedules.
Value
- Lower operating times of HVAC components
- Lower energy consumption
- Lower maintenance costs due to less component operating time
Recommended for components
Any HVAC component or room whose usage follows a recurrent schedule, such as:
- Air handling units
- Thermal control loops
- Office rooms
- Sales rooms
Checked conditions
- Component operation outside a user-defined schedule
- Component operation during a user-defined schedule
- Condition checks on times of components operation
This example shows a Schedule analysis for a component "fan" connected to a supply fan operating message of an HVAC machine. The switch on/off times of the machine are shown as a blue line in figure 1, blue regions in the background correspond to the expected schedule.
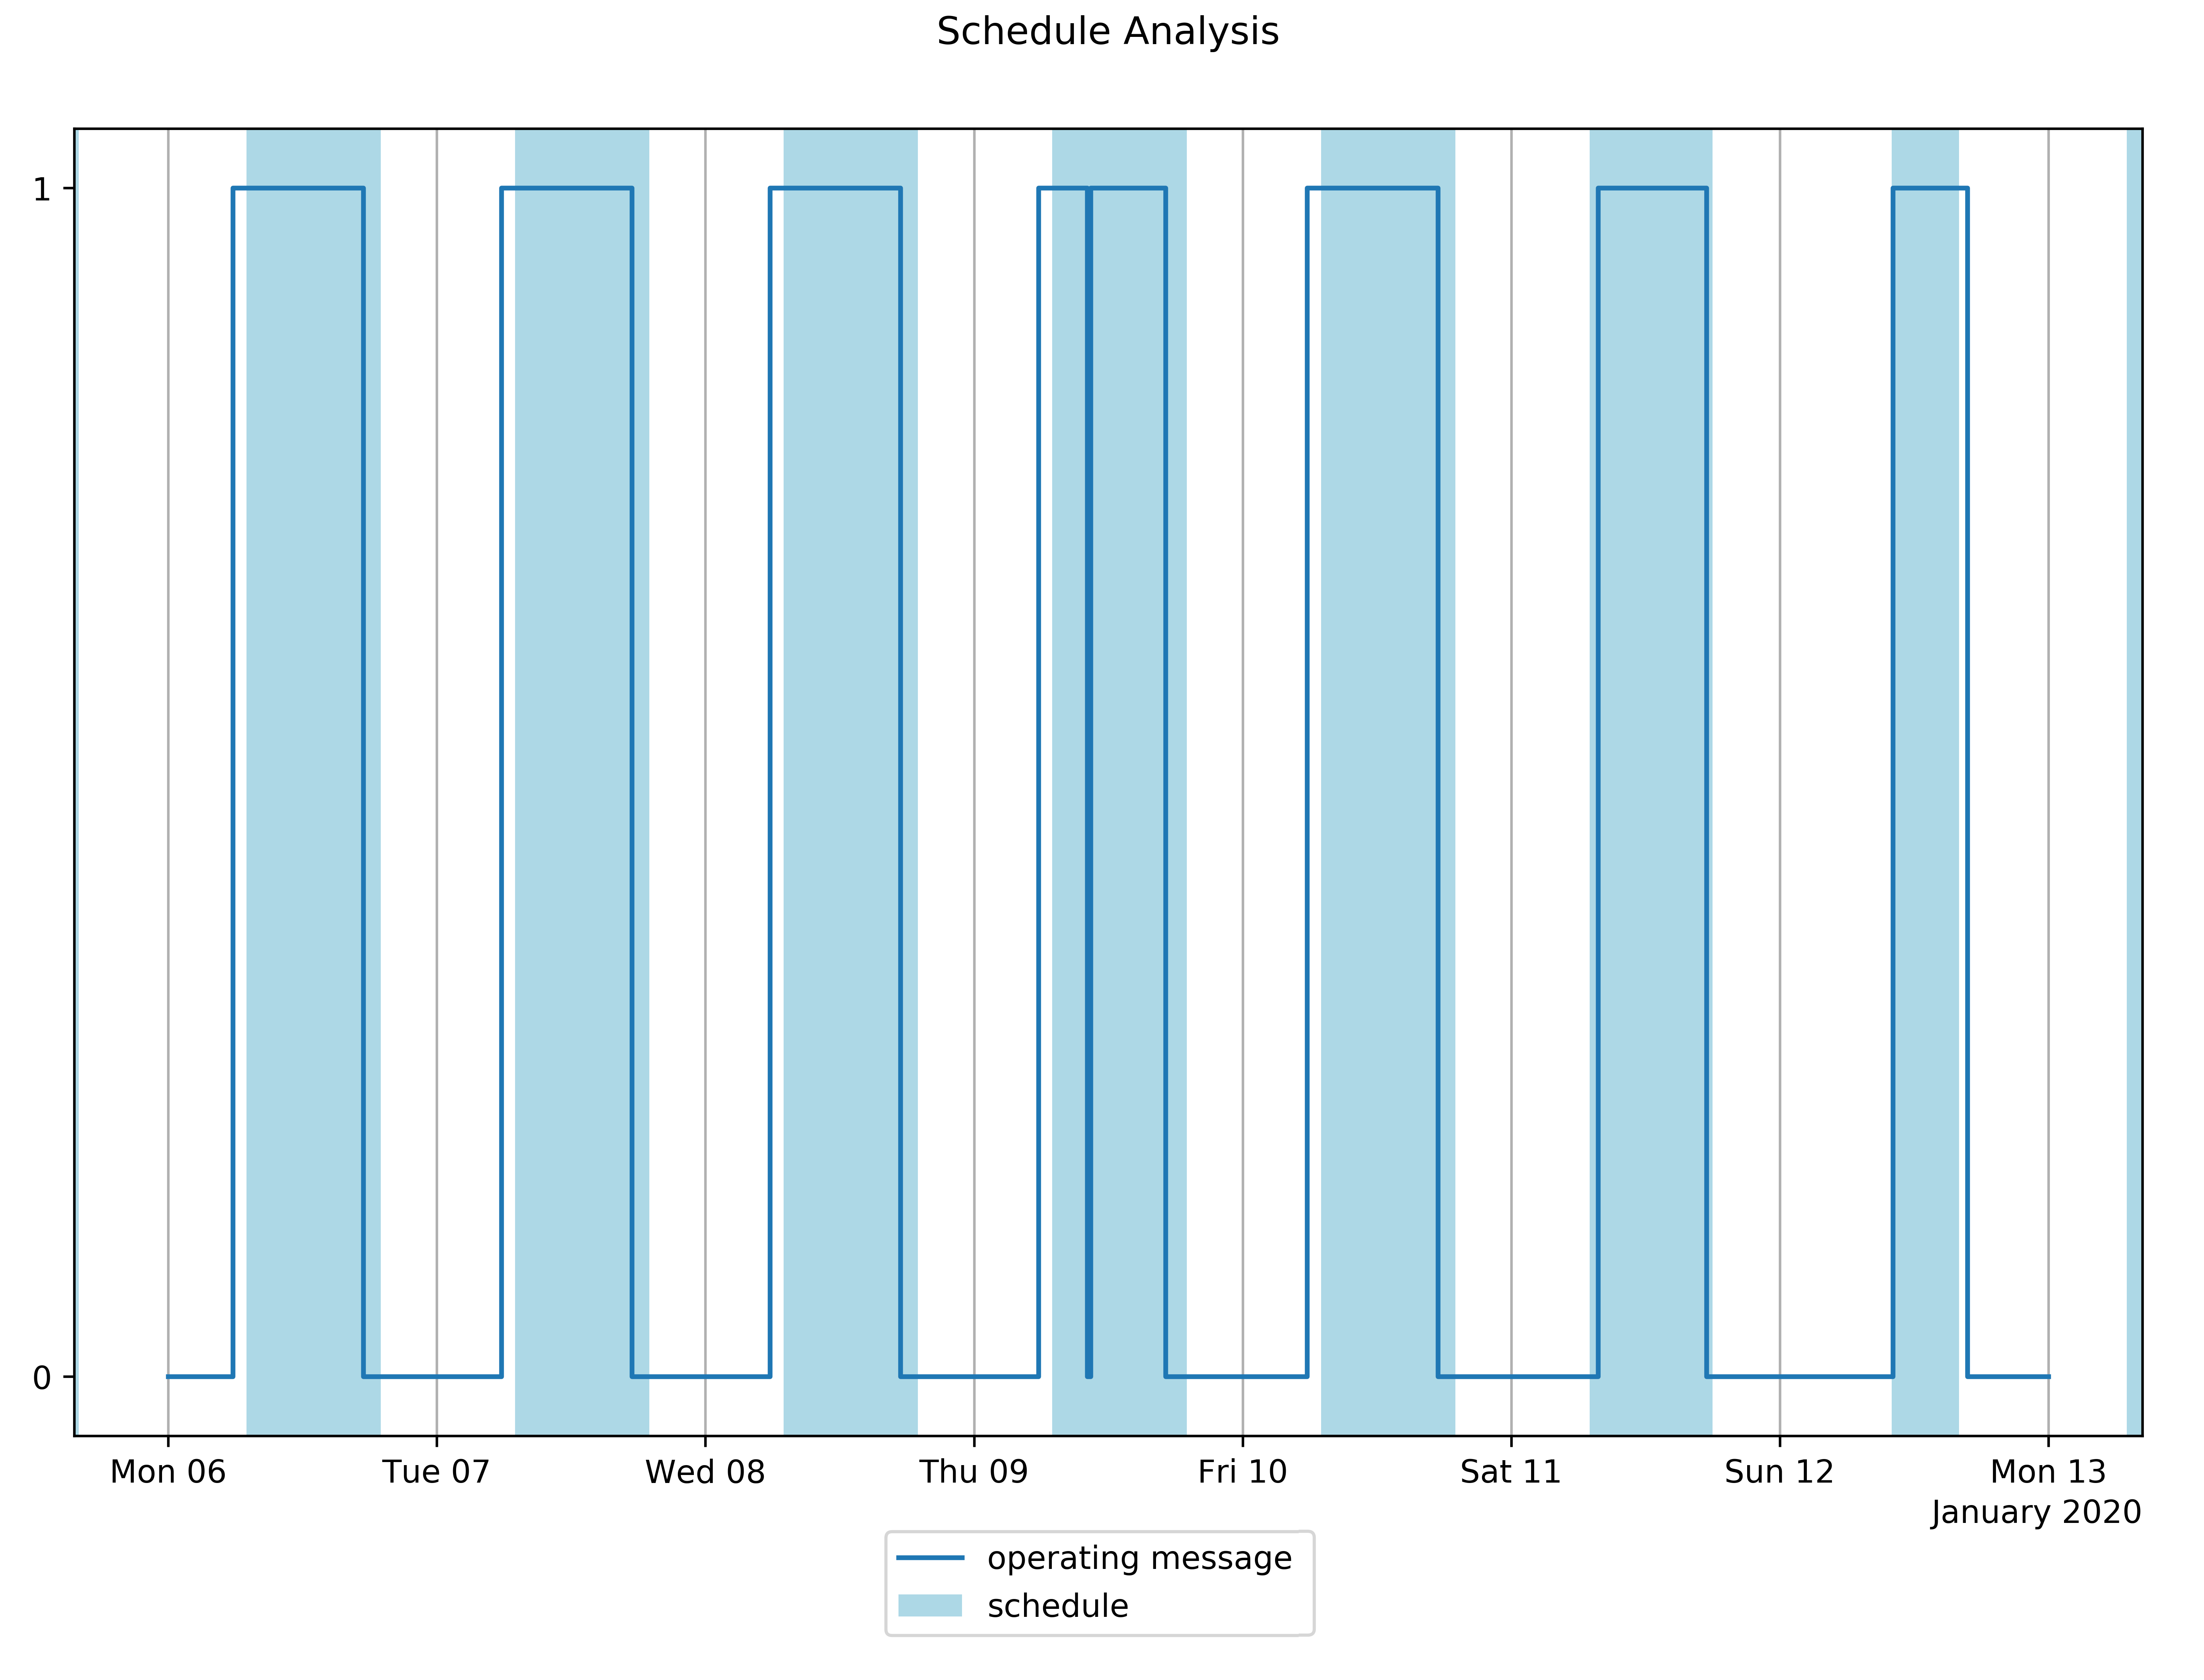
Figure 1: Operating times of component and reference schedule
A reduction of ~9% of the total operating time is possible, as can be seen in the table of KPIs below. With the help of the plot we can also see, that the times where we can reduce the operating time are distributed over the workdays of the week. Furthermore, the mapping of the component enables the determination of economic KPIs with a "low" accuracy level. Assuming a nominal power consumption of 3 kW and the electricity price to be 0.18 €/kWh, the energy costs outside the scheduled operating times are calculated. This results in weekly energy costs of 3.75 € which fall outside of the schedule.
| KPI | Value | Unit |
|---|---|---|
| operating time | 74 | h |
| operating time.reducible | 6.94 | h |
| operating time.reducible.relative | 9.38 | % |
| operating time.scheduled | 67.1 | h |
| savings.daily | 1.53 | €/d |
| energy consumption costs.outside schedule.daily | 0.54 | €/day |
| energy consumption costs.outside schedule.weekly | 3.75 | €/week |
Signal colors
| Signal color | Available | Info |
|---|---|---|
| red | Yes | Significant operation times outside of the parameterized schedule identified or high potential for savings found |
| yellow | Yes | Partial operation times outside of the parameterized schedule identified or potential for savings found |
| green | Yes | Sufficient operation according to the parameterized schedule or potential for savings is low |
Interpretations
| Available | Info |
|---|---|
| Yes | Interpretations summarize the result of the analysis. |
Recommendations
| Available | Info |
|---|---|
| Yes | Recommendations to improve the scheduled operation of the component. No recommendation, in case of sufficient measurement quality. |
KPIs
Schedule KPIs
| KPI Identifier | Info | Value Range | Unit |
|---|---|---|---|
| holidays | Number of holidays during the analysis period | 0 to inf | d |
| scheduled time | Total time the provided schedule is active during the analysis period | 0 to inf | h |
| scheduled time reduction due to holidays | Total time the provided schedule is reduced due to holidays during the analysis period | 0 to inf | h |
| scheduled time.relative | Total time the schedule is active relative to the analysis period | 0 to 100 | % |
Week schedule KPIs
The week schedule KPI provides a human-readable representation of the operating message timeseries. The operating message is summarized and grouped according to the days of the week. Switch-on and switch-off times are rounded to the nearest 15-minute timestamp, e.g. 17:54 is rounded to 18:00. On- and Off-periods with a duration of less than 15 minutes are neglected, e.g. 08:30-15:11 and 15:23-17:30 are combined to 08:30-17:30.
| KPI Identifier | Info | Value Range | Unit |
|---|---|---|---|
| week schedule.actual | Summary of the actual operating message, e.g. Mon-Sa: 06:00-18:30 | - | string |
| week schedule.recommended | Summary of the recommended operating message, which is a direct representation of the schedule attribute, e.g. Mon-Fri: 08:00-18:00 | - | string |
Operating KPIs
If there are multiple sub-components with operating times a prefix is added to the kpi identifier. For example the AHU will generate operating times for Supply fan and Exhaust fan.
| KPI Identifier | Info | Value Range | Unit |
|---|---|---|---|
| <subcomponent>.operating time | Total time of operation in analysis period | 0 to inf | h |
| <subcomponent>.operating time on holidays | Total time of operation during holidays in analysis period | 0 to inf | h |
| <subcomponent>.operating time.missing | The amount of operating time that is missing to complete the schedule | 0 to inf | h |
| <subcomponent>.operating time.reducible | The amount of time the operation can be reduced, taking into account the missing time | 0 to inf | h |
| <subcomponent>.operating time.reducible outside schedule | The amount of time the operation is outside of the schedule | 0 to inf | h |
| <subcomponent>.operating time.reducible.relative | The reducible time relative to the operating time | 0 to 100 | % |
| <subcomponent>.operating time.reducible.relative to analysis period | The reducible time relative to the analysis period | 0 to 100 | % |
| <subcomponent>.operating time.relative | Total operating time relative to analysis period | 0 to 100 | % |
| <subcomponent>.operating time.scheduled | The amount of time the operation was inside the scheduled timeframe | 0 to inf | h |
Energy KPIs
If there are multiple sub-components with operating times a prefix is added to the kpi identifier. For example the AHU will generate energy consumption KPIs for Supply fan and Exhaust fan.
| KPI Identifier | Info | Value Range | Unit |
|---|---|---|---|
| <subcomponent>.energy consumption.electricity | Electricity consumption of component or subcomponent in analysis period | 0 to inf | kWh |
| <subcomponent>.nominal electric power | Nominal electric power of subcomponent | 0 to inf | kW |
| KPI Identifier | Info | Value Range | Unit |
|---|---|---|---|
| energy consumption.cold | Consumption of thermal energy (cold) during analysis period | 0 to inf | kWh |
| energy consumption.electricity | Consumption of electric energy during analysis period | 0 to inf | kWh |
| energy consumption.heat | Consumption of thermal energy (heat) during analysis period | 0 to inf | kWh |
| total energy consumption | Total energy consumption as a summation of thermal and electric energy during analysis period | 0 to inf | kWh |
Environmental KPIs
| KPI Identifier | Info | Value Range | Unit |
|---|---|---|---|
| CO2 emissions.cold | CO2 emissions due to usage of thermal cold energy during analysis period | 0 to inf | kg |
| CO2 emissions.electricity | CO2 emissions due to usage of electricity during analysis period | 0 to inf | kg |
| CO2 emissions.heat | CO2 emissions due to usage of thermal heat energy during analysis period | 0 to inf | kg |
| total CO2 emissions | Total CO2 emissions of the component during analysis period | 0 to inf | kg |
Economic KPIs
| KPI Identifier | Info | Value Range | Unit |
|---|---|---|---|
| cost.cold | Cost of thermal cold energy during analysis period | 0 to inf | € |
| cost.electricity | Cost of electricity during analysis period | 0 to inf | € |
| cost.heat | Cost of thermal heat energy during analysis period | 0 to inf | € |
| CO2 emission factor.cold | CO2 emission factor of thermal cold | 0 to inf | kg/kWh |
| CO2 emission factor.electricity | CO2 emission factor of electricity | 0 to inf | kg/kWh |
| CO2 emission factor.heat | CO2 emission factor of thermal heat | 0 to inf | kg/kWh |
| energy price.cold | Energy price of thermal cold | 0 to inf | €/kWh |
| energy price.electricity | Energy price of electricity | 0 to inf | €/kWh |
| energy price.heat | Energy price of thermal heat | 0 to inf | €/kWh |
| total cost | Total cost of energy during analysis period | 0 to inf | € |
Savings potential KPIs
If there are multiple sub-components with operating times a prefix is added to the kpi identifier. For example the AHU will generate energy consumption KPIs for Supply fan and Exhaust fan.
| KPI Identifier | Info | Value Range | Unit |
|---|---|---|---|
| <subcomponent>.savings potential.energy.electricity | Electric savings potential of the sub-component | 0 to inf | kWh |
These KPIs are used to show the savings potential of the component in the analysis period. The deciding input is how many operating hours could have been reduced adhering to the schedule thus savings energy, CO2 emissions and costs.
| KPI Identifier | Info | Value Range | Unit |
|---|---|---|---|
| savings potential.CO2 emissions.cold | CO2 emissions that could have been avoided in the analysis period by saving thermal cold energy | 0 to inf | kg |
| savings potential.CO2 emissions.electricity | CO2 emissions that could have been avoided in the analysis period by saving electricity | 0 to inf | kg |
| savings potential.CO2 emissions.heat | CO2 emissions that could have been avoided in the analysis period by saving thermal heat energy | 0 to inf | kg |
| savings potential.energy.cold | Thermal cold energy that could have been avoided in the analysis period | 0 to inf | kWh |
| savings potential.energy.electricity | Electricity that could have been avoided in the analysis period | 0 to inf | kWh |
| savings potential.energy.heat | Thermal heat energy that could have been avoided in the analysis period | 0 to inf | kWh |
| savings potential.financial.cold | Energy costs for cold energy that could have been avoided in the analysis period | 0 to inf | € |
| savings potential.financial.electricity | Energy costs for electricity that could have been avoided in the analysis period | 0 to inf | € |
| savings potential.financial.heat | Energy costs for heat energy that could have been avoided in the analysis period | 0 to inf | € |
| total savings potential.CO2 emissions | Total CO2 emissions that could have been avoided in the analysis period | 0 to inf | kg |
| total savings potential.energy | Total energy amount that could have been avoided in the analysis period | 0 to inf | kWh |
| total savings potential.financial | Total costs that could have been avoided in the analysis period | 0 to inf | € |
Yearly savings potential KPIs
These KPIs estimate the savings potential extrapolated for a whole reference year. The reducible hours calculated from the analysis period are used to extrapolate the whole year.
| KPI Identifier | Info | Value Range | Unit |
|---|---|---|---|
| yearly savings potential.CO2 emissions.cold | CO2 emissions that could be saved due to thermal cold energy in a reference year with scheduled operation | 0 to inf | t |
| yearly savings potential.CO2 emissions.electricity | CO2 emissions that could be saved due to electricity in a reference year with scheduled operation | 0 to inf | t |
| yearly savings potential.CO2 emissions.heat | CO2 emissions that could be saved due to thermal heat energy in a reference year with scheduled operation | 0 to inf | t |
| yearly savings potential.energy.cold | Thermal cold energy that could be saved in a reference year with scheduled operation | 0 to inf | kWh |
| yearly savings potential.energy.electricity | Electricity that could be saved in a reference year with scheduled operation | 0 to inf | kWh |
| yearly savings potential.energy.heat | Thermal heat energy that could be saved in a reference year with scheduled operation | 0 to inf | kWh |
| yearly savings potential.financial.cold | Costs that could be saved due to thermal cold energy in a reference year with scheduled operation | 0 to inf | € |
| yearly savings potential.financial.electricity | Costs that could be saved due electricity in one year with scheduled operation | 0 to inf | € |
| yearly savings potential.financial.heat | Costs that could be saved due to thermal heat energy in a reference year with scheduled operation | 0 to inf | € |
| total yearly savings potential.CO2 emissions | Total CO2 emissions that could be saved in a reference year with scheduled operation | 0 to inf | t |
| total yearly savings potential.energy | Total energy that could be saved in a reference year with scheduled operation | 0 to inf | kWh |
| total yearly savings potential.financial | Total costs that could be saved in a reference year with scheduled operation | 0 to inf | € |
The Economic KPIs, Savings potential KPIs and Yearly savings potential KPIs are provided for the components:
- Air handling unit
Options for savings calculation
The following tables summarize the possible pin and attribute combinations that are needed to calculate the yearly savings potential.
Configuration for general schedule analysis
The following table describes the pins and/or attributes that are required to determine the actual operating time of the air handling unit. At the same time, it determines the availability of the supply/return air fan.
| Priorities | Pins | Attributes |
|---|---|---|
| prio 1 | Supply air fan - operating message | Schedule |
| prio 2 | Supply air fan - position | Schedule |
| prio 3 | Supply air fan - control signal | Schedule |
| prio 4 | Supply air fan - pressure | Schedule |
| prio 5 | Supply air fan - volume flow | Schedule |
| prio 6 | no calculation possible, fan is not connected | - |
Configuration heat recovery system
The following table describes the pins and/or attributes that are required to determine the availability of a heat recovery system.
| Priorities | Pins | Attributes |
|---|---|---|
| prio 1 | Heat recovery system - operating message | - |
| prio 2 | Heat recovery system - position | - |
| prio 3 | Heat recovery system - control signal | - |
| prio 4 | AHU is considered to operate without hrcs, because heat recovery system is not connected. | - |
Configuration air heater
The following table describes the pins and/or attributes that are required to determine the availability of an air heater.
| Priorities | Pins | Attributes |
|---|---|---|
| prio 1 | Air heater - operating message | - |
| prio 2 | Air heater - pump - operating message | - |
| prio 3 | Air heater - valve - position | - |
| prio 4 | Air heater - valve - control signal | - |
| prio 5 | - | Air heater - nominal thermal power |
| prio 6 | Heat energy savings will not be calculated, because air heater is not connected. | - |
Configuration air cooler
The following table describes the pins and/or attributes that are required to determine the availability of an air cooler.
| Priorities | Pins | Attributes |
|---|---|---|
| prio 1 | Air cooler - operating message | - |
| prio 2 | Air cooler - pump - operating message | - |
| prio 3 | Air cooler - valve - position | - |
| prio 4 | Air cooler - valve - control signal | - |
| prio 5 | - | Air cooler - nominal thermal power |
| prio 6 | Cold energy savings will not be calculated, because air cooler is not connected. | - |
Savings for electrical energy
| Priorities | Pins | Attributes |
|---|---|---|
| prio 1 | Total electrical energy | - |
| prio 2 | Total electrical power | - |
| prio 3.1 | Supply air fan - position or Supply air fan - control signal | Supply air fan - nominal power |
| prio 3.2 | - | Supply air fan - nominal power Supply air fan - Default speed |
| prio 4.1 | Supply air fan - volume flow Supply air fan - position or Supply air fan - control signal | Supply air fan - specific fan power |
| prio 4.2 | Supply air fan - volume flow | Supply air fan - Default speed Supply air fan - specific fan power |
| prio 5.1 | Supply air fan - position or Supply air fan - control signal | Supply air fan - nominal volume flow Supply air fan - specific fan power |
| prio 5.2 | - | Supply air fan - nominal volume flow Supply air fan - Default speed Supply air fan - specific fan power |
| prio 6 | Electrical energy savings will not be calculated, because information is missing. | - |
Savings for thermal energy
To calculate the thermal savings potential, information about the supply air volume flow is required. The following table describes the pins and/or attributes that are required to determine the supply air volume flow.
| Priorities | Pins | Attributes |
|---|---|---|
| prio 1 | Supply air fan - volume flow | - |
| prio 2.1 | Supply air fan - position or Supply air fan - control signal | Supply air fan - nominal volume flow |
| prio 2.2 | - | Supply air fan - nominal volume flow Supply air fan - Default speed |
| prio 3.1 | Supply air fan - position or Supply air fan - control signal | Supply air fan - nominal power Supply air fan - specific fan power |
| prio 3.2 | - | Supply air fan - nominal power Supply air fan - Default speed Supply air fan - specific fan power |
| prio 4 | Thermal energy savings will not be calculated, because information is missing. | - |
In addition, the calculation of the thermal savings - heat requires the following attributes:
- Supply temperature winter case
- Exhaust temperature winter case
- Heat recovery system active during heating
- Heat recovery system efficiency
In addition, the calculation of the thermal savings - cold requires the following attributes:
- Supply temperature summer case
- Exhaust temperature summer case
- Heat recovery system active during cooling
- Heat recovery system efficiency
| Pin | Required | Mapping info | Unit |
|---|---|---|---|
| Supply air fan - operating message | No | If not available, you can use "pressure difference", "speed" or "volume flow" to estimate the operating message. | - |
| Supply air fan - pressure | No | Alternative to estimate the operating message. Activity threshold: 30 Pa. | Pa |
| Supply air fan - position | No | Alternative to estimate the operating message. Activity threshold: > 5 %. | % |
| Supply air fan - control signal | No | Alternative source for the supply air fan - position. Activity threshold: > 5 %. | % |
| Supply air fan - volume flow | No | Alternative to estimate the operating message. Activity threshold: 10 m3/h. | m3/h |
| Return air fan - operating message | No | If not available use corresponding pin "Pressure difference" to determine the opration of the exhaust fan. | - |
| Return air fan - pressure | No | Alternative to estimate the operating message. Activity threshold: 30 Pa. | Pa |
| Return air fan - position | No | Alternative to estimate the operating message. Activity threshold: > 5 %. | % |
| Return air fan - control signal | No | Alternative source for the return air fan - position. Activity threshold: > 5 %. | % |
| Return air fan - volume flow | No | Alternative to estimate the operating message. Activity threshold: 10 m3/h. | m3/h |
| AI controls active | No | Timeseries that is used to exclude .controls app operating times from the analysis | - |
| Air heater - operating message | No | If not available, you can use "pump - operating message", "valve position" or "valve control signal" to estimate the operating message. | - |
| Air heater - pump - operating message | No | Alternative to the operating message | - |
| Air heater - valve - position | No | Alternative to estimate the operating message. Activity threshold: 5 %. | % |
| Air heater - valve - control signal | No | Alternative to estimate the operating message. Activity threshold: 5 %. | % |
| Air cooler - operating message | No | If not available, you can use "pump - operating message", "valve position" or "valve control signal" to estimate the operating message. | - |
| Air cooler - pump - operating message | No | Alternative to the operating message | - |
| Air cooler - valve - position | No | Alternative to estimate the operating message. Activity threshold: 5 %. | % |
| Air cooler - valve - control signal | No | Alternative to estimate the operating message. Activity threshold: 5 %. | % |
| Heat recovery system - operating message | No | If not available, the hrcs position or control signal is used | - |
| Heat recovery system - position | No | Alternative to estimate the operating message. Activity threshold: 10 % | % |
| Heat recovery system - control signal | No | Alternative to estimate the operating message. Activity threshold: 10 % | % |
| Outside air temperature | No | Outside air temperature (AHU), Outside air temperature (weather station) | °C |
| Supply air temperature | No | - | °C |
| Supply air temperature after heat recovery system | No | - | °C |
| Return air temperature | No | - | °C |
| Total electrical energy | No | - | kWh |
| Total electrical power | No | Timeseries is used to calculated the consumed energy during the analysis period | kW |
| Total heating energy | No | - | kWh |
| Total heating power | No | Timeseries is used to calculated the consumed energy during the analysis period | kW |
| Total cooling energy | No | - | kWh |
| Total cooling power | No | Timeseries is used to calculated the consumed energy during the analysis period | kW |
| Attribute | Required | Mapping info | Unit |
|---|---|---|---|
| Air cooler - nominal thermal power | No | Nominal cooling power of the air cooler | kW |
| Air heater - nominal thermal power | No | Nominal heating power of the air cooler | kW |
| CO2 emission factor cold | No | CO2 emission factor for cold energy. Default: 0.3 kg/kWh | kg/kWh |
| CO2 emission factor electricity | No | CO2 emission factor for electric energy. Default: 0.56 kg/kWh | kg/kWh |
| CO2 emission factor heat | No | CO2 emission factor for heat energy. Default: 0.36 kg/kWh | kg/kWh |
| Cold price | No | Price of cold energy. Default: 0.1 €/kWh | €/kWh |
| Electricity price | No | Price of electric energy. Default: 0.25 €/kWh | €/kWh |
| Heat price | No | Price of heat energy. Default: 0.15 €/kWh | €/kWh |
| Heat recovery system active during cooling | No | "True" if the heat recovery system is active during cooling (Summer), "False" if it is not active during cooling. Default: False | - |
| Heat recovery system active during heating | No | "True" if the heat recovery system is active during heating (Winter), "False" if it is not active during heating. Default: True | - |
| Heat recovery system efficiency | No | Range: 0-1. Default: 0.75 | - |
| Regional holiday key | No | Adds regional holidays where operation is not intended to the schedule. Localization by regional keys from ISO 3166-2. Default: DE | - |
| Return air fan - Default speed | No | Default fan speed used when speed pin is not connected. Default: 90%. Range: 0-100% | % |
| Return air fan - nominal power | No | Nominal electrical power of the return fan | kW |
| Return air fan - nominal volume flow | No | Nominal volume flow of return fan | m3/h |
| Return air fan - specific fan power | No | Quantifies the energy-efficiency of fan. Default: 2000 Ws/m3 | Ws/m3 |
| Return air temperature summer case | No | Typical temperature of return air in the summer. Default: 24°C | °C |
| Return air temperature winter case | No | Typical temperature of return air in the winter. Default: 21°C | °C |
| Schedule | Yes | Weekly schedule of the AHU | - |
| Schedule timezone | No | The project location is used to automatically determine the timezone. Default: Europe/Berlin | - |
| Supply air fan - Default speed | No | Default: 90%. Range: 0-100% | % |
| Supply air fan - nominal power | No | Nominal electrical power of the supply fan | kW |
| Supply air fan - nominal volume flow | No | Nominal volume flow of supply fan | m3/h |
| Supply air fan - specific fan power | No | Quantifies the energy-efficiency of the supply fan. Default: 2000 Ws/m3 | Ws/m3 |
| Supply temperature summer case | No | Typical temperature of supply air in the summer. Default: 24°C | °C |
| Supply temperature winter case | No | Typical temperature of supply air in the winter. Default: 21°C | °C |
Check out Where prices and emission factors come from for Energy price and CO2 emission factor sources and priorities.
| Pin | Required | Mapping info | Unit |
|---|---|---|---|
| Rate of fuel consumption | No | Necessary for economic KPIs, accuracy level "High". | kW |
| Heat flow | No | Necessary for economic KPIs, accuracy level "Medium". | kW |
| Operating message | Yes | - | - |
| Attribute | Required | Mapping info | Unit |
|---|---|---|---|
| Custom day schedules | No | Deprecated | - |
| Custom holiday | No | Deprecated | - |
| Efficiency | No | Necessary for economic KPIs, accuracy levels "Medium" and "Low". Default: 0.915 | - |
| Fuel price | No | Necessary for economic KPIs, all accuracy levels. Default: 0.06 €/kWh | €/kWh |
| Nominal heat production | No | Necessary for economic KPIs, accuracy level "Low". Default: None | kW |
| Pre-conditioning period | No | Deprecated | min |
| Regional key | No | Deprecated | - |
| Schedule | Yes | - | - |
| Schedule timezone | No | The project location is used to automatically determine the timezone. Default: Europe/Berlin | - |
| Shutdown flexibility | No | Deprecated | min |
| Pin | Required | Mapping info | Unit |
|---|---|---|---|
| Fuel power | No | Necessary for economic KPIs, accuracy level "High". | kW |
| Generator power | No | Necessary for economic KPIs, accuracy level "Medium". | kW |
| Heat flow | No | Necessary for economic KPIs, accuracy level "Medium". | kW |
| Operating message | Yes | - | - |
| Attribute | Required | Mapping info | Unit |
|---|---|---|---|
| Custom day schedules | No | Deprecated | - |
| Custom holiday | No | Deprecated | - |
| Fuel price | No | Necessary for economic KPIs, all accuracy levels. Default: 0.06 €/kWh | €/kWh |
| Fuel utilization factor | No | Necessary for economic KPIs, accuracy levels "Medium" and "Low". Default: 0.87 | - |
| Generator nominal power | No | Necessary for economic KPIs, accuracy level "Low". Default: None | kW |
| Nominal heat production | No | Necessary for economic KPIs, accuracy level "Low". Default: None | kW |
| Pre-conditioning period | No | Deprecated | min |
| Regionalkey | No | - | - |
| Schedule | Yes | - | - |
| Schedule timezone | No | The project location is used to automatically determine the timezone. Default: Europe/Berlin | - |
| Shutdown flexibility | No | Deprecated | min |
| Pin | Required | Mapping info | Unit |
|---|---|---|---|
| Electrical power | No | Necessary for economic KPIs, accuracy level "High". | kW |
| Operating message | No | If not available use pin "Pressure difference" to determine the opration of the fan. | |
| Pressure difference | No | Pressure difference over the fan. Used as operating message when "Operating message" is not connected. Activity threshold: 30 Pa. | Pa |
| Speed | No | Necessary for economic KPIs, accuracy level "Medium". | % |
| Attribute | Required | Mapping info | Unit |
|---|---|---|---|
| Custom day schedules | No | Deprecated | - |
| Custom holiday | No | Deprecated | - |
| Electricity price | No | Necessary for Economic KPIs, all accuracy levels. Default: 0.18 €/kWh | €/kWh |
| Nominal power consumption | No | Necessary for Economic KPIs, accuracy levels "Medium" and "Low". Default: None | kW |
| Nominal volume flow | No | Second option for Economic KPIs, accuracy level "Low". Default: None | m3/h |
| Pre-conditioning period | No | Deprecated | min |
| Regional key | No | Deprecated | - |
| Schedule | Yes | - | - |
| Schedule timezone | No | The project location is used to automatically determine the timezone. Default: Europe/Berlin | - |
| Shutdown flexibility | No | Deprecated | min |
| Specific fan power | No | Second option for Economic KPIs, accuracy level "Low". Default: 2000 | Ws/m3 |
| Pin | Required | Mapping info | Unit |
|---|---|---|---|
| Condenser heat flow | No | Necessary for economic KPIs, accuracy level "Medium". | kW |
| Electrical power | No | Necessary for economic KPIs, accuracy level "High". | kW |
| Operating message | Yes | - | - |
| Attribute | Required | Mapping info | Unit |
|---|---|---|---|
| Custom day schedules | No | Deprecated | - |
| Custom holiday | No | Deprecated | - |
| Electricity price | No | Necessary for economic KPIs, all accuracy levels. Default: 0.18 €/kWh | €/kWh |
| Nominal heat production | No | Necessary for economic KPIs, accuracy level "Low". Default: None | kW |
| Pre-conditioning period | No | Deprecated | min |
| Regional key | No | Deprecated | - |
| Schedule | Yes | - | - |
| Schedule timezone | No | The project location is used to automatically determine the timezone. Default: Europe/Berlin | - |
| Shutdown flexibility | No | Deprecated | min |
| Pin | Required | Mapping info |
|---|---|---|
| Operating message | No | Mapping of either operating message (preferred) or pump - operating message is mandatory. If both pins are mapped, operating message is used |
| Pump - operating message | No | Mapping of either operating message (preferred) or pump - operating message is mandatory. If both pins are mapped, operating message is used |
| Attribute | Required | Mapping info | Unit |
|---|---|---|---|
| Custom day schedules | No | Deprecated | - |
| Custom holiday | No | Deprecated | - |
| Pre-conditioning period | No | Deprecated | min |
| Regional key | No | Deprecated | - |
| Schedule | Yes | - | - |
| Schedule timezone | No | The project location is used to automatically determine the timezone. Default: Europe/Berlin | - |
| Shutdown flexibility | No | Deprecated | min |
Applying a schedule analysis on rooms is recommended to check for a scheduled room control operation. Utilize the reduced load analysis if a scheduled load reduction of heating or cooling utilities shall be analyzed.
| Pin | Required | Mapping info |
|---|---|---|
| Operating message | Yes | - |
| Attribute | Required | Mapping info | Unit |
|---|---|---|---|
| Custom day schedules | No | Deprecated | - |
| Custom holiday | No | Deprecated | - |
| Pre-conditioning period | No | Deprecated | min |
| Regional key | No | Deprecated | - |
| Schedule | Yes | - | - |
| Schedule timezone | No | The project location is used to automatically determine the timezone. Default: Europe/Berlin | - |
| Shutdown flexibility | No | Deprecated | min |
Recommend Time Span
1 week
Recommended Repetition
Every week
- After adjustment of usage times of the analyzed component
- After changes of operational modes, e.g., transfers to heating mode
- After changes in the control system
- After maintenance or replacements
Sensor Functionality
The Sensor Functionality analysis uses the time series data of the sensor to detect irregularities of observations. This implies manual overwriting of the sensor values, constant observations for expected volatile trajectories of the data points' observations, and also value plausibility checks by types of sensors.
Value
- Confirm normal operation of sensors
- Identify faulty measurement setups inside your building automation system
- Detection of permanently manual overwritten sensors causing permanent manipulation of control loop
Recommended for components
Any component with sensors measuring physical quantities.
Checked conditions
- Measurements of a sensor lie within a reasonable range
- Detects constant observation for sensors which expect volatile trajectories
For this example we are looking at a temperature sensor for the room air temperature, that is connected to a component "room". The KPIs are generated according to the mapped pins. For this setup we mapped a datapoint to pin "temperature", thus the result contains the three KPIs listed below.
The room temperature is measured by the sensor with values above the plausibility limit of 40 °C. The KPI "pin.temperature.above high limit = 1" indicates that the measured values do not lie within a reasonable range for room temperatures.
If any of the KPIs have the boolean value of 1, a faulty sensor is detected and the signal color red is returned to alarm. A detected fault can be caused by various reasons ranging from manually overwritten sensors over a faulty sensor to a wrong configured measurement system.
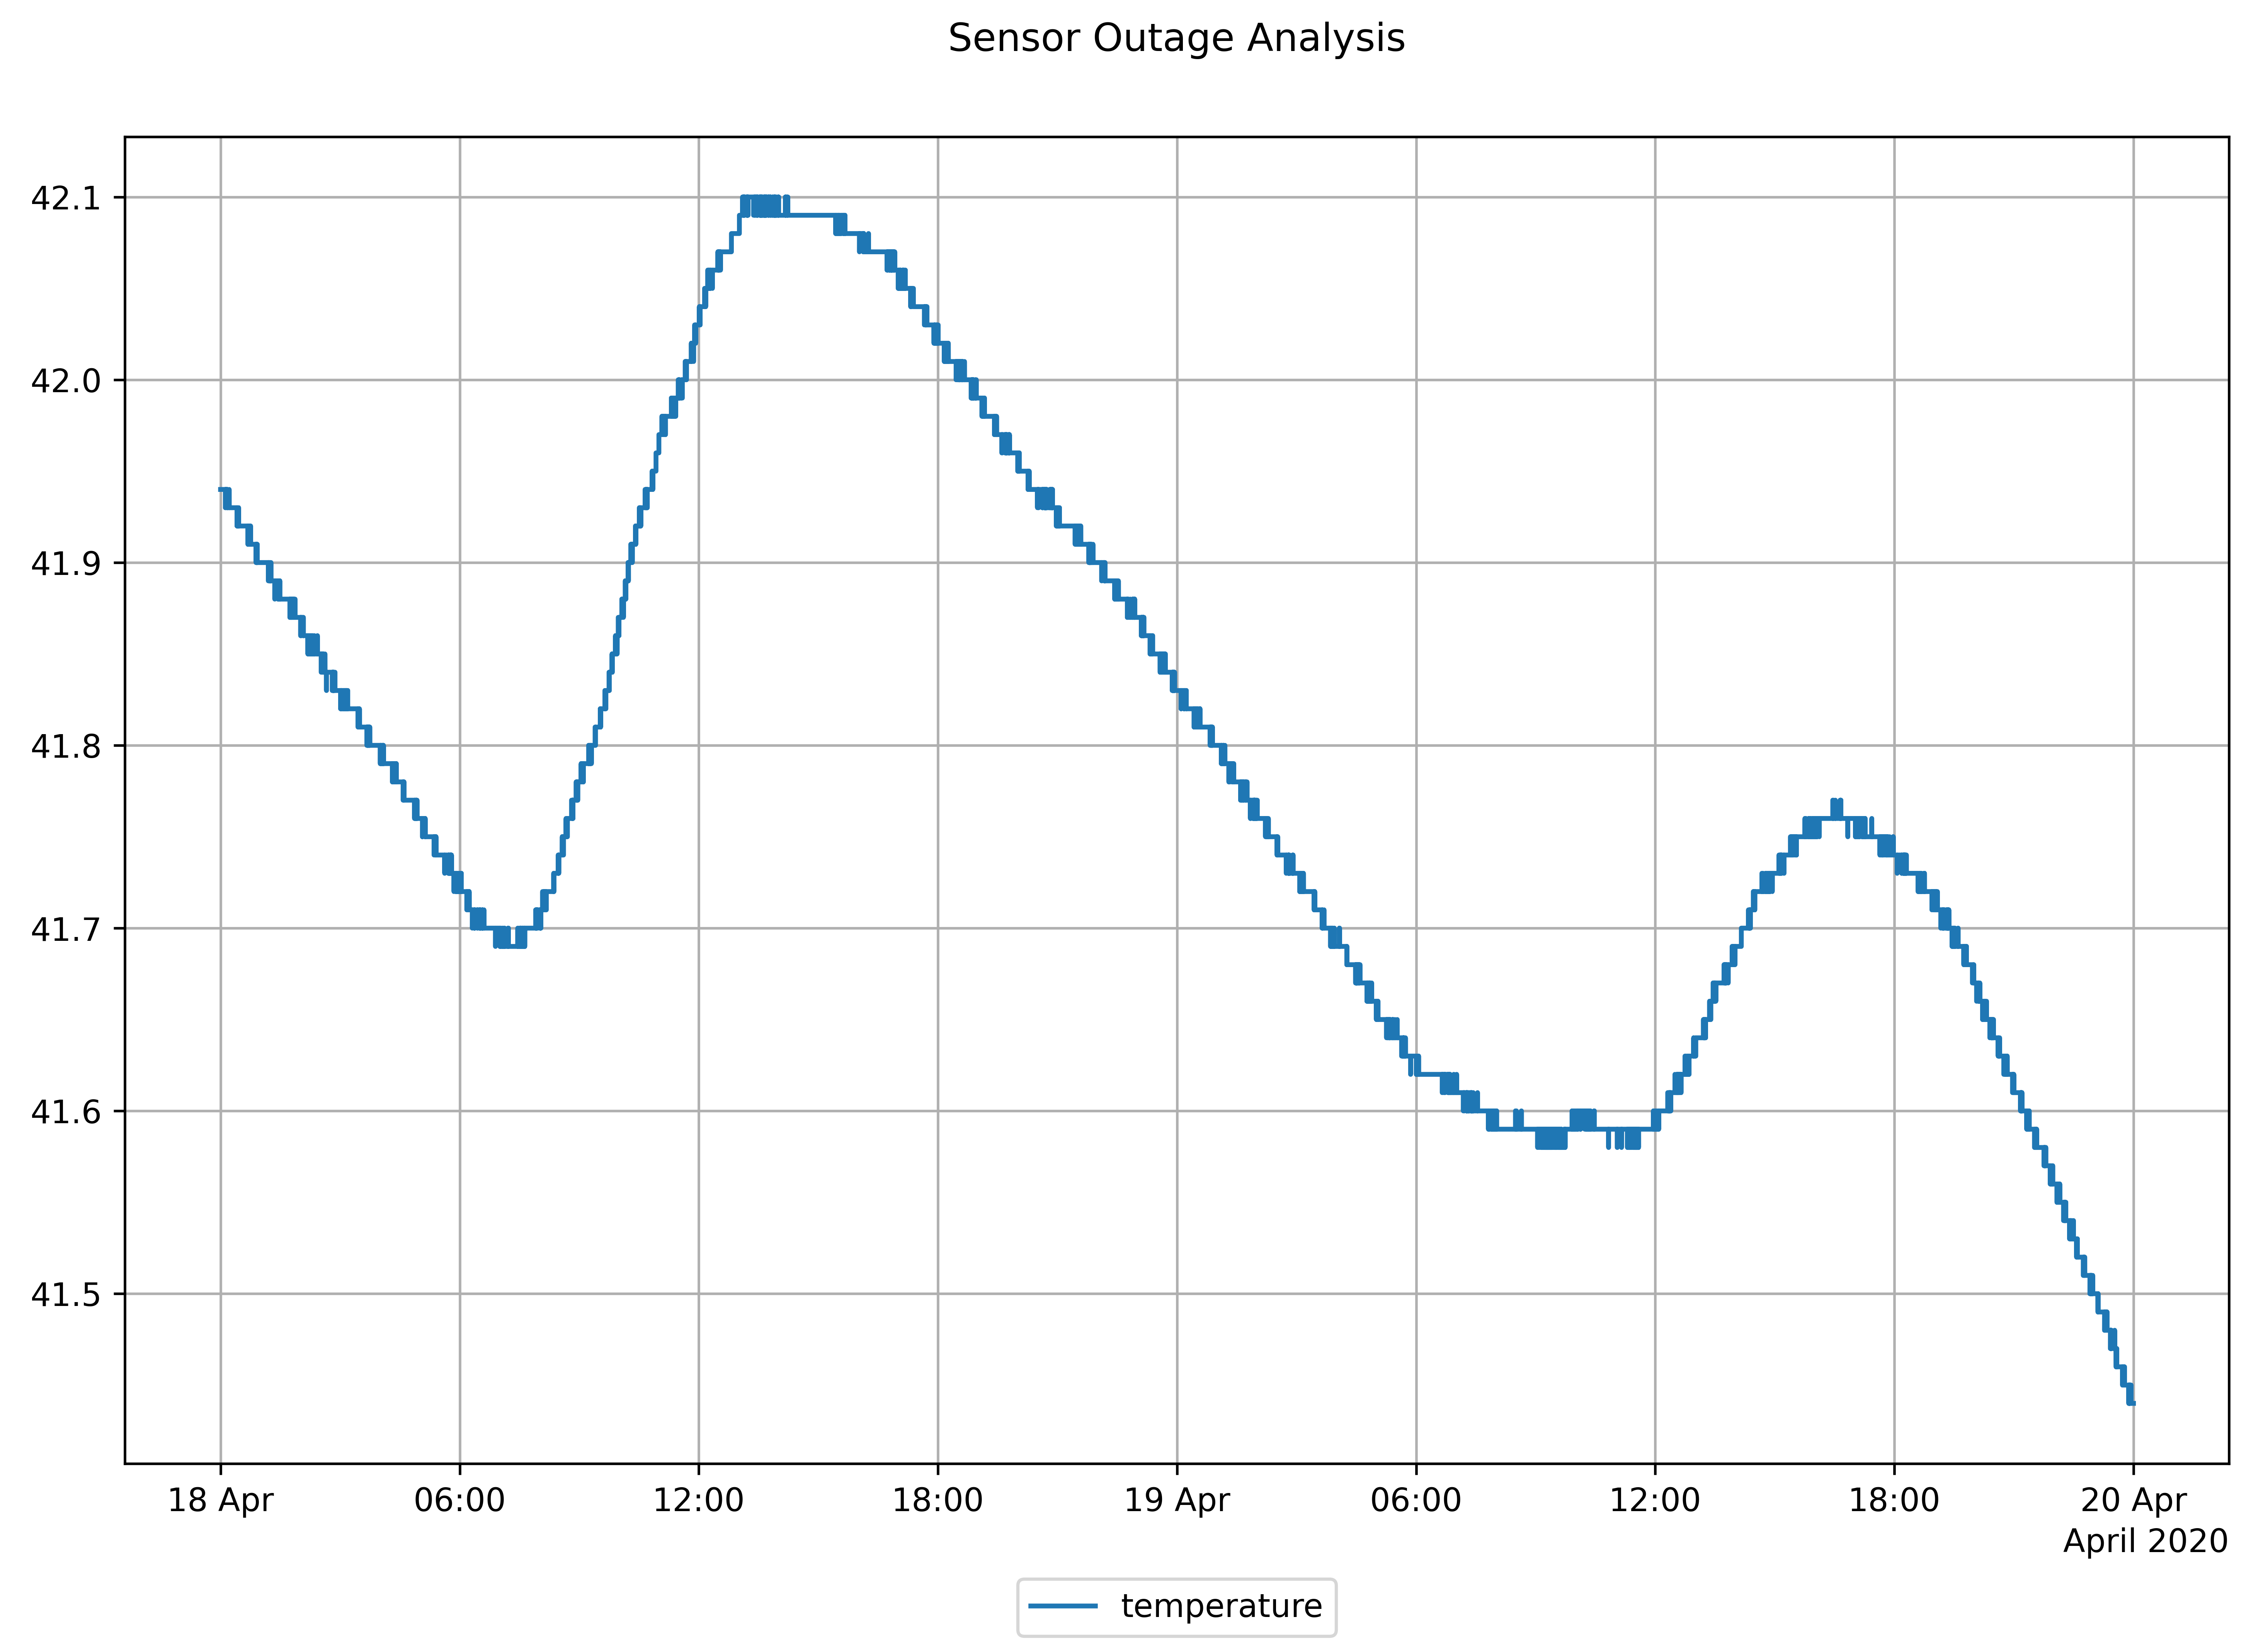
Figure 1: Room air temperature over a two day period
| KPI | Value | Unit |
|---|---|---|
| pin.temperature.below low limit | No | binary |
| pin.temperature.above high limit | Yes | binary |
| pin.temperature.faulty | No | binary |
Signal colors
| Signal color | Available | Info |
|---|---|---|
| red | Yes | One or more sensors must be checked and at least one is part of a control loop. |
| yellow | Yes | One or more sensors must be checked. |
| green | Yes | No faulty sensors detected. |
Interpretations
| Available | Info |
|---|---|
| Yes | Faulty sensors or plausible observations detected. |
Recommendations
| Available | Info |
|---|---|
| Yes | Recommendations to correct the reason for the sensor fault. |
KPIs
PIN_NAME refers to the actual pin on the component that the KPI belongs to.
| KPI Identifier | Info | Value Range | Unit |
|---|---|---|---|
| pin.<PIN NAME>.datatype | Indicator of Pin datatype | analog, digital | - |
| pin.<PIN NAME>.below low limit | Time Series values of pin "PIN_NAME" below low limit 0 = observations in plausible range 1 = observations below lowest plausible value detected | Yes, No | binary |
| pin.<PIN NAME>.above high limit | Time Series values of pin "PIN_NAME" above high limit 0 = observations in plausible range 1 = observations above highest plausible value detected | Yes, No | binary |
Sensor Fault
For all valve positions the value 0 is not a fault and will be detected as no fault.
| KPI Identifier | Info | Value Range | Unit |
|---|---|---|---|
| pin.<PIN NAME>.faulty | Sensor of pin "PIN_NAME" below low limit | Yes, No | binary |
Additional KPIs for Digital Pins
| KPI Identifier | Info | Value Range | Unit |
|---|---|---|---|
| pin.<PIN NAME>.contains not allowed values | Indicator if time series on pin contains only values of 0 or 1 | Yes, No | binary |
| Pin | Required | Mapping info |
|---|---|---|
| Alarm message | No | Not checked for faults datatype: digital no limit defined |
| Cooling energy - water side | No | Not checked for faults datatype: analog low limit = 0 high limit not set |
| Cooling power - water side | No | Checked for faults datatype: analog low limit = 0 high limit not set |
| Inlet air temperature | No | Checked for faults datatype: analog low limit = -50 high limit = 50 |
| Operating message | No | Not checked for faults datatype: digital no limit defined |
| Outdoor air temperature | No | Checked for faults datatype: analog low limit = -50 high limit = 50 |
| Outlet air temperature | No | Checked for faults datatype: analog low limit = -50 high limit = 100 |
| Pump - control signal | No | Not checked for faults datatype: analog no limit defined |
| Pump - operating message | No | Not checked for faults datatype: digital no limit defined |
| Return temperature - water side | No | Checked for faults datatype: analog low limit = -10 high limit = 150 |
| Supply temperature - water side | No | Checked for faults datatype: analog low limit = -10 high limit = 150 |
| Valve - control signal | No | Not checked for faults datatype: analog no limit defined |
| Valve - position | No | Checked for faults datatype: analog low limit = 0 high limit = 100 |
| Volume flow - ventilation side | No | Not checked for faults datatype: analog no limit defined |
| Volume flow - water side | No | Not checked for faults datatype: analog low limit = 0 high limit not set |
| Pin | Required | Mapping info |
|---|---|---|
| AI controls active | No | Not checked for faults datatype: analog no limit defined |
| Air cooler - operating message | No | Not checked for faults datatype: digital no limit defined |
| Air cooler - pump - operating message | No | Not checked for faults datatype: digital no limit defined |
| Air cooler - valve - control signal | No | Not checked for faults datatype: analog low limit = 0 high limit = 100 |
| Air cooler - valve - position | No | Checked for faults datatype: analog low limit = 0 high limit = 100 |
| Air cooler - water return temperature | No | Checked for faults datatype: analog no limit defined |
| Air cooler - water supply temperature | No | Checked for faults datatype: analog no limit defined |
| Air heater - operating message | No | Not checked for faults datatype: digital no limit defined |
| Air heater - pump - operating message | No | Not checked for faults datatype: digital no limit defined |
| Air heater - valve - control signal | No | Not checked for faults datatype: analog low limit = 0 high limit = 100 |
| Air heater - valve - position | No | Checked for faults datatype: analog low limit = 0 high limit = 100 |
| Air heater - water return temperature | No | Checked for faults datatype: analog no limit defined |
| Air heater - water supply temperature | No | Checked for faults datatype: analog no limit defined |
| Air re-heater - minimal water return temperature | No | Checked for faults datatype: analog no limit defined |
| Air re-heater - operating message | No | Not checked for faults datatype: digital no limit defined |
| Air re-heater - pump - operating message | No | Not checked for faults datatype: digital no limit defined |
| Air re-heater - valve - control signal | No | Not checked for faults datatype: analog low limit = 0 high limit = 100 |
| Air re-heater - valve - position | No | Checked for faults datatype: analog low limit = 0 high limit = 100 |
| Air re-heater - water return temperature | No | Checked for faults datatype: analog no limit defined |
| Air re-heater - water supply temperature | No | Checked for faults datatype: analog no limit defined |
| Alarm message | No | Not checked for faults datatype: digital no limit defined |
| Exhaust air temperature | No | Checked for faults datatype: analog no limit defined |
| Exhaust duct pressure | No | Checked for faults datatype: analog low limit = -50 high limit = 2000 |
| Exhaust duct pressure setpoint | No | Not checked for faults datatype: analog low limit = -50 high limit = 2000 |
| Exhaust humidifier - operating message | No | Not checked for faults datatype: digital no limit defined |
| Filter - alarm message | No | Not checked for faults datatype: digital no limit defined |
| Fresh air temperature | No | Checked for faults datatype: analog low limit = -50 high limit = 60 |
| Heat recovery system - operating message | No | Not checked for faults datatype: digital no limit defined |
| Heat recovery system - position | No | Not checked for faults datatype: analog no limit defined |
| Heat recovery system - control signal | No | Not checked for faults datatype: analog no limit defined |
| Main switching command | No | Not checked for faults datatype: analog no limit defined |
| Operating message | No | Not checked for faults datatype: digital no limit defined |
| Outside air relative humidity | No | Checked for faults datatype: analog low limit = 0 high limit = 100 |
| Outside air temperature (weather station) | No | Checked for faults datatype: analog low limit = -50 high limit = 60 |
| Recirculation damper - control signal | No | Not checked for faults datatype: analog low limit = 0 high limit = 100 |
| Recirculation damper - position | No | Not checked for faults datatype: analog low limit = 0 high limit = 100 |
| Return air fan - electrical power | No | Checked for faults datatype: analog low limit = 0 high limit not set |
| Return air fan - operating message | No | Not checked for faults datatype: digital no limit defined |
| Return air fan - pressure | No | Checked for faults datatype: analog low limit = -20 high limit = 2000 |
| Return air fan - pressure setpoint | No | Not checked for faults datatype: analog low limit = -20 high limit = 2000 |
| Return air fan - position | No | Not checked for faults datatype: analog low limit = 0 high limit = 100 |
| Return air fan - volume flow | No | Not checked for faults datatype: analog no limit defined |
| Return air temperature | No | Checked for faults datatype: analog low limit = -5 high limit = 80 |
| Return air temperature setpoint | No | Not checked for faults datatype: analog low limit = -5 high limit = 80 |
| Return air temperature setpoint maximum | No | Not checked for faults datatype: analog no limit defined |
| Return air temperature setpoint minimum | No | Not checked for faults datatype: analog no limit defined |
| Supply air fan - electrical power | No | Checked for faults datatype: analog low limit = 0 high limit not set |
| Supply air fan - operating message | No | Not checked for faults datatype: digital no limit defined |
| Supply air fan - pressure | No | Checked for faults datatype: analog low limit = -20 high limit = 2000 |
| Supply air fan - pressure setpoint | No | Not checked for faults datatype: analog low limit = -20 high limit = 2000 |
| Supply air fan - position | No | Not checked for faults datatype: analog low limit = 0 high limit = 100 |
| Supply air fan - volume flow | No | Not checked for faults datatype: analog no limit defined |
| Supply air relative humidity | No | Checked for faults datatype: analog low limit = 0 high limit = 100 |
| Supply air temperature | No | Checked for faults datatype: analog low limit = -5 high limit = 40 |
| Supply air temperature after heat recovery system | No | Checked for faults datatype: analog low limit = -5 high limit = 60 |
| Supply air temperature setpoint | No | Not checked for faults datatype: analog low limit = 0 high limit = 40 |
| Supply air temperature setpoint maximum | No | Not checked for faults datatype: analog low limit = -20 high limit = 80 |
| Supply air temperature setpoint minimum | No | Not checked for faults datatype: analog low limit = -20 high limit = 80 |
| Supply duct pressure | No | Checked for faults datatype: analog low limit = -20 high limit = 2000 |
| Supply duct pressure setpoint | No | Not checked for faults datatype: analog low limit = -20 high limit = 2000 |
| Supply humidifier - operating message | No | Not checked for faults datatype: digital no limit defined |
| Total cooling energy | No | Not checked for faults datatype: analog low limit = 0 high limit not set |
| Total cooling power | No | Checked for faults datatype: analog low limit = 0 high limit not set |
| Total electrical energy | No | Not checked for faults datatype: analog low limit = 0 high limit not set |
| Total electrical power | No | Checked for faults datatype: analog low limit = 0 high limit not set |
| Total heating energy | No | Not checked for faults datatype: analog low limit = 0 high limit not set |
| Total heating power | No | Checked for faults datatype: analog low limit = 0 high limit not set |
| Pin | Required | Mapping info |
|---|---|---|
| Alarm message | No | Not checked for faults datatype: digital no limit defined |
| Heating energy - water side | No | Not checked for faults datatype: analog low limit = 0 high limit not set |
| Heating power - water side | No | Checked for faults datatype: analog low limit = 0 high limit not set |
| Inlet air temperature | No | Checked for faults datatype: analog low limit = -50 high limit = 50 |
| Operating message | No | Not checked for faults datatype: digital no limit defined |
| Outdoor air temperature | No | Checked for faults datatype: analog low limit = -50 high limit = 50 |
| Outlet air temperature | No | Checked for faults datatype: analog low limit = -50 high limit = 100 |
| Pump - control signal | No | Not checked for faults datatype: analog no limit defined |
| Pump - operating message | No | Not checked for faults datatype: digital no limit defined |
| Return temperature - water side | No | Checked for faults datatype: analog low limit = -10 high limit = 150 |
| Supply temperature - water side | No | Checked for faults datatype: analog low limit = -10 high limit = 150 |
| Valve - control signal | No | Not checked for faults datatype: analog no limit defined |
| Valve - position | No | Checked for faults datatype: analog low limit = 0 high limit = 100 |
| Volume flow - ventilation side | No | Not checked for faults datatype: analog no limit defined |
| Volume flow - water side | No | Checked for faults datatype: analog low limit = 0 high limit not set |
| Pin | Required | Mapping info |
|---|---|---|
| Alarm message | No | Not checked for faults datatype: digital no limit defined |
| Burner - Control signal | No | Not checked for faults datatype: analog low limit = 0 high limit = 100 |
| Burner - Position | No | Checked for faults datatype: analog low limit = 0 high limit = 100 |
| Heating energy | No | Not checked for faults datatype: analog no limit defined |
| Heating power | No | Checked for faults datatype: analog no limit defined |
| Main switching command | No | Not checked for faults datatype: analog no limit defined |
| Operating hours | No | Not checked for faults datatype: analog low limit = 0 high limit not set |
| Operating message | No | Not checked for faults datatype: digital no limit defined |
| Outdoor air temperature | No | Checked for faults datatype: analog no limit defined |
| Outdoor air temperature overwrite | No | Checked for faults datatype: analog no limit defined |
| Pump - control signal | No | Not checked for faults datatype: analog no limit defined |
| Pump - operating message | No | Not checked for faults datatype: digital no limit defined |
| Rate of fuel consumption | No | Not checked for faults datatype: analog no limit defined |
| Return temperature | No | Checked for faults datatype: analog low limit = 1 high limit = 150 |
| Return temperature upper limit | No | Checked for faults datatype: analog low limit = 1 high limit = 150 |
| Supply temperature | No | Checked for faults datatype: analog low limit = 1 high limit = 150 |
| Supply temperature setpoint | No | Not checked for faults datatype: analog no limit defined |
| Valve - Control signal | No | Not checked for faults datatype: analog low limit = 0 high limit = 100 |
| Valve - Position | No | Checked for faults datatype: analog low limit = 0 high limit = 100 |
| Volume flow | No | Not checked for faults datatype: analog no limit defined |
| Pin | Required | Mapping info |
|---|---|---|
| CO2 emission factor | No | Not checked for faults datatype: analog no limit defined |
| Cold price | No | Not checked for faults datatype: analog no limit defined |
| Cooling energy | No | Not checked for faults datatype: analog no limit defined |
| Cooling power | No | Checked for faults datatype: analog no limit defined |
| Return temperature | No | Checked for faults datatype: analog low limit = 1 high limit = 100 |
| Supply temperature | No | Checked for faults datatype: analog low limit = 1 high limit = 100 |
| Volume flow | No | Not checked for faults datatype: analog no limit defined |
| Pin | Required | Mapping info |
|---|---|---|
| Alarm message | No | Not checked for faults datatype: digital no limit defined |
| Generator power | No | Checked for faults datatype: analog no limit defined |
| Heating energy | No | Not checked for faults datatype: analog no limit defined |
| Heating power | No | Checked for faults datatype: analog no limit defined |
| Operating message | No | Not checked for faults datatype: digital no limit defined |
| Outdoor air temperature | No | Checked for faults datatype: analog no limit defined |
| Pump - control signal | No | Not checked for faults datatype: analog no limit defined |
| Pump - operating message | No | Not checked for faults datatype: digital no limit defined |
| Rate of fuel consumption | No | Not checked for faults datatype: analog no limit defined |
| Return temperature | No | Checked for faults datatype: analog low limit = 1 high limit = 150 |
| Supply temperature | No | Checked for faults datatype: analog low limit = 1 high limit = 150 |
| Supply temperature setpoint | No | Not checked for faults datatype: analog no limit defined |
| Volume flow | No | Not checked for faults datatype: analog no limit defined |
| Pin | Required | Mapping info |
|---|---|---|
| Alarm message | No | Not checked for faults datatype: digital no limit defined |
| Cooling energy - evaporator | No | Not checked for faults datatype: analog low limit = 0 high limit not set |
| Cooling power - evaporator | No | Checked for faults datatype: analog low limit = 0 high limit not set |
| Electrical power | No | Checked for faults datatype: analog low limit = 0 high limit not set |
| Inlet temperature - condenser | No | Checked for faults datatype: analog low limit = -50 high limit = 150 |
| Inlet temperature - evaporator | No | Checked for faults datatype: analog low limit = -50 high limit = 150 |
| Operating hours | No | Not checked for faults datatype: analog low limit = 0 high limit not set |
| Operating message | No | Not checked for faults datatype: digital no limit defined |
| Condenser - pump - operating message | No | Not checked for faults datatype: digital no limit defined |
| Evaporator - pump - operating message | No | Not checked for faults datatype: digital no limit defined |
| Operating starts | No | Not checked for faults datatype: analog low limit = 0 high limit not set |
| Outdoor air temperature | No | Checked for faults datatype: analog low limit = -50 high limit = 50 |
| Outlet temperature - condenser | No | Checked for faults datatype: analog low limit = -50 high limit = 150 |
| Outlet temperature - evaporator | No | Checked for faults datatype: analog low limit = -50 high limit = 150 |
| Outlet temperature setpoint - condenser | No | Not checked for faults datatype: analog no limit defined |
| Outlet temperature setpoint - evaporator | No | Not checked for faults datatype: analog no limit defined |
| Condenser - Pump - control signal | No | Not checked for faults datatype: analog no limit defined |
| Evaporator - pump - control signal | No | Not checked for faults datatype: analog no limit defined |
| Volume flow - evaporator | No | Not checked for faults datatype: analog low limit = 0 high limit not set |
| Pin | Required | Mapping info |
|---|---|---|
| Alarm message | No | Not checked for faults datatype: digital no limit defined |
| Cold water temperature | No | Checked for faults datatype: analog no limit defined |
| Cooling energy | No | Not checked for faults datatype: analog low limit = 0 high limit not set |
| Cooling limit | No | Not checked for faults datatype: analog no limit defined |
| Cooling power | No | Checked for faults datatype: analog low limit = 0 high limit not set |
| Main switching command | No | Not checked for faults datatype: analog no limit defined |
| Operating message | No | Not checked for faults datatype: digital no limit defined |
| Operation mode | No | Not checked for faults datatype: analog no limit defined |
| Outdoor air temperature | No | Checked for faults datatype: analog low limit = -50 high limit = 50 |
| Pump - control signal | No | Not checked for faults datatype: analog no limit defined |
| Pump - operating message | No | Not checked for faults datatype: digital no limit defined |
| Return temperature | No | Checked for faults datatype: analog low limit = 1 high limit = 150 |
| Supply temperature | No | Checked for faults datatype: analog low limit = 1 high limit = 150 |
| Supply temperature setpoint | No | Not checked for faults datatype: analog no limit defined |
| Supply temperature setpoint maximum | No | Not checked for faults datatype: analog no limit defined |
| Supply temperature setpoint minimum | No | Not checked for faults datatype: analog no limit defined |
| Valve - control signal | No | Not checked for faults datatype: analog no limit defined |
| Valve - position | No | Checked for faults datatype: analog low limit = 0 high limit = 100 |
| Volume flow | No | Not checked for faults datatype: analog low limit = 0 high limit not set |
| Pin | Required | Mapping info |
|---|---|---|
| Active energy | No | Not checked for faults datatype: analog low limit = 0 high limit not set |
| Active power | No | Checked for faults datatype: analog low limit = 0 high limit not set |
| CO2 emission factor | No | Not checked for faults datatype: analog no limit defined |
| Electricity price | No | Not checked for faults datatype: analog no limit defined |
| Reactive energy | No | Not checked for faults datatype: analog low limit = 0 high limit not set |
| Reactive power | No | Checked for faults datatype: analog low limit = 0 high limit not set |
| Pin | Required | Mapping info |
|---|---|---|
| AI controls active | No | Not checked for faults datatype: analog no limit defined |
| Alarm message | No | Not checked for faults datatype: digital no limit defined |
| Electrical power | No | Checked for faults datatype: analog no limit defined |
| Operating message | No | Not checked for faults datatype: digital no limit defined |
| Pressure difference | No | Checked for faults datatype: analog no limit defined |
| Pressure difference setpoint | No | Not checked for faults datatype: analog no limit defined |
| Speed | No | Not checked for faults datatype: analog low limit = 0 high limit = 100 |
| Volume flow | No | Not checked for faults datatype: analog no limit defined |
| Pin | Required | Mapping info |
|---|---|---|
| Filter contamination | No | Not checked for faults datatype: analog no limit defined |
| Pressure difference | No | Checked for faults datatype: analog low limit = 0 high limit not set |
| Pin | Required | Mapping info |
|---|---|---|
| CO2 emission factor | No | Not checked for faults datatype: analog no limit defined |
| Fuel price | No | Not checked for faults datatype: analog no limit defined |
| Gas quantity | No | Not checked for faults datatype: analog low limit = 0 high limit not set |
| Volume flow | No | Not checked for faults datatype: analog low limit = 0 high limit not set |
| Pin | Required | Mapping info |
|---|---|---|
| CO2 emission factor | No | Not checked for faults datatype: analog no limit defined |
| Heat price | No | Not checked for faults datatype: analog no limit defined |
| Heating energy | No | Not checked for faults datatype: analog no limit defined |
| Heating power | No | Checked for faults datatype: analog no limit defined |
| Return temperature | No | Checked for faults datatype: analog low limit = 1 high limit = 150 |
| Supply temperature | No | Checked for faults datatype: analog low limit = 1 high limit = 150 |
| Volume flow | No | Not checked for faults datatype: analog no limit defined |
| Pin | Required | Mapping info |
|---|---|---|
| Alarm message | No | Not checked for faults datatype: digital no limit defined |
| Electrical power | No | Checked for faults datatype: analog no limit defined |
| Heating energy - condenser | No | Not checked for faults datatype: analog no limit defined |
| Heating energy - evaporator | No | Not checked for faults datatype: analog no limit defined |
| Heating power - condenser | No | Checked for faults datatype: analog no limit defined |
| Heating power - evaporator | No | Checked for faults datatype: analog no limit defined |
| Inlet temperature - condenser | No | Checked for faults datatype: analog low limit = -50 high limit = 150 |
| Inlet temperature - evaporator | No | Checked for faults datatype: analog low limit = -50 high limit = 150 |
| Main switching command | No | Not checked for faults datatype: analog no limit defined |
| Operating message | No | Not checked for faults datatype: digital no limit defined |
| Condenser - pump - operating message | No | Not checked for faults datatype: digital no limit defined |
| Evaporator - pump - operating message | No | Not checked for faults datatype: digital no limit defined |
| Outdoor air temperature | No | Checked for faults datatype: analog no limit defined |
| Outlet temperature - condenser | No | Checked for faults datatype: analog low limit = -50 high limit = 150 |
| Outlet temperature - evaporator | No | Checked for faults datatype: analog low limit = -50 high limit = 150 |
| Outlet temperature setpoint - condenser | No | Not checked for faults datatype: analog no limit defined |
| Outlet temperature setpoint - evaporator | No | Not checked for faults datatype: analog no limit defined |
| Condenser - Pump - control signal | No | Not checked for faults datatype: analog no limit defined |
| Evaporator - pump - control signal | No | Not checked for faults datatype: analog no limit defined |
| Volume flow - condenser | No | Not checked for faults datatype: analog no limit defined |
| Volume flow - evaporator | No | Not checked for faults datatype: analog no limit defined |
| Pin | Required | Mapping info |
|---|---|---|
| Alarm message | No | Not checked for faults datatype: digital no limit defined |
| Heating energy - primary | No | Not checked for faults datatype: analog low limit = 0 high limit not set |
| Heating power - primary | No | Checked for faults datatype: analog low limit = 0 high limit not set |
| Operating message | No | Not checked for faults datatype: digital no limit defined |
| Outdoor air temperature | No | Checked for faults datatype: analog low limit = -50 high limit = 50 |
| Secondary side - pump - control signal | No | Not checked for faults datatype: analog no limit defined |
| Secondary side - pump - operating message | No | Not checked for faults datatype: digital no limit defined |
| Return temperature - primary | No | Checked for faults datatype: analog low limit = 1 high limit = 150 |
| Return temperature - secondary | No | Checked for faults datatype: analog low limit = 1 high limit = 150 |
| Supply temperature - primary | No | Checked for faults datatype: analog low limit = 1 high limit = 150 |
| Supply temperature - secondary | No | Checked for faults datatype: analog low limit = 1 high limit = 150 |
| Supply temperature setpoint - secondary | No | Not checked for faults datatype: analog no limit defined |
| Primary side - valve - control signal | No | Not checked for faults datatype: analog no limit defined |
| Primary side - valve - position | No | Checked for faults datatype: analog low limit = 0 high limit = 100 |
| Secondary side - valve - position | No | Checked for faults datatype: analog low limit = 0 high limit = 100 |
| Valve - position - changeover valve | No | Checked for faults datatype: analog low limit = 0 high limit = 100 |
| Volume flow - primary | No | Not checked for faults datatype: analog low limit = 0 high limit not set |
| Pin | Required | Mapping info |
|---|---|---|
| Alarm message | No | Not checked for faults datatype: digital no limit defined |
| Heating energy | No | Not checked for faults datatype: analog no limit defined |
| Heating limit | No | Not checked for faults datatype: analog no limit defined |
| Heating power | No | Checked for faults datatype: analog no limit defined |
| Hot water temperature | No | Checked for faults datatype: analog no limit defined |
| Main switching command | No | Not checked for faults datatype: analog no limit defined |
| Operating message | No | Not checked for faults datatype: digital no limit defined |
| Operation mode | No | Not checked for faults datatype: analog no limit defined |
| Outdoor air temperature | No | Checked for faults datatype: analog low limit = -50 high limit = 50 |
| Pump - control signal | No | Not checked for faults datatype: analog no limit defined |
| Pump - operating message | No | Not checked for faults datatype: digital no limit defined |
| Return temperature | No | Checked for faults datatype: analog low limit = 1 high limit = 150 |
| Supply temperature | No | Checked for faults datatype: analog low limit = 1 high limit = 150 |
| Supply temperature setpoint | No | Not checked for faults datatype: analog no limit defined |
| Supply temperature setpoint maximum | No | Not checked for faults datatype: analog no limit defined |
| Supply temperature setpoint minimum | No | Not checked for faults datatype: analog no limit defined |
| Valve - control signal | No | Not checked for faults datatype: analog no limit defined |
| Valve - position | No | Checked for faults datatype: analog low limit = 0 high limit = 100 |
| Volume flow | No | Not checked for faults datatype: analog low limit = 0 high limit not set |
| Pin | Required | Mapping info |
|---|---|---|
| Charging side - Pump - Operating message | No | Not checked for faults datatype: digital no limit defined |
| Charging side - Return temperature | No | Checked for faults datatype: analog low limit = -10 high limit = 150 |
| Charging side - Supply temperature | No | Checked for faults datatype: analog low limit = -10 high limit = 150 |
| Charging side - Valve - Control signal | No | Not checked for faults datatype: analog low limit = 0 high limit = 100 |
| Charging side - Valve - Position | No | Checked for faults datatype: analog low limit = 0 high limit = 100 |
| Circulation side - Valve - Control signal | No | Not checked for faults datatype: analog low limit = 0 high limit = 100 |
| Circulation side - Valve - Position | No | Checked for faults datatype: analog low limit = 0 high limit = 100 |
| Circulation side - Pump - Operating message | No | Not checked for faults datatype: digital no limit defined |
| Circulation side - Return temperature | No | Checked for faults datatype: analog low limit = -10 high limit = 150 |
| Circulation side - Supply temperature | No | Checked for faults datatype: analog low limit = -10 high limit = 150 |
| Fresh water temperature | No | Checked for faults datatype: analog low limit = -10 high limit = 100 |
| Lower storage temperature | No | Checked for faults datatype: analog low limit = 0 high limit = 100 |
| Middle storage temperature | No | Checked for faults datatype: analog low limit = 0 high limit = 100 |
| Operating message | No | Not checked for faults datatype: digital no limit defined |
| Outside air temperature | No | Checked for faults datatype: analog low limit = -50 high limit = 50 |
| Upper storage temperature | No | Checked for faults datatype: analog low limit = 0 high limit = 100 |
| Pin | Required | Mapping info |
|---|---|---|
| Operating message | No | Not checked for faults datatype: digital no limit defined |
| Valve - position | No | Checked for faults datatype: analog low limit = 0 high limit = 100 |
| Pin | Required | Mapping info |
|---|---|---|
| Operating message | No | Not checked for faults datatype: digital no limit defined |
| Outside air relative humidity | No | Checked for faults datatype: analog low limit = 0 high limit = 100 |
| Outside air temperature | No | Checked for faults datatype: analog low limit = -50 high limit = 50 |
| Supply air relative humidity | No | Checked for faults datatype: analog low limit = 0 high limit = 100 |
| Supply air temperature | No | Checked for faults datatype: analog low limit = -20 high limit = 80 |
| Pin | Required | Mapping info |
|---|---|---|
| Alarm message | No | Not checked for faults datatype: digital no limit defined |
| Cool water temperature | No | Checked for faults datatype: analog low limit = 1 high limit = 150 |
| Cooling energy | No | Not checked for faults datatype: analog low limit = 0 high limit not set |
| Cooling limit | No | Checked for faults datatype: analog no limit defined |
| Cooling power | No | Checked for faults datatype: analog low limit = 0 high limit not set |
| Cooling circuit - Pump - Operating message | No | Not checked for faults datatype: digital no limit defined |
| Cooling circuit - Return temperature | No | Checked for faults datatype: analog low limit = 1 high limit = 150 |
| Cooling circuit - Supply temperature | No | Checked for faults datatype: analog low limit = 1 high limit = 150 |
| Cooling circuit - Supply temperature setpoint | No | Not checked for faults datatype: analog low limit = 1 high limit = 150 |
| Cooling circuit - Supply temperature setpoint maximum | No | Not checked for faults datatype: analog no limit defined |
| Cooling circuit - Supply temperature setpoint minimum | No | Not checked for faults datatype: analog no limit defined |
| Cooling circuit - Valve - Control signal | No | Not checked for faults datatype: analog low limit = 0 high limit = 100 |
| Cooling circuit - Valve - Position | No | Checked for faults datatype: analog low limit = 0 high limit = 100 |
| Cooling circuit - Volume flow | No | Not checked for faults datatype: analog no limit defined |
| Heating energy | No | Not checked for faults datatype: analog low limit = 0 high limit not set |
| Heating limit | No | Checked for faults datatype: analog no limit defined |
| Heating power | No | Checked for faults datatype: analog low limit = 0 high limit not set |
| Heating circuit - Pump - Operating message | No | Not checked for faults datatype: digital no limit defined |
| Heating circuit - Return temperature | No | Checked for faults datatype: analog low limit = 1 high limit = 150 |
| Heating circuit - Supply temperature | No | Checked for faults datatype: analog low limit = 1 high limit = 150 |
| Heating circuit - Supply temperature setpoint | No | Not checked for faults datatype: analog low limit = 1 high limit = 150 |
| Heating circuit - Supply temperature setpoint maximum | No | Not checked for faults datatype: analog no limit defined |
| Heating circuit - Supply temperature setpoint minimum | No | Not checked for faults datatype: analog no limit defined |
| Heating circuit - Valve - Control signal | No | Not checked for faults datatype: analog low limit = 0 high limit = 100 |
| Heating circuit - Valve - Position | No | Checked for faults datatype: analog low limit = 0 high limit = 100 |
| Heating circuit - Volume flow | No | Checked for faults datatype: analog no limit defined |
| Hot water temperature | No | Checked for faults datatype: analog low limit = 1 high limit = 150 |
| Main switching command | No | Not checked for faults datatype: analog no limit defined |
| Operating message | No | Not checked for faults datatype: digital no limit defined |
| Operation mode | No | Not checked for faults datatype: analog no limit defined |
| Outdoor air temperature | No | Checked for faults datatype: analog low limit = -20 high limit = 80 |
| Pump - Control signal | No | Not checked for faults datatype: analog no limit defined |
| Pump - Operating message | No | Not checked for faults datatype: digital no limit defined |
| Return temperature | No | Checked for faults datatype: analog low limit = 1 high limit = 150 |
| Supply temperature | No | Checked for faults datatype: analog low limit = 1 high limit = 150 |
| Supply temperature setpoint - Heating | No | Not checked for faults datatype: analog low limit = 1 high limit = 150 |
| Supply temperature setpoint - Cooling | No | Not checked for faults datatype: analog low limit = 1 high limit = 150 |
| Valve - Control signal | No | Not checked for faults datatype: analog low limit = 0 high limit = 100 |
| Valve - Position | No | Checked for faults datatype: analog low limit = 0 high limit = 100 |
| Pin | Required | Mapping info |
|---|---|---|
| Alarm message | No | Not checked for faults datatype: digital no limit defined |
| Cooling energy | No | Not checked for faults datatype: analog low limit = 0 high limit not set |
| Cooling power | No | Checked for faults datatype: analog low limit = 0 high limit not set |
| Electrical energy | No | Not checked for faults datatype: analog low limit = 0 high limit not set |
| Electrical power | No | Checked for faults datatype: analog low limit = 0 high limit not set |
| Operating message | No | Not checked for faults datatype: digital no limit defined |
| Operating message - fan | No | Not checked for faults datatype: digital no limit defined |
| Outdoor air temperature | No | Checked for faults datatype: analog low limit = -50 high limit = 50 |
| Return temperature | No | Checked for faults datatype: analog low limit = 0 high limit = 150 |
| Speed - fan | No | Not checked for faults datatype: analog no limit defined |
| Supply temperature | No | Checked for faults datatype: analog low limit = 0 high limit = 150 |
| Volume flow | No | Not checked for faults datatype: analog low limit = 0 high limit not set |
| Water quantity | No | Not checked for faults datatype: analog low limit = 0 high limit not set |
| Pin | Required | Mapping info |
|---|---|---|
| AI controls active | No | Not checked for faults datatype: analog no limit defined |
| Air cooler - Operating message | No | Not checked for faults datatype: digital no limit defined |
| Air cooler - Pump - Control signal | No | Not checked for faults datatype: analog low limit = 0 high limit = 100 |
| Air cooler - Pump - Operating message | No | Not checked for faults datatype: digital no limit defined |
| Air cooler - Pump - Position | No | Not checked for faults datatype: analog low limit = 0 high limit = 100 |
| Air cooler - Valve - Control signal | No | Not checked for faults datatype: analog low limit = 0 high limit = 100 |
| Air cooler - Valve - Position | No | Checked for faults datatype: analog low limit = 0 high limit = 100 |
| Air cooler - Water return temperature | No | Not checked for faults datatype: analog low limit = -10 high limit = 150 |
| Air cooler - Water supply temperature | No | Checked for faults datatype: analog low limit = -10 high limit = 150 |
| Air heater - Operating message | No | Not checked for faults datatype: digital no limit defined |
| Air heater - Pump - Control signal | No | Not checked for faults datatype: analog low limit = 0 high limit = 100 |
| Air heater - Pump - Operating message | No | Not checked for faults datatype: digital no limit defined |
| Air heater - Pump - Position | No | Not checked for faults datatype: analog low limit = 0 high limit = 100 |
| Air heater - Valve - Control signal | No | Not checked for faults datatype: analog low limit = 0 high limit = 100 |
| Air heater - Valve - Position | No | Checked for faults datatype: analog low limit = 0 high limit = 100 |
| Air heater - Water return temperature | No | Not checked for faults datatype: analog low limit = 1 high limit = 150 |
| Air heater - Water supply temperature | No | Checked for faults datatype: analog low limit = 1 high limit = 150 |
| CO2 | No | Not checked for faults datatype: analog low limit = 350 high limit not set |
| CO2 setpoint | No | Not checked for faults datatype: analog no limit defined |
| Comfort temperature | No | Checked for faults datatype: analog no limit defined |
| Dew point alarm message | No | Not checked for faults datatype: digital no limit defined |
| Fan coil unit - Cooling circuit - Valve - Control signal | No | Not checked for faults datatype: analog low limit = 0 high limit = 100 |
| Fan coil unit - Cooling circuit - Valve - Operating message | No | Not checked for faults datatype: digital no limit defined |
| Fan coil unit - Cooling circuit - Valve - Position | No | Checked for faults datatype: analog low limit = 0 high limit = 100 |
| Fan coil unit - Fan - Control signal | No | Not checked for faults datatype: analog low limit = 0 high limit = 100 |
| Fan coil unit - Fan - Operating message | No | Not checked for faults datatype: digital no limit defined |
| Fan coil unit - Fan - Position | No | Not checked for faults datatype: analog low limit = 0 high limit = 100 |
| Fan coil unit - Heating circuit - Valve - Control signal | No | Not checked for faults datatype: analog low limit = 0 high limit = 100 |
| Fan coil unit - Heating circuit - Valve - Operating message | No | Not checked for faults datatype: digital no limit defined |
| Fan coil unit - Heating circuit - Valve - Position | No | Checked for faults datatype: analog low limit = 0 high limit = 100 |
| Hybrid static heating/cooling - Valve - Control signal | No | Not checked for faults datatype: analog low limit = 0 high limit = 100 |
| Hybrid static heating/cooling - Valve - Operating message | No | Not checked for faults datatype: digital no limit defined |
| Hybrid static heating/cooling - Valve - Position | No | Checked for faults datatype: analog low limit = 0 high limit = 100 |
| Illuminance | No | Not checked for faults datatype: analog low limit = 0 high limit not set |
| Lighting operating message | No | Not checked for faults datatype: digital no limit defined |
| Main switching command | No | Not checked for faults datatype: analog no limit defined |
| Operating message | No | Not checked for faults datatype: digital no limit defined |
| Outside air relative humidity | No | Checked for faults datatype: analog low limit = 0 high limit = 100 |
| Outside air temperature | No | Checked for faults datatype: analog low limit = -20 high limit = 80 |
| Position sunlight protection | No | Not checked for faults datatype: analog low limit = 0 high limit = 100 |
| Presence | No | Not checked for faults datatype: analog no limit defined |
| Relative room air humidity | No | Checked for faults datatype: analog low limit = 0 high limit = 100 |
| Release message | No | Not checked for faults datatype: digital no limit defined |
| Request message | No | Not checked for faults datatype: digital no limit defined |
| Return air temperature | No | Checked for faults datatype: analog low limit = -5 high limit = 80 |
| Room air temperature | No | Checked for faults datatype: analog low limit = 5 high limit = 40 |
| Room air temperature setpoint (calculated) | No | Not checked for faults datatype: analog low limit = 5 high limit = 40 |
| Room temperature base setpoint | No | Not checked for faults datatype: analog low limit = 5 high limit = 40 |
| Static cooling - Valve - Control signal | No | Not checked for faults datatype: analog low limit = 0 high limit = 100 |
| Static cooling - Valve - Operating message | No | Not checked for faults datatype: digital no limit defined |
| Static cooling - Valve - Position | No | Checked for faults datatype: analog low limit = 0 high limit = 100 |
| Static heating - Valve - Control signal | No | Not checked for faults datatype: analog low limit = 0 high limit = 100 |
| Static heating - Valve - Operating message | No | Not checked for faults datatype: digital no limit defined |
| Static heating - Valve - Position | No | Checked for faults datatype: analog low limit = 0 high limit = 100 |
| Sunlight protection - Control signal | No | Not checked for faults datatype: analog low limit = 0 high limit = 100 |
| Supply air relative humidity | No | Not checked for faults datatype: analog low limit = 0 high limit = 100 |
| Supply air temperature | No | Checked for faults datatype: analog low limit = -5 high limit = 40 |
| Supply air temperature setpoint | No | Not checked for faults datatype: analog low limit = 0 high limit = 40 |
| Temperature setpoint adjustment | No | Not checked for faults datatype: analog low limit = -10 high limit = 10 |
| Temperature setpoint cooling | No | Not checked for faults datatype: analog low limit = 5 high limit = 40 |
| Temperature setpoint heating | No | Not checked for faults datatype: analog low limit = 5 high limit = 40 |
| VOC sensor | No | Not checked for faults datatype: analog low limit = 0 high limit not set |
| Volume flow controller - Control signal return air | No | Not checked for faults datatype: analog low limit = 0 high limit = 100 |
| Volume flow controller - Control signal supply air | No | Not checked for faults datatype: analog low limit = 0 high limit = 100 |
| Volume flow controller - Position return air | No | Checked for faults datatype: analog low limit = 0 high limit = 100 |
| Volume flow controller - Position supply air | No | Checked for faults datatype: analog low limit = 0 high limit = 100 |
| Window command | No | Not checked for faults datatype: analog low limit = 0 high limit = 100 |
| Window feedback | No | Checked for faults datatype: digital no limit defined |
| Pin | Required | Mapping info |
|---|---|---|
| Alarm message | No | Not checked for faults datatype: digital no limit defined |
| Inlet temperature | No | Checked for faults datatype: analog low limit = 1 high limit = 150 |
| Inlet temperature recirculation | No | Checked for faults datatype: analog low limit = -50 high limit = 150 |
| Operating message | No | Not checked for faults datatype: digital no limit defined |
| Outlet temperature | No | Checked for faults datatype: analog low limit = 1 high limit = 150 |
| Outlet temperature setpoint | No | Not checked for faults datatype: analog no limit defined |
| Pump - control signal | No | Not checked for faults datatype: analog no limit defined |
| Pump - operating message | No | Not checked for faults datatype: digital no limit defined |
| Valve - control signal | No | Not checked for faults datatype: analog no limit defined |
| Valve - position | No | Checked for faults datatype: analog low limit = 0 high limit = 100 |
| Pin | Required | Mapping info |
|---|---|---|
| Lower storage temperature | No | Checked for faults datatype: analog low limit = 0 high limit = 100 |
| Middle storage temperature | No | Checked for faults datatype: analog low limit = 0 high limit = 100 |
| Outdoor air temperature | No | Checked for faults datatype: analog low limit = -50 high limit = 50 |
| Primary side - pump - operating message | No | Not checked for faults datatype: digital no limit defined |
| Primary side - Return temperature | No | Checked for faults datatype: analog low limit = -50 high limit = 150 |
| Primary side - Supply temperature | No | Checked for faults datatype: analog low limit = -50 high limit = 150 |
| Primary side - Valve - Control signal | No | Not checked for faults datatype: analog no limit defined |
| Primary side - Valve - Position | No | Checked for faults datatype: analog low limit = 0 high limit = 100 |
| Secondary side - pump - operating message | No | Not checked for faults datatype: digital no limit defined |
| Secondary side - Return temperature | No | Checked for faults datatype: analog low limit = -10 high limit = 150 |
| Secondary side - Supply temperature | No | Checked for faults datatype: analog low limit = -10 high limit = 150 |
| Upper storage temperature | No | Checked for faults datatype: analog low limit = 0 high limit = 100 |
| Pin | Required | Mapping info |
|---|---|---|
| Average mass flow rate | No | Not checked for faults datatype: analog no limit defined |
| Cumulated weight | No | Not checked for faults datatype: analog no limit defined |
| Pin | Required | Mapping info |
|---|---|---|
| Volume flow | No | Not checked for faults datatype: analog low limit = 0 high limit not set |
| Water quantity | No | Not checked for faults datatype: analog low limit = 0 high limit not set |
| Pin | Required | Mapping info |
|---|---|---|
| Outside air relative humidity | No | Checked for faults datatype: analog low limit = 0 high limit = 100 |
| Outside air temperature | No | Checked for faults datatype: analog low limit = -50 high limit = 50 |
| Reference outside air relative humidity | No | Checked for faults datatype: analog low limit = 0 high limit = 100 |
| Reference outside air temperature | No | Checked for faults datatype: analog no limit defined |
Recommend Time Span
1 week - several weeks
Recommended Repetition
Every week
- A sensor fault can occur at any moment
Setpoint Check
The Setpoint Check analysis identifies and evaluates the deviations of setpoints from their optimal setpoint values. A setpoint deviates from its optimal setpoint as soon as the values differ without a tolerance being applied. The optimal setpoints are defined by attributes. Additionally, if the optimal setpoint is expected to result in energy savings, the analysis can estimate the potential savings for certain setpoints. See Savings potential for how this fits the general pattern.
Value
The Setpoint Check is designed to be used for two scenarios:
- The optimal setpoint represents the design value which is supposed to be set for the component. This value may originate e.g. from the planning documentation. This scenario serves a monitoring purposes to check if the setpoint is correctly set up according to the optimal setpoint.
- The optimal setpoint represents a new target value to which the user wants to adjust the component. This value may be set against the background of improved component operation, potential energy savings or increased user comfort.
Recommended for components
The analysis is available for the following components:
The analysis can be applied for the following pin types:
- Temperature setpoints
- Supply air
- Outlet - evaporator
- Duct pressure setpoints
- Supply air
- Return air
Estimation of savings potential
The estimation of savings potential is available for the following setpoints:
-
Supply air temperature setpoint of the air handling unit
Adjusting the supply air temperature setpoint can lead to thermal energy savings because the thermal power of the air heater/cooler is reduced.
-
Supply/Return air duct pressure setpoint of the air handling unit
Reducing the duct pressure setpoint can lead to electric energy savings because the fan power is reduced.
-
Outlet temperature setpoint - evaporator of the compression chiller
Increasing the outlet temperature setpoint of the evaporator can lead to electric energy savings because the chiller operates more efficiently.
Checked conditions
- Setpoints deviate from the optimal setpoints provided by attributes
- Estimation of savings potential for certain setpoints
In this example, the Return air duct pressure setpoint of an air handling unit (AHU) is analyzed. As seen in figure 1, the optimal value for the setpoint is set to 240 Pa.

Figure 1: Attribute with which the user sets the optimal setpoint value
Figure 2 shows that the value for the Return air duct pressure setpoint changes between 240 Pa and 250 Pa. During 72 hours the setpoint is above the optimal setpoint. During the rest of the time, the setpoint and the optimal setpoint are identical
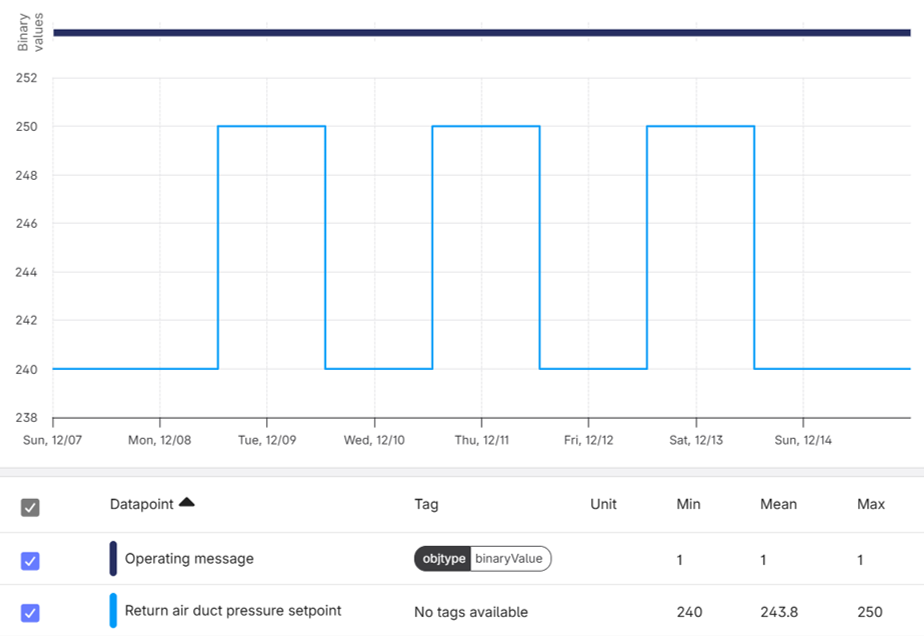
Figure 2: Timeseries of the setpoint value and an operating message
Since the KPI Return air duct pressure setpoint.deviation from optimal value.duration.relative is between 20 % and 50 %, the signal color is yellow. The Interpretation is "Small deviation of the setpoint from the actual setpoint".
The KPIs are shown in the following table:
| KPI | Value | Unit |
|---|---|---|
| operating time | 168 | h |
| operating time.relative | 100 | % |
| Return air duct pressure setpoint.deviation from optimal value.duration | 72 | h |
| Return air duct pressure setpoint.deviation from optimal value.duration.relative | 42.86 | % |
| Return air duct pressure setpoint.deviation from optimal value.duration.above | 72 | h |
| Return air duct pressure setpoint.deviation from optimal value.duration.below | 0 | h |
| Return air duct pressure setpoint.setpoint above optimal value.maximum | 10 | Pa |
| Return air duct pressure setpoint.setpoint above optimal value.mean | 10 | Pa |
| Return air duct pressure setpoint.setpoint below optimal value.maximum | 0 | Pa |
| Return air duct pressure setpoint.setpoint below optimal value.mean | 0 | Pa |
Signal colors
In order to determine the signal color the KPI <setpoint>.deviation from optimal value.duration.relative is evaluated.
| Signal color | Available | Info |
|---|---|---|
| red | Yes | The relative time of the deviation from the optimal setpoint is at least 50 %. |
| yellow | Yes | The relative time of the deviation from the optimal setpoint is between 20 % and 50 %. |
| green | Yes | The relative time of the deviation from the optimal setpoint is below 20 %. |
Interpretations
| Available | Info |
|---|---|
| Yes | The interpretation expresses whether a Large deviation of the setpoint from the optimal setpoint, Small deviation of the setpoint from the optimal setpoint or No deviation of the setpoint from the optimal setpoint was detected. |
Recommendations
| Available | Info |
|---|---|
| Yes | Information if a deviation of the setpoint from the optimal setpoint was detected for the considered setpoint. |
KPIs
<setpoint> refers to the name of the setpoint that is analyzed regarding the setpoint deviation from the optimal setpoint.
Operating Time
| KPI Identifier | Info | Value Range | Unit |
|---|---|---|---|
| operating time | Total operating time | 0 to inf | h |
| operating time.relative | Relative operating time | 0 to 100 | % |
Setpoint Check KPIs
| KPI Identifier | Info | Value Range | Unit |
|---|---|---|---|
| <setpoint>.deviation from optimal value.duration | Duration of the setpoint being above or below the optimal setpoint | 0 to inf | h |
| <setpoint>.deviation from optimal value.duration.relative | Relative duration of the setpoint being above or below the optimal setpoint | 0 to 100 | % |
| <setpoint>.deviation from optimal value.duration.above | Duration of the setpoint being above the optimal setpoint | 0 to inf | h |
| <setpoint>.deviation from optimal value.duration.below | Duration of the setpoint being below the optimal setpoint | 0 to inf | h |
| <setpoint>.setpoint above optimal value.maximum | Maximum upward deviation of the setpoint from the optimal setpoint | 0 to 100 | unit of pin |
| <setpoint>.setpoint above optimal value.mean | Mean upward deviation of the setpoint from the optimal setpoint | 0 to 100 | unit of pin |
| <setpoint>.setpoint below optimal value.maximum | Maximum downward deviation of the setpoint from the optimal setpoint | 0 to 100 | unit of pin |
| <setpoint>.setpoint below optimal value.mean | Mean downward deviation of the setpoint from the optimal setpoint | 0 to 100 | unit of pin |
Savings calculation
KPIs regarding the savings calculation for the supply air temperature setpoint (AHU)
| KPI Identifier | Info | Value Range | Unit |
|---|---|---|---|
| Supply air temperature setpoint.yearly savings potential.energy.electricity | Extrapolated electricity savings potential per year | 0 to inf | kWh |
| Supply air temperature setpoint.yearly savings potential.financial.electricity | Extrapolated cost savings potential per year | 0 to inf | € |
| Supply air temperature setpoint.yearly savings potential.CO2 emissions.electricity | Extrapolated CO2 emission savings potential per year | 0 to inf | kg |
KPIs regarding the savings calculation for the supply/return air duct pressure setpoint (AHU)
The <fan> is either the supply fan or return fan.
| KPI Identifier | Info | Value Range | Unit |
|---|---|---|---|
| <setpoint>.<fan>.reduction factor.mean.energy.electricity | Mean factor by which the duct pressure could be reduced in case the actual value is above the setpoint. | 0 to 100 | % |
| <setpoint>.<fan>.increase factor.mean.energy.electricity | Mean factor by which the duct pressure must be increased in case the actual value falls below the setpoint. | 0 to inf | % |
| <setpoint>.<fan>.savings potential.energy.electricity | Electricity that could have been saved in the analysis period | 0 to inf | kWh |
| <setpoint>.<fan>.savings potential.financial.electricity | Costs that could have been avoided in the analysis period | 0 to inf | € |
| <setpoint>.<fan>.savings potential.CO2 emissions.electricity | CO2 emissions that could have been avoided in the analysis period | 0 to inf | kg |
| <setpoint>.<fan>.yearly savings potential.energy.electricity | Extrapolated electricity savings potential per year | 0 to inf | kWh |
| <setpoint>.<fan>.yearly savings potential.financial.electricity | Extrapolated cost savings potential per year | 0 to inf | € |
| <setpoint>.<fan>.yearly savings potential.CO2 emissions.electricity | Extrapolated CO2 emission savings potential per year | 0 to inf | kg |
KPIs regarding the savings calculation for the outlet temperature setpoint of the evaporator (Compression chiller)
| KPI Identifier | Info | Value Range | Unit |
|---|---|---|---|
| Condenser.hot reservoir.mean temperature | Mean temperature of the hot reservoir which is located at the condenser side | - | °C |
| Evaporator.cold reservoir.mean temperature | Mean temperature of the cold reservoir which is located at the evaporator side | - | °C |
| Evaporator.cold water.mean temperature deviation from setpoint | Mean deviation of the cold water temperature from the setpoint | °C | |
| Evaporator.cold reservoir.optimal value mean temperature | Mean temperature of the cold reservoir (at optimal setpoint conditions) which is located at the evaporator side | - | °C |
| Energy efficiency ratio.carnot cycle | EER of the carnot cycle at setpoint conditions | 0 to inf | - |
| Energy efficiency ratio.carnot cycle.Potential | EER of the carnot cycle at optimal setpoint conditions | 0 to inf | - |
| Energy efficiency ratio.improvement potential | Potential improvement of the EER by adjusting the setpoint to the optimal setpoint | 0 to inf | % |
| Outlet temperature setpoint - evaporator.yearly savings potential.energy.electricity | Extrapolated electricity savings potential per year | 0 to inf | kWh |
| Outlet temperature setpoint - evaporator.yearly savings potential.financial.electricity | Extrapolated cost savings potential per year | 0 to inf | € |
| Outlet temperature setpoint - evaporator.yearly savings potential.CO2 emissions.electricity | Extrapolated CO2 emission savings potential per year | 0 to inf | kg |
The savings potentials of all <setpoints> are summed up to the following total yearly savings potential KPIs.
| KPI Identifier | Info | Value Range | Unit |
|---|---|---|---|
| total yearly savings potential.energy | Total savings potential of energy per year by resolving all setpoint deviations. | 0 to inf | kWh |
| total yearly savings potential.financial | Total savings potential of costs per year by resolving all setpoint deviations. | 0 to inf | € |
| total yearly savings potential.CO2 emissions | Total savings potential of CO2 emissions per year by resolving all setpoint deviations. | 0 to inf | kg |
KPIs regarding energy factors
| KPI Identifier | Info | Value Range | Unit |
|---|---|---|---|
| CO2 emission factor.electricity | CO2 emission factor of electricity | 0 to inf | kg/kWh |
| energy price.electricity | Energy price of electricity | 0 to inf | €/kWh |
The estimation of savings potential is available for the following setpoints:
-
Supply air temperature setpoint of the air handling unit
The savings potential is estimated using the thermal power equation for thermal power \(\dot{Q}\) of an air heater/cooler of the AHU.
\[ \dot{Q} = \dot{V} \cdot \rho \cdot c_\text{p} \cdot \Delta{T} \]Assuming that the return air temperature is equal to the supply air temperature, the temperature difference \(\Delta{T}\) between the supply air and the supply air after the HRCS can be calculated as follows:
\[ \Delta{T} = (1 - \eta_{\text{HRCS}}) \cdot (T_{\text{supply}} - T_{\text{outside}}) \]In essence
Adjusting the supply air temperature setpoint can lead to thermal energy savings because the thermal power of the air heater/cooler is reduced.
It is assumed that by adjusting the setpoint to the optimal setpoint, only \(T_\text{supply}\) changes. The following are assumed to be constant: volume flow \(\dot{V}\), the density \(\rho\), the specific heat capacity \(c_\text{p}\) of the air, the efficiency of the HRCS \(\eta_{\text{HRCS}}\) and the outside air temperature \(T_{\text{outside}}\).
The savings potential is estimated by calculating the difference in thermal power when the supply air temperature is equal to the setpoint compared to when it is equal to the optimal setpoint.
-
Supply/Return air duct pressure setpoint of the air handling unit
The estimation of the savings potential is based on the fan power equation which states that the power consumption \(P\) of a fan is proportional to the product of the pressure difference \(\Delta p\) and the volume flow rate \(\dot{V}\).
\[ P = \Delta p \cdot \dot{V} \]In essence
Reducing the duct pressure setpoint can lead to electric energy savings because the fan power is reduced.
Assuming that the volume flow rate remains constant when adjusting the duct pressure setpoint, the relative reduction of the fan power consumption \(f_\text{reduction}\) can be estimated by comparing the pressure difference at the optimal setpoint \(\Delta p_\text{optimal setpoint}\) and at the setpoint \(\Delta p_\text{setpoint}\). Furthermore, the relative reduction factor is equal to the ratio of the reducible fan power \(\Delta P_\text{reducible}\) and the power at the setpoint \(P_\text{setpoint}\).
\[ f_\text{reduction} = 1 - \frac{\Delta p_\text{optimal setpoint}}{\Delta p_\text{setpoint}} = \frac{\Delta P_\text{reducible}}{P_\text{setpoint}} \]The pressure differences are represented by the supply/return air duct pressure setpoints and their respective optimal values. In case the optimal setpoint is temporarily greater than the actual setpoint, a relative increase factor is calculated analogously which reduces the savings potential.
Finally, the electric energy savings potential is calculated considering the reduction factor, the fan power at the setpoint and optionally the increase factor. -
Outlet temperature setpoint - evaporator of the compression chiller
The efficiency of a compression chiller increases when the outlet temperature of the evaporator – more precisely, the average cold water temperature on the evaporator side – is raised. This is because the efficiency is strongly influenced by the temperature levels at both the evaporator and condenser side. As the evaporator temperature increases, the temperature difference between the evaporator and condenser temperature decreases, which improves the chiller's efficiency. In this context, it is assumed that the average condenser temperature is determined by the outside air temperature and remains constant when the evaporator flow temperature is adjusted.
In essence
Increasing the outlet temperature setpoint of the evaporator can lead to electric energy savings because the chiller operates more efficiently.
Typically, the outlet temperature (setpoint) of the evaporator depends heavily on the supply temperature (setpoint) of a cooling circuit or may even be equal to it.The efficiency of a chiller is typically quantified by the Energy Efficiency Ratio (EER) \(\epsilon\). In the ideal case without losses, its theoretical maximum is given by the Carnot-EER \(\epsilon_\text{Carnot}\).
\[ \epsilon = \eta_\text{losses} \cdot \epsilon_\text{Carnot} \]\[ \epsilon_\text{Carnot} = \frac{T_\text{c}}{T_\text{h} - T_\text{c}} \]\(T_\text{c}\) is the temperature of the cold reservoir and \(T_\text{h}\) is the temperature of the hot reservoir in Kelvin. The temperature of the cold reservoir is represented by the average cold water temperature on the evaporator, taking into account a temperature difference between the cold water and the refrigerant in the evaporator. The temperature of the hot reservoir is represented by the outside air temperature plus a temperature difference between the refrigerant in the condenser and the ambient air.
As the losses are assumed to be constant for small changes in the evaporator temperature, the relative savings potential \(f\) can be estimated by comparing the Carnot-EER before (\(\epsilon_\text{Carnot, setpoint}\)) and after (\(\epsilon_\text{Carnot, optimal setpoint}\)) adjusting the outlet temperature setpoint of the evaporator.
\[ f = 1 - \frac{\epsilon_\text{Carnot, setpoint}}{\epsilon_\text{Carnot, optimal setpoint}} \]Finally, the electricity savings potential can be calculated by multiplying the relative savings potential with the electricity consumption of the chiller.
Supply air temperature setpoint
| Name | Type | Mapping info |
|---|---|---|
| Supply air temperature setpoint | Pin | Required if supply air temperature setpoint is to be analyzed. |
| Supply air temperature setpoint - Optimal value | Attribute | Required if supply air temperature setpoint is to be analyzed. |
Pins and attributes for the savings potential
| Pin | Mapping info | Unit |
|---|---|---|
| Supply air fan - operating message | If not available, you can use "pressure", "speed" or "volume flow" to estimate the operating message. | - |
| Supply air fan - pressure | Alternative to estimate the operating message. Activity threshold: 30 Pa. | Pa |
| Supply air fan - position | Alternative to estimate the operating message. Activity threshold: 5 %. | % |
| Supply air fan - control signal | Alternative source for the supply air fan - position. Activity threshold: 5 %. | % |
| Supply air fan - volume flow | Alternative to estimate the operating message. Activity threshold: 10 m3/h. | m3/h |
| Supply air duct pressure | Alternative to estimate the operating message. Activity threshold: 10 Pa. | Pa |
| Heat recovery system - operating message | If not available, the hrcs position or control signal is used | - |
| Heat recovery system - position | Alternative to estimate the operating message. Activity threshold: 10 % | % |
| Heat recovery system - control signal | Alternative to estimate the operating message. Activity threshold: 10 % | % |
| Operating message | Alternative to estimate the operating message. | - |
| Attribute | Mapping info | Unit |
|---|---|---|
| CO2 emission factor cold | CO2 emission factor for cold energy. Default: 0.3 kg/kWh | kg/kWh |
| CO2 emission factor heat | CO2 emission factor for heat energy. Default: 0.36 kg/kWh | kg/kWh |
| Cold price | Price of cold energy. Default: 0.1 €/kWh | €/kWh |
| Heat price | Price of heat energy. Default: 0.15 €/kWh | €/kWh |
| Heat recovery system active during cooling | "True" if the heat recovery system is active during cooling (Summer), "False" if it is not active during cooling. Default: False | - |
| Heat recovery system active during heating | "True" if the heat recovery system is active during heating (Winter), "False" if it is not active during heating. Default: True | - |
| Heat recovery system efficiency | Range: 0-1. Default: 0.75 | - |
| Schedule | Weekly schedule of the AHU | - |
| Supply air fan - Default speed | Range: 0-100%. Default: 90%. | % |
| Supply air fan - nominal power | Nominal electrical power of the supply fan | kW |
| Supply air fan - nominal volume flow | Nominal volume flow of supply fan | m3/h |
| Supply air fan - specific fan power | Quantifies the energy-efficiency of the supply fan. Default: 2000 Ws/m3 | Ws/m3 |
Check out Where prices and emission factors come from for Energy price and CO2 emission factor sources and priorities.
Supply air duct pressure setpoint
| Name | Type | Mapping info |
|---|---|---|
| Supply air duct pressure setpoint | Pin | Required if supply air duct pressure setpoint is to be analyzed. |
| Supply air duct pressure setpoint - Optimal value | Attribute | Required if supply air duct pressure setpoint is to be analyzed. |
Pins and attributes for the savings potential
| Pin | Mapping info | Unit |
|---|---|---|
| Supply air fan - operating message | If not available, you can use "pressure", "speed" or "volume flow" to estimate the operating message. | - |
| Supply air fan - pressure | Alternative to estimate the operating message. Activity threshold: 30 Pa. | Pa |
| Supply air fan - position | Alternative to estimate the operating message. Activity threshold: 5 %. | % |
| Supply air fan - control signal | Alternative source for the supply air fan - position. Activity threshold: 5 %. | % |
| Supply air fan - volume flow | Alternative to estimate the operating message. Activity threshold: 10 m3/h. | m3/h |
| Supply air duct pressure | Alternative to estimate the operating message. Activity threshold: 10 Pa. | Pa |
| Operating message | Alternative to estimate the operating message. | - |
| Attribute | Mapping info | Unit |
|---|---|---|
| CO2 emission factor electricity | CO2 emission factor for electric energy. Default: 0.56 kg/kWh | kg/kWh |
| Electricity price | Price of electric energy. Default: 0.25 €/kWh | €/kWh |
| Supply air fan - Default speed | Range: 0-100%. Default: 90%. | % |
| Supply air fan - nominal power | Nominal electrical power of the supply fan | kW |
| Supply air fan - nominal volume flow | Nominal volume flow of supply fan | m3/h |
| Supply air fan - specific fan power | Quantifies the energy-efficiency of the supply fan. Default: 2000 Ws/m3 | Ws/m3 |
Check out Where prices and emission factors come from for Energy price and CO2 emission factor sources and priorities.
Return air duct pressure setpoint
| Name | Type | Mapping info |
|---|---|---|
| Return air duct pressure setpoint | Pin | Required if return air duct pressure setpoint is to be analyzed. |
| Return air duct pressure setpoint - Optimal value | Attribute | Required if return air duct pressure setpoint is to be analyzed. |
Pins and attributes for the savings potential
| Pin | Mapping info | Unit |
|---|---|---|
| Return air fan - operating message | If not available, you can use "pressure", "speed" or "volume flow" to estimate the operating message. | - |
| Return air fan - pressure | Alternative to estimate the operating message. Activity threshold: 30 Pa. | Pa |
| Return air fan - position | Alternative to estimate the operating message. Activity threshold: 5 %. | % |
| Return air fan - control signal | Alternative source for the return air fan - position. Activity threshold: 5 %. | % |
| Return air fan - volume flow | Alternative to estimate the operating message. Activity threshold: 10 m3/h. | m3/h |
| Return air duct pressure | Alternative to estimate the operating message. Activity threshold: 10 Pa. | Pa |
| Operating message | Alternative to estimate the operating message. | - |
| Attribute | Mapping info | Unit |
|---|---|---|
| CO2 emission factor electricity | CO2 emission factor for electric energy. Default: 0.56 kg/kWh | kg/kWh |
| Electricity price | Price of electric energy. Default: 0.25 €/kWh | €/kWh |
| Return air fan - Default speed | Default fan speed used when speed pin is not connected. Range: 0-100%. Default: 90%. | % |
| Return air fan - nominal power | Nominal electrical power of the return fan | kW |
| Return air fan - nominal volume flow | Nominal volume flow of return fan | m3/h |
| Return air fan - specific fan power | Quantifies the energy-efficiency of fan. Default: 2000 Ws/m3 | Ws/m3 |
Check out Where prices and emission factors come from for Energy price and CO2 emission factor sources and priorities.
Outlet temperature setpoint - evaporator
| Name | Type | Mapping info |
|---|---|---|
| Outlet temperature setpoint - evaporator | Pin | Required if outlet temperature setpoint - evaporator is to be analyzed. |
| Outlet temperature setpoint - evaporator - Optimal value | Attribute | Required if outlet temperature setpoint - evaporator is to be analyzed. |
Pins and attributes for the savings potential
| Pin | Mapping info | Unit |
|---|---|---|
| Evaporator - pump - operating message | Operating message for the pump | - |
| Inlet temperature - evaporator | Used to calculate mean temperature of the evaporator and thus the temperature of the cold reservoir. | °C |
| Outlet temperature - evaporator | Used to calculate mean temperature of the evaporator and thus the temperature of the cold reservoir. | °C |
| Operating message | Operating message | - |
| Outside air temperature | Used to calculate the temperature of the hot reservoir. | °C |
| Attribute | Mapping info | Unit |
|---|---|---|
| CO2 emission factor electricity | CO2 emission factor for electric energy. Default: 0.56 kg/kWh | kg/kWh |
| Electricity price | Price of electric energy. Default: 0.25 €/kWh | €/kWh |
| Condenser - temperature difference | Used to calculate the temperature of the hot reservoir. Default: 5 K | K |
| Electricity consumption per year | Used to calculate the absolute electricity savings potential. No default. | kWh |
| Evaporator - minimal temperature spread | Used to estimate the mean temperature of the evaporator in case one of the following pins is missing: Inlet temperature - evaporator, Outlet temperature - evaporator. Default: 1 K | K |
| Evaporator - temperature difference | Used to calculate the temperature of the cold reservoir. Default: 5 K | K |
Check out Where prices and emission factors come from for Energy price and CO2 emission factor sources and priorities.
Recommended Time Span
1 day to 1 week
Recommended Repetition
Every week
Setpoint Deviation
The Setpoint Deviation analysis identifies setpoints that are not met by their process values. The difference between the setpoint and the actual value is also known as the setpoint deviation. A high setpoint deviation is a symptom that can be traced back to many causes. E.g., the insufficient supply of a controlled system with the required temperature level, suboptimal controller software, and parameters, or a blocked valve. The Setpoint Deviation analysis incorporates features that help to narrow down the root cause of a high setpoint deviation, such as setpoint deviations caused by upstream components. The analysis is able to estimate a savings potential for the air handling unit (AHU) if the supply/return air duct pressure exceeds it's setpoint. See Savings potential for how this fits the general pattern.
Value
Setpoint deviation is a strong symptom for faulty control loop operation, e.g., caused by
- Technical defects in the control loop supply,
- Control loop malfunctions, and
- Faulty control loop parameter settings.
Benefits of improving insufficient setpoint value attainment are
- Higher occupant comfort, health, and performance
- Lower operating costs
- Higher energy efficiency
The estimation of the savings potential is available for the following components and setpoints:
- Air handling unit:
- Supply duct pressure (setpoint)
- Return air duct pressure (setpoint)
Recommended for components
Control loops, such as
- Heating systems
- Ventilation systems
- Air-conditioning systems
Checked conditions
- Setpoint deviation
- Setpoint value is has been manually overridden
- Upstream components do not have the required temperature levels to meet the setpoint
In this example, a thermal control loop is assessed for a week (see Figure 1). Throughout the week, there is a high setpoint deviation, indicating that there is a problem with the thermal control loop.
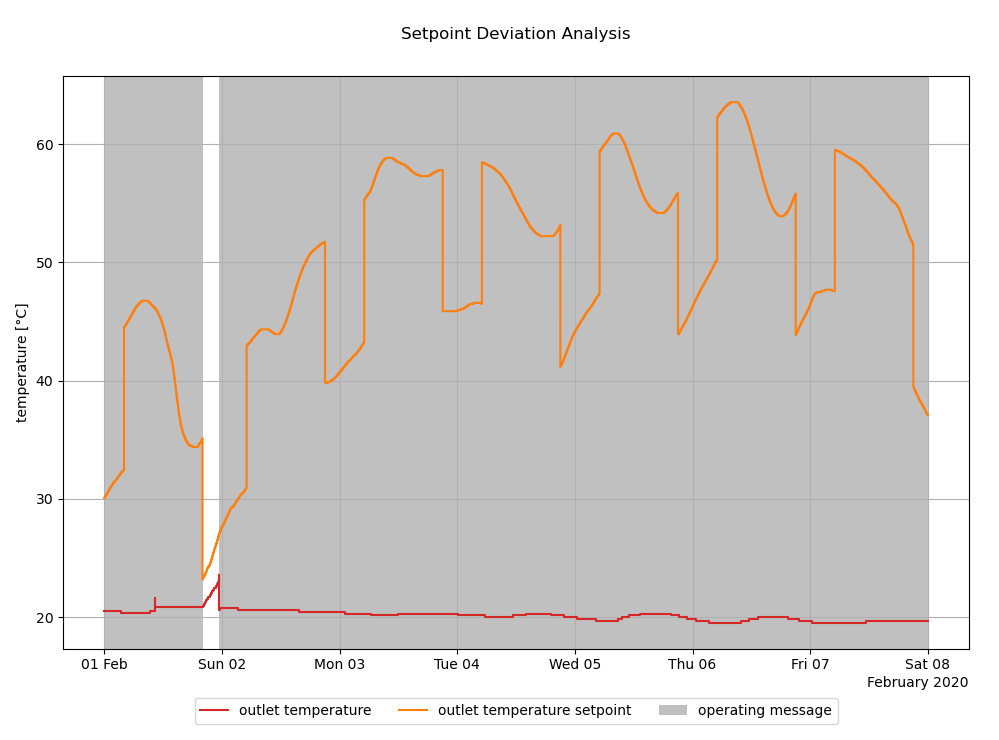
Figure 1: Example of a process value (actual value) undershooting its setpoint
Recommendations are given to check the thermal control loop to find possible causes of the high setpoint deviation.
| KPI | Value | Unit |
|---|---|---|
| operating time | 164.7 | h |
| operating time.relative | 98.0 | % |
| setpoint deviation tolerance | 1.5 | °C |
| outlet temperature setpoint deviation.duration.greater than threshold | 164.7 | h |
| outlet temperature setpoint deviation.duration.greater than threshold.relative | 100.0 | % |
| outlet temperature.actual value above setpoint.maximum | 0.0 | °C |
| outlet temperature.actual value above setpoint.mean | 0.0 | °C |
| outlet temperature.actual value below setpoint.maximum | 44.0 | °C |
| outlet temperature.actual value below setpoint.mean | 29.6 | °C |
Signal colors
| Signal color | Available | Info |
|---|---|---|
| red | Yes | The analysis identifies the symptom and recommends measures to investigate the root cause of the setpoint deviation. Red as a signal for a low cost measure with high impact on the building operation will not be provided. |
| yellow | Yes | Setpoint deviation is a strong symptom for suboptimal control and system performance. Investing the extra effort to identify the root cause and fixing it is strongly recommended. |
| green | Yes | Sufficient setpoint compliance in respect to usual tolerances in buildings. |
Interpretations
| Available | Info |
|---|---|
| Yes | Interpretations summarize the result of the analysis. |
Recommendations
| Available | Info |
|---|---|
| Yes | Recommendations on how to investigate the root cause of a setpoint deviation. No recommendation, if setpoint compliance is sufficient. |
KPIs
<setpoint> refers to the setpoint type.
The available setpoint types are:
- condenser/evaporator outlet temperature (for heat pumps and compression chillers)
- outlet temperature
- position of heat recovery system or recirculation damper
- pressure of fan or duct
- temperature
- valve position
- volume flow
In case of air handling units (AHUs) the KPIs are evaluated only during the operating time given by the corresponding operating message pin. If only the global operating message is set, all KPIs will be evaluated during activity on this pin.
Operating Time
Operating time KPIs provide information on the total time of operation of the analyzed component during the analyzed time frame.
| KPI Identifier | Info | Value Range | Unit |
|---|---|---|---|
| operating time | Total operating time | 0 to inf | h |
| operating time.relative | Relative operating time | 0 to 100 | % |
| <setpoint>.operating time | Operating time of specific component denoted by <setpoint> | 0 to inf | h |
Quantity statistics
| KPI Identifier | Info | Value Range | Unit |
|---|---|---|---|
| <setpoint>.actual value.mean | Average of actual value during operation | -inf to inf | unit of setpoint |
| <setpoint>.setpoint.mean | Average of setpoint during operation | -inf to inf | unit of setpoint |
Incidence of Setpoint Deviation
Duration and statistics of the setpoint deviations, for deviations greater than the setpoint deviation tolerance.
| KPI Identifier | Info | Value Range | Unit |
|---|---|---|---|
| <setpoint> setpoint deviation tolerance | The setpoint deviation which is considered acceptable | 0 to inf | unit of setpoint |
| <setpoint> setpoint deviation.duration.greater than threshold | Total operating time outside of the tolerance band defined by attribute "deviation tolerance" | 0 to inf | h |
| <setpoint> setpoint deviation.duration.greater than threshold.relative | Total operating time outside of the tolerance band for which the setpoint deviation positive, relative to total operating time | 0 to 100 | % |
| <setpoint> setpoint deviation.duration.above threshold | Operating time above tolerance band defined by attribute "deviation tolerance" | 0 to inf | h |
| <setpoint> setpoint deviation.duration.below threshold | Operating time below tolerance band defined by attribute "deviation tolerance" | 0 to inf | h |
Actual values for deviations above or below the setpoint without any deviation tolerance.
| KPI Identifier | Info | Value Range | Unit |
|---|---|---|---|
| <setpoint>.deviation actual value above setpoint.maximum | Largest setpoint deviation during operation above setpoint | 0 to inf | unit of setpoint |
| <setpoint>.deviation actual value above setpoint.mean | Average setpoint deviation during operation above setpoint | 0 to inf | unit of setpoint |
| <setpoint>.deviation actual value below setpoint.maximum | Largest setpoint deviation during operation below setpoint | 0 to inf | unit of setpoint |
| <setpoint>.deviation actual value below setpoint.mean | Average setpoint deviation during operation above setpoint | 0 to inf | unit of setpoint |
Upstream component check
KPIs regarding the upstream components.
| KPI Identifier | Info | Value Range | Unit |
|---|---|---|---|
| <setpoint>.duration.above inlet | Total time for which the outlet setpoint is above the inlets | 0 to inf | unit of setpoint |
| <setpoint>.duration.above inlet.relative | Total time for which the outlet setpoint is above the inlets, relative to total operating time | 0 to inf | unit of setpoint |
| <setpoint>.duration.below inlet | Total time for which the outlet setpoint is below the inlets | 0 to inf | unit of setpoint |
| <setpoint>.duration.below inlet.relative | Total time for which the outlet setpoint is below the inlets, relative to the total operating time | 0 to inf | unit of setpoint |
Savings calculation
KPIs regarding energy factors
| KPI Identifier | Info | Value Range | Unit |
|---|---|---|---|
| CO2 emission factor.electricity | CO2 emission factor of electricity | 0 to inf | kg/kWh |
| energy price.electricity | Energy price of electricity | 0 to inf | €/kWh |
KPIs regarding the savings calculation for the supply/return duct pressure. The <fan> is either the supply fan or return fan.
| KPI Identifier | Info | Value Range | Unit |
|---|---|---|---|
| <setpoint>.<fan>.reduction factor.mean.energy.electricity | Mean factor by which the duct pressure could be reduced in case the actual value is above the setpoint. | 0 to 100 | % |
| <setpoint>.<fan>.increase factor.mean.energy.electricity | Mean factor by which the duct pressure must be increased in case the actual value falls below the setpoint. | 0 to inf | % |
| <setpoint>.<fan>.savings potential.energy.electricity | Electricity that could have been saved in the analysis period by resolving the setpoint deviation. | 0 to inf | kWh |
| <setpoint>.<fan>.savings potential.financial.electricity | Costs that could have been avoided in the analysis period by resolving the setpoint deviation. | 0 to inf | € |
| <setpoint>.<fan>.savings potential.CO2 emissions.electricity | CO2 emissions that could have been avoided in the analysis period by resolving the setpoint deviation. | 0 to inf | kg |
| <setpoint>.<fan>.yearly savings potential.energy.electricity | Extrapolated electricity savings potential per year by resolving the setpoint deviation. | 0 to inf | kWh |
| <setpoint>.<fan>.yearly savings potential.financial.electricity | Extrapolated cost savings potential per year by resolving the setpoint deviation. | 0 to inf | € |
| <setpoint>.<fan>.yearly savings potential.CO2 emissions.electricity | Extrapolated CO2 emission savings potential per year by resolving the setpoint deviation. | 0 to inf | kg |
KPIs regarding the total savings calculation for the setpoint deviation analysis. The savings potentials of all <setpoints> are summed up to the following total yearly savings potential KPIs.
| KPI Identifier | Info | Value Range | Unit |
|---|---|---|---|
| total yearly savings potential.energy | Total savings potential of energy per year by resolving all setpoint deviations. | 0 to inf | kWh |
| total yearly savings potential.financial | Total savings potential of costs per year by resolving all setpoint deviations. | 0 to inf | € |
| total yearly savings potential.CO2 emissions | Total savings potential of CO2 emissions per year by resolving all setpoint deviations. | 0 to inf | kg |
| Pin | Required | Mapping info |
|---|---|---|
| Operating message | No | An operating message candidate Default: Always operating |
| Pump - control signal | No | An operating message candidate Default: Always operating |
| Pump - operating message | No | An operating message candidate Default: Always operating |
| Outlet air temperature | No | Required if outlet air temperature is to be analyzed. |
| Outlet air temperature setpoint | No | Required if outlet air temperature is to be analyzed. |
| Valve - control signal | No | Required if valve position is to be analyzed. |
| Valve - position | No | Required if valve position is to be analyzed. |
| Attribute | Required | Mapping info | Unit |
|---|---|---|---|
| Outlet air temperature setpoint deviation tolerance | No | Default: 1.5°C | °C |
| Valve position setpoint deviation tolerance | No | Default: 10 % | % |
| Pin | Required | Mapping info |
|---|---|---|
| Air cooler - valve - control signal | No | Required if Air cooler - valve - position is to be analyzed. |
| Air cooler - valve - position | No | Required if Air cooler - valve - position is to be analyzed. |
| Air heater - valve - control signal | No | Required if Air heater - valve - position is to be analyzed. |
| Air heater - valve - position | No | Required if Air heater - valve - position is to be analyzed. |
| Air re-heater - valve - control signal | No | Required if air re-heater - valve position is to be analyzed. |
| Air re-heater - valve - position | No | Required if air re-heater - valve position is to be analyzed. |
| Heat recovery system - position | No | Required if Heat recovery system - position is to be analyzed. |
| Heat recovery system - control signal | No | Required if Heat recovery system - position is to be analyzed. |
| Recirculation damper - control signal | No | Required if recirculation damper - position is to be analyzed. |
| Recirculation damper - position | No | Required if recirculation damper - position is to be analyzed. |
| Return air duct pressure | No | Required if return air duct pressure is to be analyzed. |
| Return air duct pressure setpoint | No | Required if return air duct pressure is to be analyzed. |
| Return air fan - pressure | No | Required if return air fan - pressure is to be analyzed. |
| Return air fan - pressure setpoint | No | Required if return air fan - pressure is to be analyzed. |
| Return air fan - position | No | Candidate for operating message. Used in savings calculation. |
| Return air fan - control signal | No | Candidate for operating message. Used in savings calculation. |
| Return air fan - volume flow | No | Candidate for operating message. Used in savings calculation. |
| Return air temperature | No | Required if return air temperature is to be analyzed. |
| Return air temperature setpoint | No | Required if return air temperature is to be analyzed. |
| Supply air fan - pressure | No | Required if supply air fan - pressure is to be analyzed. |
| Supply air fan - pressure setpoint | No | Required if supply air fan - pressure is to be analyzed. |
| Supply air fan - position | No | Candidate for operating message. Used in savings calculation. |
| Supply air fan - control signal | No | Candidate for operating message. Used in savings calculation. |
| Supply air fan - volume flow | No | Candidate for operating message. Used in savings calculation. |
| Supply air temperature | No | Required if supply air temperature is to be analyzed. |
| Supply air temperature setpoint | No | Required if supply air temperature is to be analyzed. |
| Supply duct pressure | No | Required if supply duct pressure is to be analyzed. |
| Supply duct pressure setpoint | No | Required if supply duct pressure is to be analyzed. |
| Operating message | No | An operating message candidate Default: Always operating |
| Return air fan - operating message | No | An operating message candidate Default: Always operating |
| Supply air fan - operating message | No | An operating message candidate Default: Always operating |
| Outside air temperature (AHU) | No | Candidate for outside air temperature to determine if AHU is in cooling mode. |
| Outside air temperature (weather station) | No | Candidate for outside air temperature to determine if AHU is in cooling mode. |
| Attribute | Required | Mapping info | Unit |
|---|---|---|---|
| Air cooler - valve position setpoint deviation tolerance | No | Default: 10 % | % |
| Air cooler installed | No | Default: - | - |
| Air heater - valve position setpoint deviation tolerance | No | Default: 10 % | % |
| Air re-heater - valve position setpoint deviation tolerance | No | Default: 10 % | % |
| Heat recovery system - utilization level control signal deviation tolerance | No | Default: 10 % | % |
| Pressure setpoint deviation tolerance | No | Default: 20 Pa | Pa |
| Recirculation damper - position setpoint deviation tolerance | No | Default: 10 % | % |
| Return air temperature setpoint deviation tolerance | No | Default: 1.5°C | °C |
| Supply air temperature setpoint deviation tolerance | No | Default: 1.5°C | °C |
| Attributes regarding the savings calculation | Required | Mapping info | Unit |
|---|---|---|---|
| CO2 emission factor electricity | No | Default: 0.56 kg/kWh | kg/kWh |
| Electricity price | No | Default: 0.25 €/kWh | €/kWh |
| Schedule | No | Default: - | json |
| Schedule timezone | No | Default: Europe/Berlin | - |
| Return air fan - Default speed | No | Default: 90 % | % |
| Return air fan - nominal power | No | Default: - | kW |
| Return air fan - nominal volume flow | No | Default: - | m³/h |
| Return air fan - specific fan power | No | Default: 2000 | Ws/m³ |
| Supply air fan - Default speed | No | Default: 90 % | % |
| Supply air fan - nominal power | No | Default: - | kW |
| Supply air fan - nominal volume flow | No | Default: - | m³/h |
| Supply air fan - specific fan power | No | Default: 2000 | Ws/m³ |
Check out Where prices and emission factors come from for Energy price and CO2 emission factor sources and priorities.
| Pin | Required | Mapping info |
|---|---|---|
| Operating message | No | An operating message candidate Default: Always operating |
| Pump - control signal | No | An operating message candidate Default: Always operating |
| Pump - operating message | No | An operating message candidate Default: Always operating |
| Outlet air temperature | No | Required if outlet air temperature is to be analyzed. |
| Outlet air temperature setpoint | No | Required if outlet air temperature is to be analyzed. |
| Valve - control signal | No | Required if valve position is to be analyzed. |
| Valve - position | No | Required if valve position is to be analyzed. |
| Attribute | Required | Mapping info | Unit |
|---|---|---|---|
| Outlet air temperature setpoint deviation tolerance | No | Default: 1.5°C | °C |
| Valve - control signal deviation tolerance | No | Default: 10 % | % |
| Pin | Required | Mapping info |
|---|---|---|
| Operating message | No | An operating message candidate Default: Always operating |
| Pump - control signal | No | An operating message candidate Default: Always operating |
| Pump - operating message | No | An operating message candidate Default: Always operating |
| Supply temperature | Yes | - |
| Supply temperature setpoint | Yes | - |
| Attribute | Required | Mapping info | Unit |
|---|---|---|---|
| Temperature setpoint deviation tolerance | No | Default: 1.5°C | °C |
| Pin | Required | Mapping info |
|---|---|---|
| Operating message | No | An operating message candidate Default: Always operating |
| Evaporator - pump - operating message | No | An operating message candidate Default: Always operating |
| Condenser - pump - operating message | No | An operating message candidate Default: Always operating |
| Outlet temperature condenser | No | Required, if condenser shall be analyzed. |
| Outlet temperature evaporator | No | Required, if evaporator shall be analyzed. |
| Outlet temperature setpoint - condenser | No | Required, if condenser shall be analyzed. |
| Outlet temperature setpoint - evaporator | No | Required, if evaporator shall be analyzed. |
| Condenser - Pump - control signal | No | An operating message candidate Default: Always operating |
| Evaporator - pump - control signal | No | An operating message candidate Default: Always operating |
| Attribute | Required | Mapping info | Unit |
|---|---|---|---|
| Outlet temperature setpoint deviation tolerance - condenser | No | Default: 1.5°C | |
| Outlet temperature setpoint deviation tolerance - evaporator | No | Default: 1.5°C |
| Pin | Required | Mapping info |
|---|---|---|
| Cold water temperature | No | Helps to determine the cause of the setpoint deviation. |
| Operating message | No | An operating message candidate Default: Always operating |
| Pump - control signal | No | An operating message candidate Default: Always operating |
| Pump - operating message | No | An operating message candidate Default: Always operating |
| Supply temperature | No | Required, if supply temperature shall be analyzed. |
| Supply temperature setpoint | Yes | - |
| Valve - control signal | No | Helps to determine the cause of the setpoint deviation. |
| Valve - position | No | Helps to determine the cause of the setpoint deviation. |
| Attribute | Required | Mapping info | Unit |
|---|---|---|---|
| Supply temperature setpoint deviation tolerance | No | Default: 1.5°C | °C |
| Valve position setpoint deviation tolerance | No | Default: 10 % | % |
| Pin | Required | Mapping info |
|---|---|---|
| Operating message | No | Mapping strongly recommended. Default: Always operating |
| Pressure difference | Yes | - |
| Pressure difference setpoint | Yes | - |
| Attribute | Required | Mapping info | Unit |
|---|---|---|---|
| Pressure difference setpoint deviation tolerance | No | Default: 20 Pa | Pa |
| Pin | Required | Mapping info |
|---|---|---|
| Operating message | No | An operating message candidate Default: Always operating |
| Evaporator - pump - operating message | No | An operating message candidate Default: Always operating |
| Condenser - pump - operating message | No | An operating message candidate Default: Always operating |
| Outlet temperature condenser | No | Required, if condenser shall be analyzed. |
| Outlet temperature evaporator | No | Required, if evaporator shall be analyzed. |
| Outlet temperature setpoint - condenser | No | Required, if condenser shall be analyzed. |
| Outlet temperature setpoint - evaporator | No | Required, if evaporator shall be analyzed. |
| Condenser - Pump - control signal | No | An operating message candidate Default: Always operating |
| Evaporator - pump - control signal | No | An operating message candidate Default: Always operating |
| Attribute | Required | Mapping info | Unit |
|---|---|---|---|
| Outlet temperature setpoint deviation tolerance - condenser | No | Default: 1.5°C | |
| Outlet temperature setpoint deviation tolerance - evaporator | No | Default: 1.5°C |
| Pin | Required | Mapping info |
|---|---|---|
| Operating message | No | An operating message candidate Default: Always operating |
| Evaporator - pump - control signal | No | An operating message candidate Default: Always operating |
| Secondary side - pump - operating message | No | An operating message candidate Default: Always operating |
| Supply temperature - secondary | No | Required, if supply temperature shall be analyzed. |
| Supply temperature setpoint - secondary | No | Required, if supply temperature shall be analyzed. |
| Primary side - valve - control signal | No | Required, if valve position shall be analyzed. |
| Primary side - valve - position | No | Required, if valve position shall be analyzed. |
| Attribute | Required | Mapping info | Unit |
|---|---|---|---|
| Supply temperature setpoint deviation tolerance - secondary | No | Default: 1.5°C | °C |
| Valve position setpoint deviation tolerance - primary | No | Default: 10 % | % |
| Pin | Required | Mapping info |
|---|---|---|
| Hot water temperature | No | Helps to determine the cause of the setpoint deviation. |
| Operating message | No | An operating message candidate Default: Always operating |
| Pump - control signal | No | An operating message candidate Default: Always operating |
| Pump - operating message | No | An operating message candidate Default: Always operating |
| Supply temperature | No | Required, if supply temperature shall be analyzed. |
| Supply temperature setpoint | Yes | - |
| Valve - control signal | No | Helps to determine the cause of the setpoint deviation. |
| Valve - position | No | Helps to determine the cause of the setpoint deviation. |
| Attribute | Required | Mapping info | Unit |
|---|---|---|---|
| Supply temperature setpoint deviation tolerance | No | Default: 1.5°C | °C |
| Valve position setpoint deviation tolerance | No | Default: 10 % | % |
| Pin | Required | Mapping info |
|---|---|---|
| Charging side - Pump - Control signal | No | An operating message candidate for the charging pump |
| Charging side - Pump - Operating message | No | An operating message candidate for the charging pump |
| Charging side - Supply temperature | No | Required, if Charging side - Supply temperature shall be analyzed. Requires operating message of the charging pump. |
| Charging side - Supply temperature setpoint | No | Required, if Charging side - Supply temperature shall be analyzed. Requires operating message of the charging pump. |
| Charging side - Valve - Control signal | No | Required, if Charging side - Valve - Position shall be analyzed. |
| Charging side - Valve - Position | No | Required, if Charging side - Valve - Position shall be analyzed. |
| Circulation side - Pump - Control signal | No | An operating message candidate Default: Always operating |
| Circulation side - Pump - Operating message | No | An operating message candidate Default: Always operating |
| Circulation side - Supply temperature | No | Required, if Circulation side - Supply temperature shall be analyzed. |
| Circulation side - Supply temperature setpoint | No | Required, if Circulation side - Supply temperature shall be analyzed. |
| Circulation side - Valve - Control signal | No | Required, if Circulation side - Valve - Position shall be analyzed. |
| Circulation side - Valve - Position | No | Required, if Circulation side - Valve - Position shall be analyzed. |
| Operating message | No | An operating message candidate Default: Always operating |
| Attribute | Required | Mapping info | Unit |
|---|---|---|---|
| Charging side - Supply temperature setpoint deviation tolerance | No | Default: 1.5°C | °C |
| Charging side - Valve position setpoint deviation tolerance | No | Default: 10 % | % |
| Circulation side - Supply temperature setpoint deviation tolerance | No | Default: 1.5°C | °C |
| Circulation side - Valve position setpoint deviation tolerance | No | Default: 10 % | % |
For the hybrid circuit the different setpoints are checked independently, each referring to the respective operating message of the (sub)-component and the operating mode.
| Pin | Required | Mapping info |
|---|---|---|
| Operating message | No | An operating message candidate Default: Always off |
| Cooling circuit - Operating damper | No | An operating mode candidate |
| Cooling circuit - Pump - Operating message | No | A subcomponent operating message candidate Default: Always off |
| Cooling circuit - Supply temperature | No | Required, if Cooling circuit - Supply temperature shall be analyzed. |
| Cooling circuit - Supply temperature setpoint | No | Required, if Cooling circuit - Supply temperature shall be analyzed. |
| Cooling circuit - Valve - Control signal | No | Required, if Cooling circuit - Valve - Position shall be analyzed. |
| Cooling circuit - Valve - Position | No | Required, if Cooling circuit - Valve - Position shall be analyzed. An operating mode candidate. |
| Heating circuit - Operating damper | No | An operating mode candidate |
| Heating circuit - Pump - Operating message | No | A subcomponent operating message candidate Default: Always off |
| Heating circuit - Supply temperature | No | Required, if Heating circuit - Supply temperature shall be analyzed. |
| Heating circuit - Supply temperature setpoint | No | Required, if Heating circuit - Supply temperature shall be analyzed. |
| Heating circuit - Valve - Control signal | No | Required, if Heating circuit - Valve - Position shall be analyzed. |
| Heating circuit - Valve - Position | No | Required, if Heating circuit - Valve - Position shall be analyzed. An operating mode candidate. |
| Pump - Operating message | No | An operating message candidate Default: Always off |
| Supply temperature | No | Required, if Supply temperature shall be analyzed. |
| Supply temperature setpoint - Cooling | No | Used to analyze Supply temperature during cooling operation. |
| Supply temperature setpoint - Heating | No | Used to analyze Supply temperature during heating operation. |
| Valve - Control signal | No | Required, if Valve - Position shall be analyzed. |
| Valve - Position | No | Required, if Valve - Position shall be analyzed. |
| Attribute | Required | Mapping info | Unit |
|---|---|---|---|
| Cooling circuit - Supply temperature setpoint deviation tolerance | No | Default: 1.5°C | °C |
| Cooling circuit - Valve position setpoint deviation tolerance | No | Default: 10 % | % |
| Heating circuit - Supply temperature setpoint deviation tolerance | No | Default: 1.5°C | °C |
| Heating circuit - Valve position setpoint deviation tolerance | No | Default: 10 % | % |
| Supply temperature setpoint deviation tolerance - Cooling | No | Default: 1.5°C | °C |
| Supply temperature setpoint deviation tolerance - Heating | No | Default: 1.5°C | °C |
| Valve position setpoint deviation tolerance | No | Default: 10 % | % |
| Pin | Required | Mapping info |
|---|---|---|
| Air cooler - Valve - Control signal | No | Compared against "Air cooler - Valve - Position" |
| Air cooler - Valve - Position | No | Compared against "Air cooler - Valve - Control signal" |
| Air heater - Valve - Control signal | No | Compared against "Air heater - Valve - Position" |
| Air heater - Valve - Position | No | Compared against "Air heater - Valve - Control signal" |
| Fan coil unit - Cooling circuit - Valve - Control signal | No | Compared against "Fan coil unit - Cooling circuit - Valve - Position" |
| Fan coil unit - Cooling circuit - Valve - Position | No | Compared against "Fan coil unit - Cooling circuit - Valve - Control signal" |
| Fan coil unit - Heating circuit - Valve - Control signal | No | Compared against "Fan coil unit - Heating circuit - Valve - Position" |
| Fan coil unit - Heating circuit - Valve - Position | No | Compared against "Fan coil unit - Heating circuit - Valve - Control signal" |
| Hybrid static heating/cooling - Valve - Control signal | No | Compared against "Hybrid static heating/cooling - Valve - Position" |
| Hybrid static heating/cooling - Valve - Position | No | Compared against "Hybrid static heating/cooling - Valve - Control signal" |
| Operating message | No | An operating message candidate Default: Always operating |
| Presence | No | An operating message candidate Default: Always operating |
| Room air temperature | No | Compared against "Room air temperature setpoint (calculated)" or against a internally calculated value. |
| Room air temperature setpoint (calculated) | No | Compared against "Room air temperature". If this pin is connected, the comparison is made with this pin. |
| Room temperature base setpoint | No | Used together with "Temperature setpoint adjustment" to internally calculate "Room air temperature setpoint (calculated)". |
| Static cooling - Valve - Control signal | No | Compared against "Static cooling - Valve - Position" |
| Static cooling - Valve - Position | No | Compared against "Static cooling - Valve - Control signal" |
| Static heating - Valve - Control signal | No | Compared against "Static heating - Valve - Position" |
| Static heating - Valve - Position | No | Compared against "Static heating - Valve - Control signal" |
| Supply air temperature | No | Compared against "Supply air temperature setpoint" |
| Supply air temperature setpoint | No | Compared against "Supply air temperature" |
| Temperature setpoint adjustment | No | Used together with "Room temperature base setpoint" to internally calculate "Room air temperature setpoint (calculated)". |
| Volume flow - return air | No | Compared against "Volume flow setpoint - return air" |
| Volume flow - supply air | No | Compared against "Volume flow setpoint - supply air" |
| Volume flow controller - Control signal return air | No | Compared against "Volume flow controller - Position return air" |
| Volume flow controller - Control signal supply air | No | Compared against "Volume flow controller - Position supply air" |
| Volume flow controller - Position return air | No | Compared against "Volume flow controller - Control signal return air" |
| Volume flow controller - Position supply air | No | Compared against "Volume flow controller - Control signal supply air" |
| Volume flow setpoint - return air | No | Compared against "Volume flow - return air" |
| Volume flow setpoint - supply air | No | Compared against "Volume flow - supply air" |
| Attribute | Required | Mapping info | Unit |
|---|---|---|---|
| Air cooler - Valve position setpoint deviation tolerance | No | Default: 10 % | % |
| Air heater - Valve position setpoint deviation tolerance | No | Default: 10 % | % |
| Cooling valve installed | No | Used to determine if component supports cooling mode. Default: no cooling valve installed | - |
| Fan coil unit - Cooling circuit - Valve position setpoint deviation tolerance | No | Default: 10 % | % |
| Fan coil unit - Heating circuit - Valve position setpoint deviation tolerance | No | Default: 10 % | % |
| Hybrid static heating/cooling - Valve position setpoint deviation tolerance | No | Default: 10 % | % |
| Return air damper position setpoint deviation tolerance | No | Default: 10 % | % |
| Return air volume flow setpoint deviation tolerance | No | Default: 10 m3/h | m3/h |
| Static cooling - Valve position setpoint deviation tolerance | No | Default: 10 % | % |
| Static heating - Valve position setpoint deviation tolerance | No | Default: 10 % | % |
| Supply air damper position setpoint deviation tolerance | No | Default: 10 % | % |
| Supply air temperature setpoint deviation tolerance | No | Default: 1.5 K | K |
| Supply air volume flow setpoint deviation tolerance | No | Default: 10 m3/h | m3/h |
| Temperature setpoint deviation tolerance | No | Default: 2.5°C | °C |
| Pin | Required | Mapping info |
|---|---|---|
| Inlet temperature | No | - |
| Operating message | No | An operating message candidate Default: Always operating |
| Outlet temperature | No | Required, if outlet temperature shall be analyzed. |
| Outlet temperature setpoint | No | Required, if outlet temperature shall be analyzed. |
| Pump - control signal | No | An operating message candidate Default: Always operating |
| Pump - operating message | No | An operating message candidate Default: Always operating |
| Valve - control signal | No | Required, if valve position shall be analyzed. |
| Valve - position | No | Required, if valve position shall be analyzed. |
| Attribute | Required | Mapping info | Unit |
|---|---|---|---|
| Outlet temperature setpoint deviation tolerance | No | Default: 1.5°C | °C |
| Valve position setpoint deviation tolerance | No | Default: 10 % | % |
Recommend Time Span
1 day to 1 week
Recommended Repetition
Every week
- After changes of operational modes, e.g., transfers to heating mode
- After changes in the control system
- After maintenance or replacements
Setpoint Plausibility
The Setpoint Plausibility analysis identifies implausible setpoint values for common application of a component. This is achieved by identifying periods for which the setpoints fall outside predefined limits.
Value
- Increase efficiency through better operation
- Improve occupant comfort
Recommended for components
- Rooms
Checked conditions
- Comparison between actual setpoint and typical setpoint for application
In this example, the temperature setpoint of a room changes from 21°C to 16°C (see Figure 1). Since 16°C is below the recommended temperature for rooms, the analysis is evaluated with the signal color "yellow".
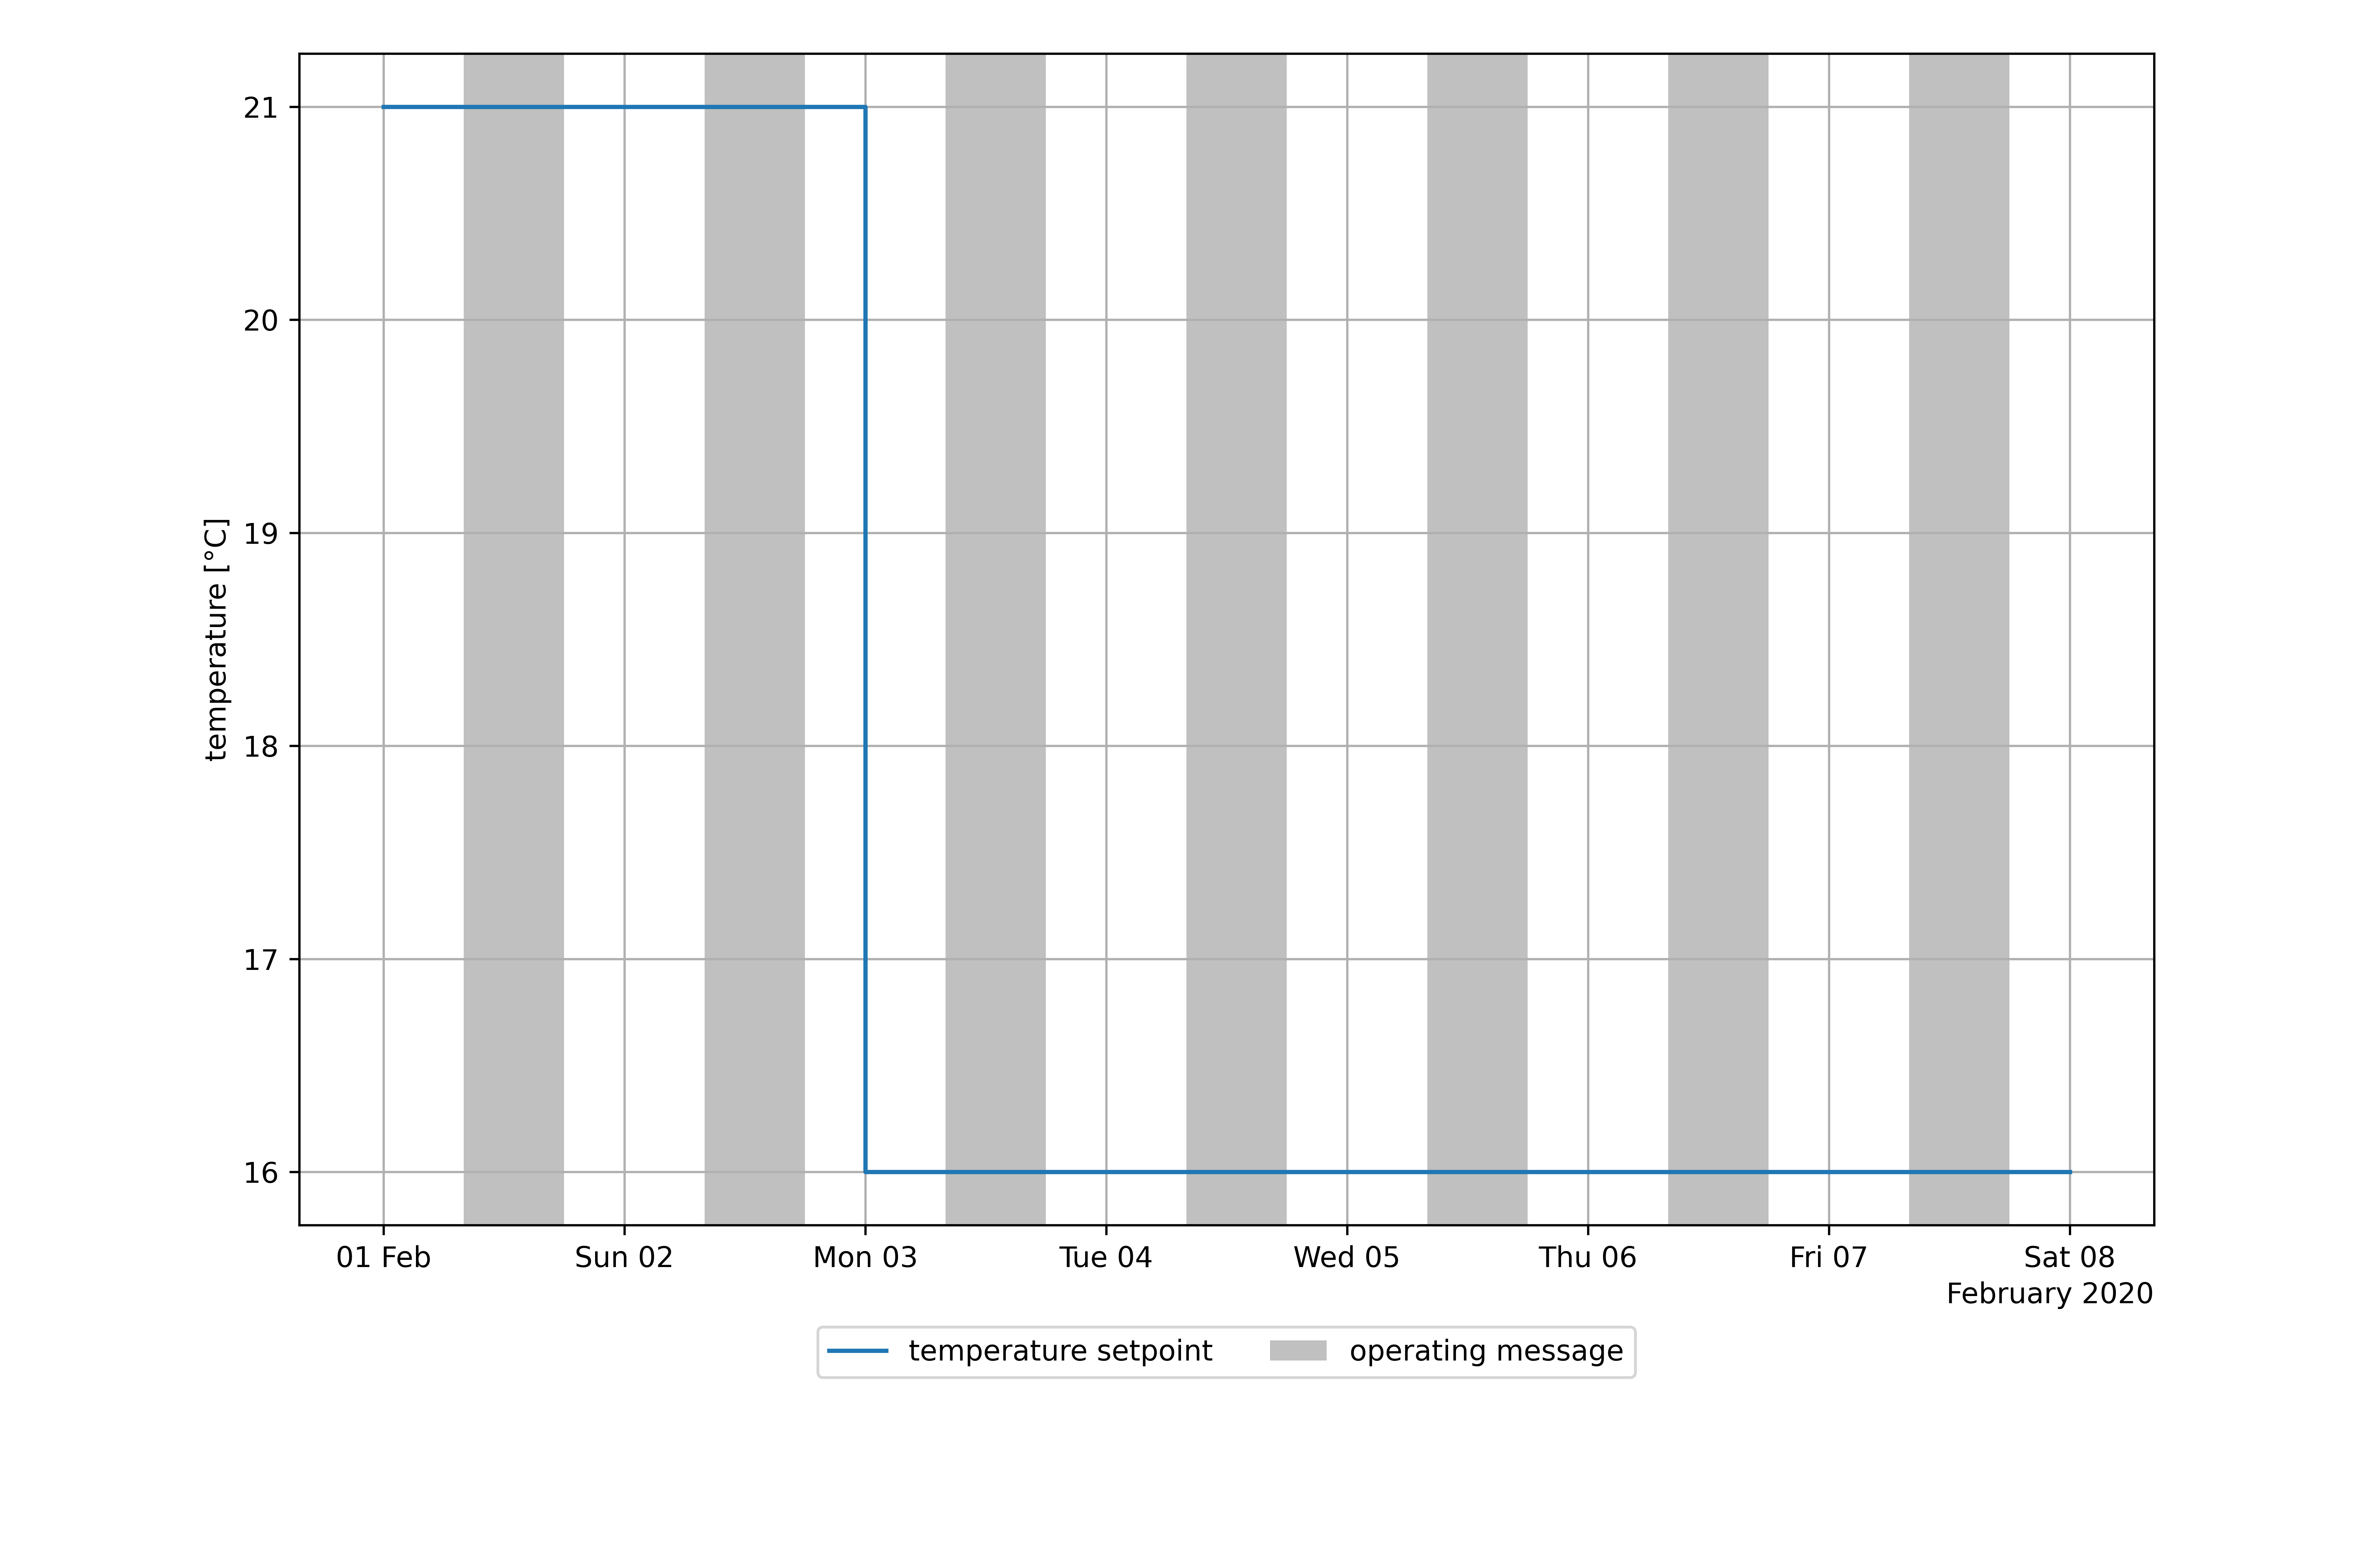
Figure 1: Temperature setpoint of a room for the period of a week.
The reason for a lower limit of temperature setpoints within rooms is that thermal comfort is reduced and the likelihood of condensation and mold forming increases with low room temperatures. Recommendations are made to reset the setpoint to fall within typical setpoint limits for a room to improve operation and thermal comfort.
| KPI | Value | Unit |
|---|---|---|
| operating time | 70.0 | h |
| operating time.relative | 41.7 | % |
| temperature setpoint.above upper setpoint limit.duration | 0.0 | h |
| temperature setpoint.above upper setpoint limit.duration.relative | 0.0 | % |
| temperature setpoint.below lower setpoint limit.duration | 50.0 | h |
| temperature setpoint.below lower setpoint limit.duration.relative | 71.4 | % |
Signal colors
| Signal color | Available | Info |
|---|---|---|
| red | No | - |
| yellow | Yes | Setpoint is outside of the range of setpoints typical for this component for a significant amount of the time. |
| green | Yes | Setpoint is within typical limits for this component. |
Interpretations
| Available | Info |
|---|---|
| Yes | Either the operational rule checks of the analysis were tested positive or not. |
Recommendations
| Available | Info |
|---|---|
| Yes | Recommendations to reset the setpoint so that it falls within the expected range for the component. |
KPIs
<setpoint> refers to the setpoint type. The available setpoint types are "co2" and "temperature".
| KPI Identifier | Info | Value Range | Unit |
|---|---|---|---|
| operating time | Total operating time. | 0 to inf | h |
| operating time.relative | Relative operating time. | 0 to 100 | % |
| <setpoint>.above upper setpoint limit.duration | Total time for which the setpoint is above the upper setpoint limit. | 0 to inf | h |
| <setpoint>.above upper setpoint limit.duration.relative | Total time for which the setpoint is above the upper setpoint limit, relative to the total operating time. | 0 to 100 | % |
| <setpoint>.below lower setpoint limit.duration | Total time for which the setpoint is below the lower limit. | 0 to inf | h |
| <setpoint>.below lower setpoint limit.duration.relative | Total time for which the setpoint is below the lower limit, relative to the total operating time. | 0 to 100 | % |
| Pin | Required | Mapping info |
|---|---|---|
| CO2 setpoint | No | - |
| Temperature setpoint | No | - |
| Operating message | No | Mapping strongly recommended. Default: Always operating |
Recommend Time Span
1 day to 1 week
Recommended Repetition
Every week
- After changes of operational modes, e.g., transfers to heating mode
- After changes in the control system
- After maintenance or replacements
System Control
The System Control analysis detects whether the operation of the analyzed components is synchronized correctly. E.g., the pump of a thermal control loop is operating while the 2-way valve is closed or rather almost closed. If pumps continue to be operated with the valve closed, this leads to unnecessary power consumption and higher wear of the pump due to the additional running time. A valve opening of 5 % or less is considered as closed.
Value
- Reduce energy cost
- Increase lifespan of pumps in heating and cooling circuits
- Check the interaction between system and pump during switch operations of the system
Recommended for components
Any fluid supply system, such as
- Thermal control loop with valve and pump
- Boiler with pump
- Combined heat and power unit with pump
- Heat pump with evaporator/condenser feeding pumps
- Heating or cooling circuits
- Heat transfer units for district heating
- Hybrid circuits for heating and cooling operation
Checked conditions
- Pump is still operating although the two-way valve is closed
- Pump is still operating although system is shut off
- Condition checks on times of components operation
- Parallel heating and cooling operation
For this example, we use a heating circuit with a 2-way-valve.
Figure 1 shows the pump operating message and valve position of a thermal control loop. During the analysis period, the valve position lies between 0 and 20 %. With the KPI pump operating time.valve closed.relative we can estimate that the valve is nearly closed for ~40 % of the operating time.
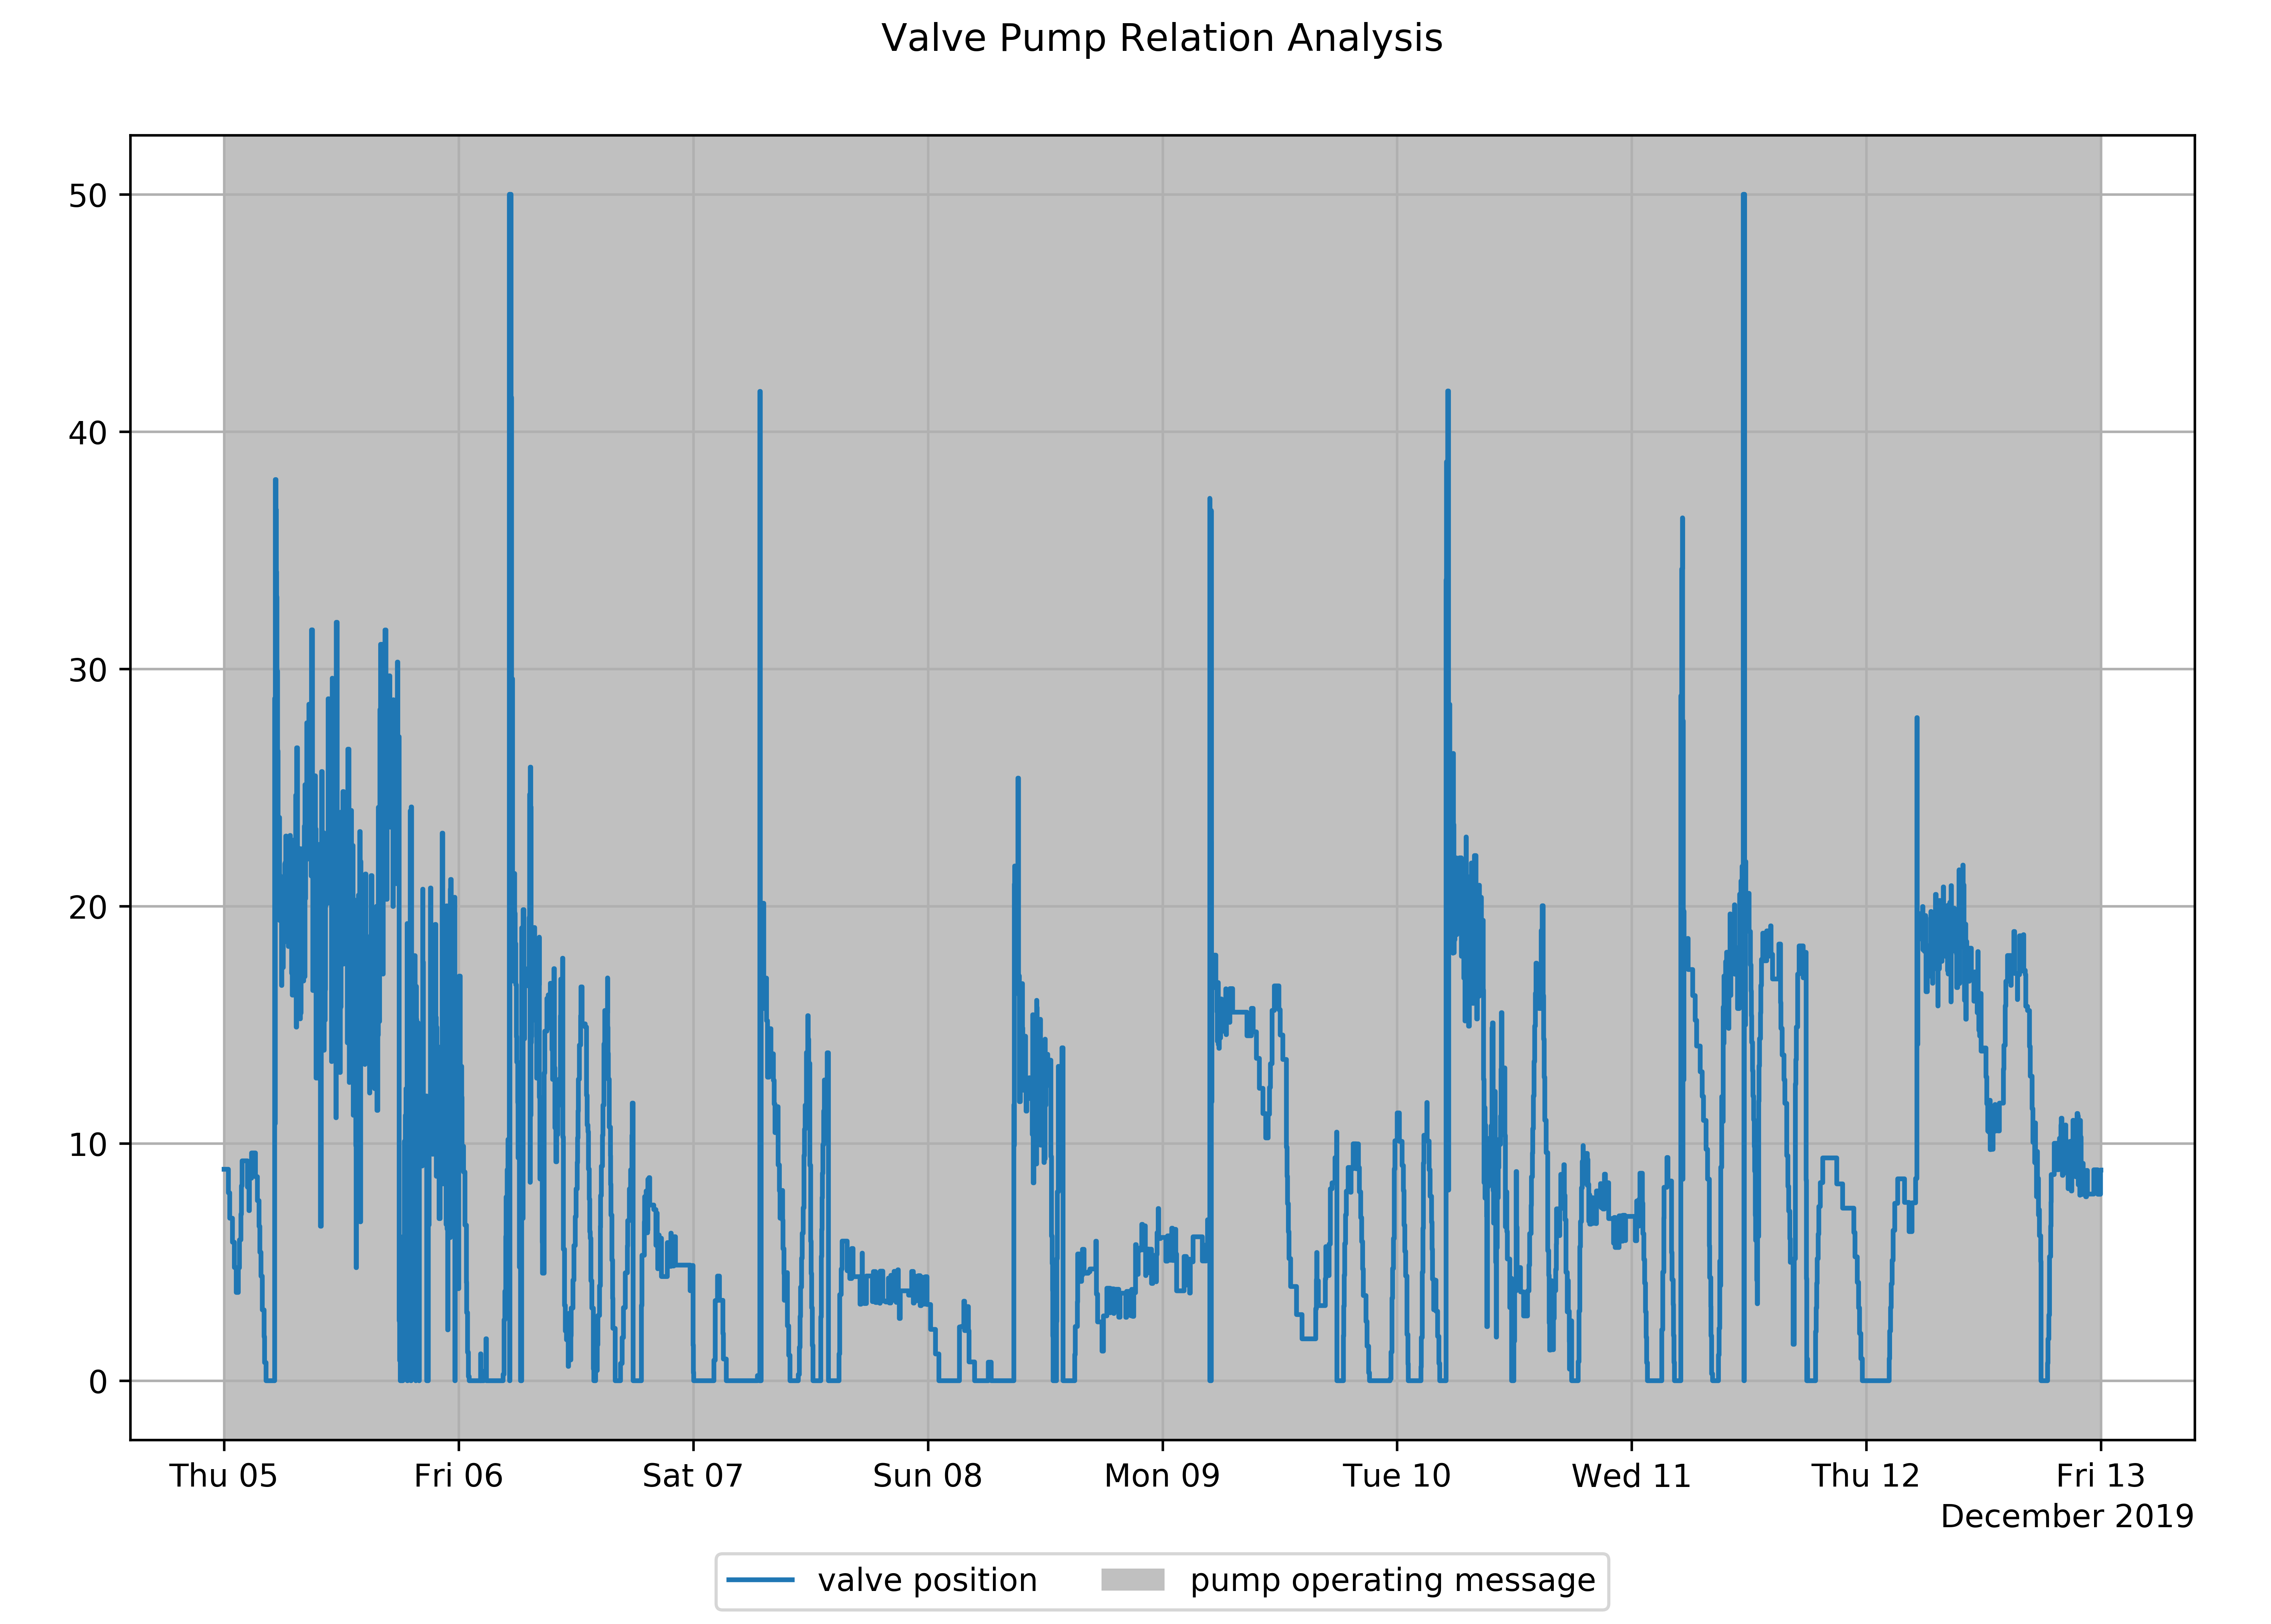
Figure 1: Valve position and pump operating message
| KPI | Value | Unit |
|---|---|---|
| pump operating time.valve closed.relative | 39.7 | % |
| pump operating time.valve closed | 76.2 | h |
| pump operating time.relative | 100 | % |
Signal colors
| Signal color | Available | Info |
|---|---|---|
| red | Yes | High operation times of the pump while 2-way valve is closed. |
| yellow | Yes | Operation times of the pump while valves are closed or system is shut off. |
| green | Yes | Sufficient synchronization between pump and system. |
Interpretations
| Available | Info |
|---|---|
| Yes | Interpretations summarize the result of the analysis. |
Recommendations
| Available | Info |
|---|---|
| Yes | Recommendations to improve the synchronized operation of components. No recommendation, if components are synchronized correctly. |
KPIs
Hydraulic components with pump and valve
| KPI Identifier | Info | Value Range | Unit |
|---|---|---|---|
| pump operating time.valve closed.relative | Percentage of time the pump is active while the 2-way valve is nearly closed based on total operating time | 0 to 100 | % |
| pump operating time.valve closed | The amount of time the pump is active while the 2-way valve is nearly closed | 0 to inf | h |
| pump operating time.during off state.relative | Percentage of time the pump is active while the 3-way valve is nearly closed based on total operating time | 0 to 100 | % |
| pump operating time.during off state | The amount of time the pump is active while the 3-way valve is nearly closed | 0 to inf | h |
| pump operating time.relative | Percentage of time the pump is active based on the whole analysis period | 0 to 100 | % |
| pump operating time | Time the pump is active based on the whole analysis period | 0 to inf | h |
Hydraulic components with pump
| KPI Identifier | Info | Value Range | Unit |
|---|---|---|---|
| operating time.relative | Percentage of time the system is running based on the total analysis period | 0 to 100 | % |
| operating time | The amount of time the system is running | 0 to inf | h |
| pump operating time.outside of operation.relative | Percentage of time the pump is active while the system is shut off | 0 to 100 | % |
| pump operating time.outside of operation | The amount of time the pump is active while the system is shut off | 0 to inf | h |
| pump operating time | The amount of time the pump is active | 0 to inf | h |
Component specific system control checks
<condition> refers to the faulty operation, which is defined for the specific component.
Examples for faulty operations are:
- Parallel heating and cooling in a hybrid circuit
- Circulation pump is not running in a hot water storage
| KPI Identifier | Info | Value Range | Unit |
|---|---|---|---|
| duration.faulty synchronized operation.<condition> | The amount of time the system runs in a faulty mode | 0 to inf | h |
| duration.faulty synchronized operation.relative.<condition> | Percentage of time the system is runs in a faulty mode based on the total analysis period | 0 to 100 | % |
| Pin | Required | Mapping info |
|---|---|---|
| Operating message | No | An operating message candidate |
| Pump - control signal | No | An operating message candidate |
| Pump - operating message | No | An operating message candidate |
| Valve - position | No | Mapping of either valve position (preferred) or valve position setpoint is mandatory. If both pins are mapped, the valve position is used. |
| Valve - control signal | No | Mapping of either valve position (preferred) or valve position setpoint is mandatory. If both pins are mapped, the valve position is used. |
| Attribute | Required | Mapping info |
|---|---|---|
| Valve type | No | Default: 2-way valve |
| Pin | Required | Mapping info |
|---|---|---|
| Operating message | No | An operating message candidate |
| Pump - control signal | No | An operating message candidate |
| Pump - operating message | No | An operating message candidate |
| Valve - position | No | Mapping of either valve position (preferred) or valve position setpoint is mandatory. If both pins are mapped, the valve position is used. |
| Valve - control signal | No | Mapping of either valve position (preferred) or valve position setpoint is mandatory. If both pins are mapped, the valve position is used. |
| Attribute | Required | Mapping info |
|---|---|---|
| Valve type | No | Default: 3-way valve |
| Pin | Required | Mapping info |
|---|---|---|
| Operating message | Yes | General operating message of the boiler unit. |
| Pump - control signal | No | A pump - operating message candidate Default: Always on |
| Pump - operating message | No | A pump - operating message candidate Default: Always on |
| Pin | Required | Mapping info |
|---|---|---|
| Operating message | Yes | General operating message of the compression chiller. |
| Condenser - pump - operating message | No | At least one pump - operating message has to be connected. |
| Evaporator - pump - operating message | No | At least one pump - operating message has to be connected. |
| Condenser - Pump - control signal | No | At least one pump - operating message has to be connected. |
| Evaporator - pump - control signal | No | At least one pump - operating message has to be connected. |
| Pin | Required | Mapping info |
|---|---|---|
| Operating message | No | An operating message candidate |
| Pump - control signal | No | An operating message candidate |
| Pump - operating message | No | An operating message candidate |
| Valve - position | No | Mapping of either valve position (preferred) or valve position setpoint is mandatory. If both pins are mapped, the valve position is used. |
| Valve - control signal | No | Mapping of either valve position (preferred) or valve position setpoint is mandatory. If both pins are mapped, the valve position is used. |
| Attribute | Required | Mapping info |
|---|---|---|
| Valve type | No | Default: 2-way valve |
| Pin | Required | Mapping info |
|---|---|---|
| Operating message | Yes | General operating message of the heat pump. |
| Condenser - pump - operating message | No | At least one pump - operating message has to be connected. |
| Evaporator - pump - operating message | No | At least one pump - operating message has to be connected. |
| Condenser - Pump - control signal | No | At least one pump - operating message has to be connected. |
| Evaporator - pump - control signal | No | At least one pump - operating message has to be connected. |
For the heat transfer unit the secondary side and the primary side are analyzed separately.
In case of district heating, the pump on the secondary side is evaluated against the valve on the primary side.
| Pin | Required | Mapping info |
|---|---|---|
| Primary side - pump - control signal | No | An operating message candidate for the primary side |
| Primary side - pump - operating message | No | An operating message candidate for the primary side |
| Primary side - valve - position | No | Mapping of either valve position - primary (preferred) or valve position setpoint - primary is mandatory. If both pins are mapped, the valve position is used. |
| Primary side - valve - control signal | No | Mapping of either valve position - primary (preferred) or valve position setpoint - primary is mandatory. If both pins are mapped, the valve position is used. |
| Operating message | No | An operating message candidate for the secondary side |
| Secondary side - pump - control signal | No | An operating message candidate for the secondary side |
| Secondary side - pump - operating message | No | An operating message candidate for the secondary side |
| Secondary side - valve - position | No | Mapping of either valve position - secondary (preferred) or valve position setpoint - secondary is mandatory. If both pins are mapped, the valve position is used. |
| Secondary side - valve - control signal | No | Mapping of either valve position - secondary (preferred) or valve position setpoint - secondary is mandatory. If both pins are mapped, the valve position is used. |
| Attribute | Required | Mapping info |
|---|---|---|
| Valve type - primary | No | Default: 2-way valve |
| Valve type - secondary | No | Default: 2-way valve |
| Pin | Required | Mapping info |
|---|---|---|
| Operating message | No | An operating message candidate |
| Pump - control signal | No | An operating message candidate |
| Pump - operating message | No | An operating message candidate |
| Valve - position | No | Mapping of either valve position (preferred) or valve position setpoint is mandatory. If both pins are mapped, the valve position is used. |
| Valve - control signal | No | Mapping of either valve position (preferred) or valve position setpoint is mandatory. If both pins are mapped, the valve position is used. |
| Attribute | Required | Mapping info |
|---|---|---|
| Valve type | No | Default: 3-way valve |
For the hot water storage different conditions are checked independently, each referring to the respective operating message of the (sub)-component:
- Circulation pump is off
- Faulty on-off control of the charging pump, based on the upper storage temperature
| Pin | Required | Mapping info |
|---|---|---|
| Operating message | No | An operating message candidate Default: Always on |
| Charging side - Pump - Operating message | No | An operating message candidate for the charging pump |
| Charging side - Pump - Control signal | No | An operating message candidate for the charging pump |
| Circulation side - Pump - Operating message | No | An operating message candidate for the circulation pump |
| Circulation side - Pump - Control signal | No | An operating message candidate for the circulation pump |
| Upper storage temperature | No | Used to calculate on-off control of the charging pump. |
| Upper storage temperature hysteresis | No | Used to calculate on-off control of the charging pump. |
| Upper storage temperature lower limit | No | Used to calculate on-off control of the charging pump. |
| Attribute | Required | Mapping info |
|---|---|---|
| Upper storage temperature hysteresis | No | Used to calculate on-off control of the charging pump. Default: 2 K |
| Upper storage temperature lower limit | No | Used to calculate on-off control of the charging pump. Default: 60 °C |
For the hybrid circuit different conditions are checked independently, each referring to the respective operating message of the (sub)-component and the active operating mode:
- Parallel heating and cooling operation
- Faulty synchronized subcomponent operation with operating mode
- Faulty synchronized valve position with operating damper
| Pin | Required | Mapping info |
|---|---|---|
| Operating message | No | An operating message candidate Default: Always off |
| Cooling circuit - Pump - Operating message | No | A subcomponent operating message candidate Default: Always off |
| Cooling circuit - Operating damper | No | An operating mode candidate |
| Cooling circuit - Valve - Position | No | An operating mode candidate |
| Heating circuit - Pump - Operating message | No | A subcomponent operating message candidate Default: Always off |
| Heating circuit - Operating damper | No | An operating mode candidate |
| Heating circuit - Valve - Position | No | An operating mode candidate |
| Pump - operating message | No | An operating message candidate |
For the Room component the two subcomponents air cooler and air heater are checked independently for faulty synchronization of the respective pump and valve operation. If both subcomponents are present, there is an additional check for faulty parallel heating and cooling operation.
| Pin | Required | Mapping info |
|---|---|---|
| Air cooler - Operating message | No | An operating message candidate for the air cooler |
| Air cooler - Pump - Control signal | No | An operating message candidate for the air cooler pump |
| Air cooler - Pump - Operating message | No | An operating message candidate for the air cooler pump |
| Air cooler - Pump - Position | No | An operating message candidate for the air cooler pump |
| Air cooler - Valve - Control signal | No | Mapping of either valve position (preferred) or valve control signal is mandatory. If both pins are mapped, the valve position is used. |
| Air cooler - Valve - Position | No | Mapping of either valve position (preferred) or valve control signal is mandatory. If both pins are mapped, the valve position is used. |
| Air heater - Operating message | No | An operating message candidate for the air heater |
| Air heater - Pump - Control signal | No | An operating message candidate for the air heater pump |
| Air heater - Pump - Operating message | No | An operating message candidate for the air heater pump |
| Air heater - Pump - Position | No | An operating message candidate for the air heater pump |
| Air heater - Valve - Control signal | No | Mapping of either valve position (preferred) or valve control signal is mandatory. If both pins are mapped, the valve position is used. |
| Air heater - Valve - Position | No | Mapping of either valve position (preferred) or valve control signal is mandatory. If both pins are mapped, the valve position is used. |
| Operating message | No | An operating message candidate Default: Always operating |
| Presence | No | An operating message candidate Default: Always operating |
| Attribute | Required | Mapping info |
|---|---|---|
| Air cooler - Valve threshold | No | Default: 5 % |
| Air cooler - Valve type | No | Default: 2-way valve |
| Air heater - Valve threshold | No | Default: 5 % |
| Air heater - Valve type | No | Default: 3-way valve |
| Pin | Required | Mapping info |
|---|---|---|
| Operating message | No | An operating message candidate |
| Pump - control signal | No | An operating message candidate |
| Pump - operating message | No | An operating message candidate |
| Valve - position | No | Mapping of either valve position (preferred) or valve position setpoint is mandatory. If both pins are mapped, the valve position is used. |
| Valve - control signal | No | Mapping of either valve position (preferred) or valve position setpoint is mandatory. If both pins are mapped, the valve position is used. |
| Attribute | Required | Mapping info |
|---|---|---|
| Valve type | No | Default: 3-way valve |
Recommend Time Span
1 week
Recommended Repetition
Every 3 months
- After changes of operational modes, e.g., transfers to heating mode
- After changes in the control system
- After maintenance or replacements
Technical Availability
The Technical Availability analysis aggregates all system components in the project in order to determine the over all technical availability. The calculated KPIs of the analysis are related to the operating states of the system components.
Value
- Insights into the reliability of the technical equipment of the building
- Benchmarking of the technical availability
- Reporting and monitoring technical availability
Recommended for components
Complete buildings or energy systems
Checked conditions
- Downtimes of the systems
This example shows the results of an Technical Availability analysis displayed in the Asset Overview.
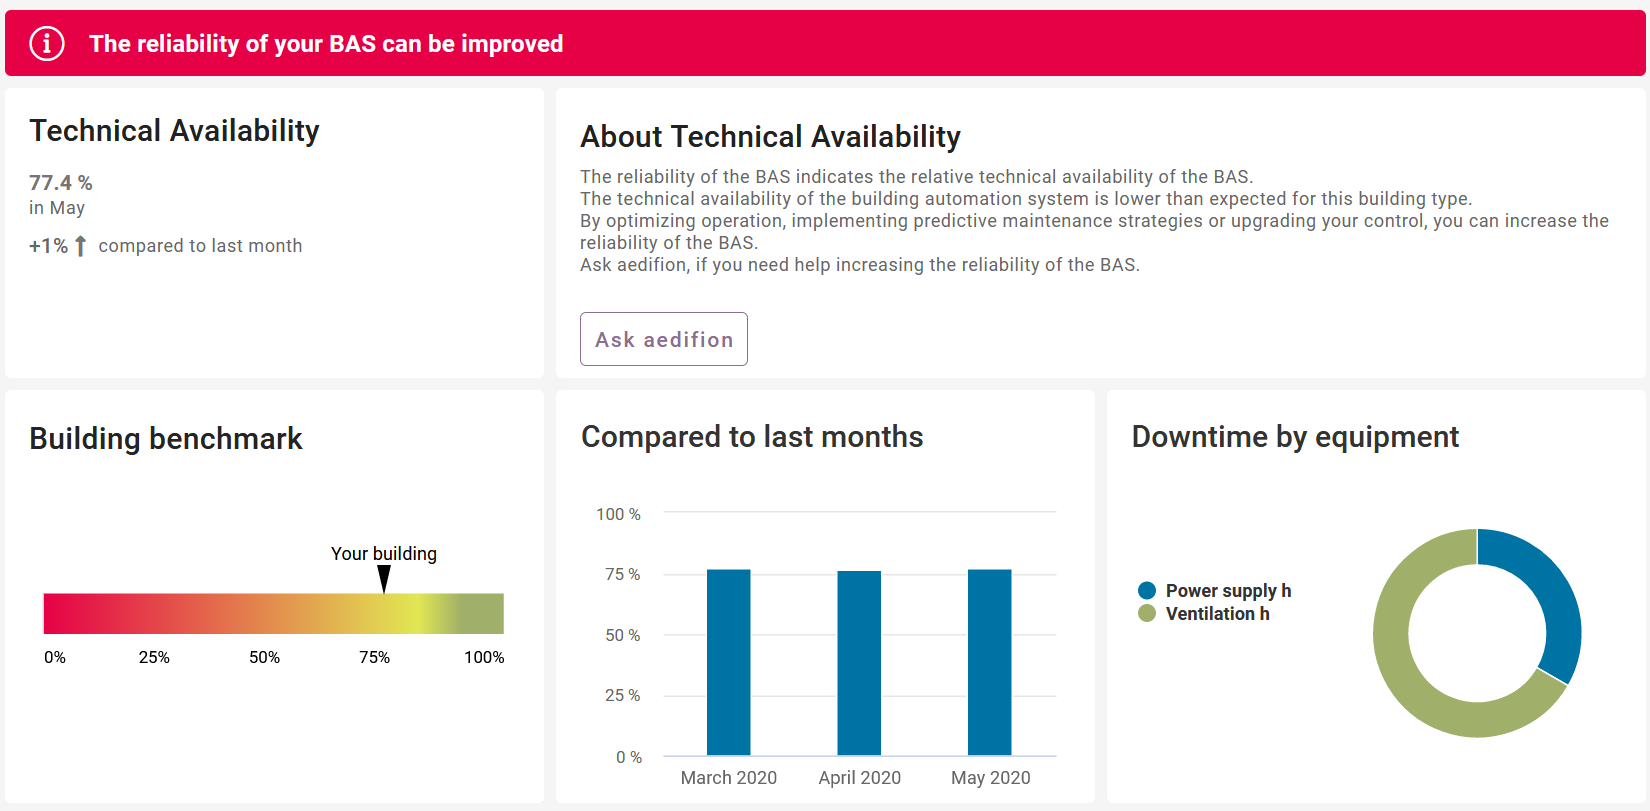
Figure 1: Technical availability Asset Overview result overview
Above all cards the interpretation text of the result is highlighted with the signal color of the result. In the top left the current KPI and the monthly trend is shown. On the right side of that you will find the recommendations of this result as well as further information about the function.
The three plots below are:
- The building benchmark
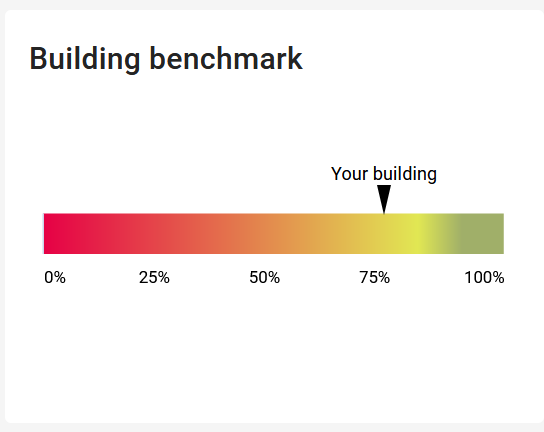
Figure 2: Technical availability Asset Overview plot bullet graph
The current KPI is plotted inside a bullet graph between the limits of the signal color.
- Compared to last months
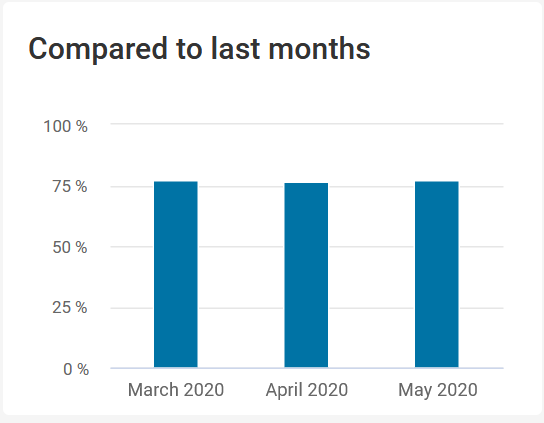
Figure 3: Technical availability Asset Overview plot month comparison
The plot shows the current KPI of the last three months, including the month of the analysis.
- By downtime source
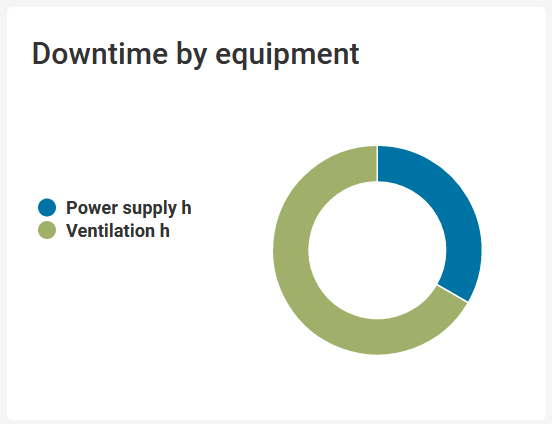
Figure 4: Technical availability Asset Overview plot downtime source
The plot shows the downtime by equipment for all systems.
Signal colors
| Signal color | Available | Info |
|---|---|---|
| red | Yes | Technical availability significantly reduced for this building. |
| yellow | Yes | Technical availability reduced for this building. |
| green | Yes | Technical availability as expected for this building. |
Interpretations
| Available | Info |
|---|---|
| Yes | Interpretations summarize the result of the analysis. |
Recommendations
| Available | Info |
|---|---|
| Yes | Info text and recommendation for action. |
KPIs
Summary KPI
| KPI reference | Info | Value Range | Unit |
|---|---|---|---|
| current | Technical availabilty | 0 to 100 | % |
| development | Change in technical availability compared to last analysis period | -inf to inf | % |
Timeseries
The timeseries is saved as a virtual datapoint. Every run of the analysis will add the summary KPI (current value) as an observation at the start of the analysis period to the timeseries.
| Timeseries datapointID | Info | Unit |
|---|---|---|
| {project_id}_{instance_id}_technical_availability | Technical availability timeseries | % |
Plots
| Identifier | Type | Info | Unit |
|---|---|---|---|
| benchmark | bullet_graph | Benchmarking including color scale Default: Based engineering review | % |
| month_comparison | bar_chart | Technical availability of the last 3 months | €/m2/M |
| down_time | pie_chart | Technical downtime by energy source | h |
| Pin | Required | Mapping info | Unit |
|---|---|---|---|
| - | - | - | - |
| Attribute | Required | Mapping info | Unit |
|---|---|---|---|
| - | - | - | - |
Sub-components
At leat one sub-component is needed to get a result for this analysis function.
| Pin | Required | Mapping info |
|---|---|---|
| Operational state | Yes | Operational state according to aedifion definition |
| Attribute | Required | Mapping info | Unit |
|---|---|---|---|
| - | - | - | - |
Recommend Time Span
1 month
Recommended Repetition
Monthly
- Continuously monitor technical availability
- Track success of a anti-fault measures
Temperature Adjustment Savings
The Temperature Adjustment Savings analysis estimates the yearly savings potential in one entire building for measures that influence the room temperature. See Savings potential for how this fits the general pattern. It uses the energy consumption during the reference period to estimate the specific energy consumption per degree-day. The savings are calculated for a typical year based on the reference period. Moreover, the analysis extrapolates the savings potential into the future by comparing the reference period to the analysis period. The adjustment is calculated between the room temperature that is measured or given as an attribute and the optimal room temperature derived from the outside air temperature. The optimal temperature is either a user input or derived automatically from the measures that are set in the project. At the moment we can separate between heat energy, cold energy and electric energy.
Value
- Yearly static savings potential by comparing the reference period to an optimal room temperature
- Yearly extrapolated savings potential by adjusting the room temperature
Recommended for components
- Building
Checked conditions
- Is there an average room temperature that can be compared to an optimal temperature?
- Are there .controls apps WASP or CURVE, including night time reduction, active in the project and will influence the temperature?
- Has the user selected attributes for local optimization measures including heating curve optimizations or night time reduction?
The following examples are both for a building with an area of 22,000 m2 that is in heating mode. The reference period is the year 2024 with a reference consumption of 60 kWh/m2. The user sets 22 °C in the attribute Reference room temperature. The user sets 2025-01-01 in the attribute Reference period end and 2024-01-01 in the Reference period start. In these examples, the analysis period is irrelevant and set to January 2025.
-
The optimal room temperature is 21 °C. The user sets 21 °C in the attribute Reference optimum room temperature. The user sets "Not being used" in the attributes Heating or cooling curve, WASP and Night reduction. The analysis is evaluated with the signal color "green". The KPI yearly static savings potential.energy is 195,600 kWh.
-
There is a WASP .controls app in the project. The local heating curve in the automation system was optimized. There is no night reduction. The user sets "Not being used" in the attribute Night reduction and "Set in the local automation system" in the attribute Heating or cooling curve. The user sets "Automatic detection in aedifion .controls" in the attribute WASP. The user removes the previous value from the attribute Reference optimum room temperature. The analysis is evaluated with the signal color "green". The KPI yearly static savings potential.energy is 117,400 kWh.
Signal colors
| Signal color | Available | Info |
|---|---|---|
| red | No | - |
| yellow | Yes | There is almost no saving potential and no savings measures have been set, yet |
| green | Yes | There is a significant saving potential or there is at least one saving measure implemented, though it may still not have lead to significant saving potential |
Interpretations
| Available | Info |
|---|---|
| Yes | Interpretations summarize the result of the analysis. |
Recommendations
| Available | Info |
|---|---|
| Yes | Info text and recommendation for action. |
KPIs
Active optimization measures
| KPI Identifier | Info | Value Range | Unit |
|---|---|---|---|
| Optimization Heating curve | - | 0 or 1 | - |
| Optimization WASP | - | 0 or 1 | - |
| Optimization Night time setback | - | 0 or 1 | - |
climate normal year
| KPI Identifier | Info | Value Range | Unit |
|---|---|---|---|
| climate normal year.cooling degree days | - | 0 to inf | °Cd |
| climate normal year.energy consumption.cold energy | - | 0 to inf | kWh |
| climate normal year.energy consumption.heat energy | - | 0 to inf | kWh |
| climate normal year.heating degree days | - | 0 to inf | °Cd |
Reference period
| KPI Identifier | Info | Value Range | Unit |
|---|---|---|---|
| reference period.energy consumption.heat energy.specific per degree-day | - | 0 to inf | kWh/°Cd |
| reference period.heating degree days.optimal room temperature | - | 0 to inf | °Cd |
| reference period.heating degree days.room temperature | - | 0 to inf | °Cd |
| reference period.savings potential.heat energy.relative | - | 0 to 100 | % |
| reference period.savings potential.cold energy.relative | - | 0 to 100 | % |
Analysis period
| KPI Identifier | Info | Value Range | Unit |
|---|---|---|---|
| analysis period.heating degree days.optimal room temperature | - | 0 to inf | °Cd |
| analysis period.heating degree days.room temperature | - | 0 to inf | °Cd |
Energy factor KPIs
| KPI Identifier | Info | Value Range | Unit |
|---|---|---|---|
| CO2 emission factor.cold | CO2 emission factor of thermal cold | 0 to inf | kg/kWh |
| CO2 emission factor.electricity | CO2 emission factor of electricity | 0 to inf | kg/kWh |
| CO2 emission factor.heat | CO2 emission factor of thermal heat | 0 to inf | kg/kWh |
| energy price.cold | Energy price of thermal cold | 0 to inf | €/kWh |
| energy price.electricity | Energy price of electricity | 0 to inf | €/kWh |
| energy price.heat | Energy price of thermal heat | 0 to inf | €/kWh |
Savings extrapolated into the future
| KPI Identifier | Info | Value Range | Unit |
|---|---|---|---|
| yearly extrapolated savings potential.CO2 emissions cold | - | 0 to inf | kg |
| yearly extrapolated savings potential.CO2 emissions electricity | - | 0 to inf | kg |
| yearly extrapolated savings potential.CO2 emissions energy | - | 0 to inf | kg |
| yearly extrapolated savings potential.CO2 emissions heat | - | 0 to inf | kg |
| yearly extrapolated savings potential.cold cost | - | 0 to inf | € |
| yearly extrapolated savings potential.cold energy | - | 0 to inf | kWh |
| yearly extrapolated savings potential.electric energy | - | 0 to inf | kWh |
| yearly extrapolated savings potential.electricity cost | - | 0 to inf | € |
| yearly extrapolated savings potential.energy | - | 0 to inf | kWh |
| yearly extrapolated savings potential.energy cost | - | 0 to inf | € |
| yearly extrapolated savings potential.heat cost | - | 0 to inf | € |
| yearly extrapolated savings potential.heat energy | - | 0 to inf | kWh |
Savings based on reference
| KPI Identifier | Info | Value Range | Unit |
|---|---|---|---|
| yearly static savings potential.CO2 emissions cold | - | 0 to inf | kg |
| yearly static savings potential.CO2 emissions electricity | - | 0 to inf | kg |
| yearly static savings potential.CO2 emissions energy | - | 0 to inf | kg |
| yearly static savings potential.CO2 emissions heat | - | 0 to inf | kg |
| yearly static savings potential.cold cost | - | 0 to inf | € |
| yearly static savings potential.cold energy | - | 0 to inf | kWh |
| yearly static savings potential.electric energy | - | 0 to inf | kWh |
| yearly static savings potential.electricity cost | - | 0 to inf | € |
| yearly static savings potential.energy | - | 0 to inf | kWh |
| yearly static savings potential.energy cost | - | 0 to inf | € |
| yearly static savings potential.heat cost | - | 0 to inf | € |
| yearly static savings potential.heat energy | - | 0 to inf | kWh |
| Pin | Required | Mapping info | Unit |
|---|---|---|---|
| - | - | - | - |
| Attribute | Required | Mapping info | Unit |
|---|---|---|---|
| Automatic calculation of average room air temperature | No | - | - |
| CO2 emission factor cold | No | - | kgCO2/kWh |
| CO2 emission factor electricity | No | - | kgCO2/kWh |
| CO2 emission factor heat | No | - | kgCO2/kWh |
| Cold price | No | - | €/kWh |
| (Advanced) Cooling limit temperature | No | - | °C |
| Electricity price | No | - | €/kWh |
| Heat price | No | Needed for heat cost calculation | €/kWh |
| Heating limit temperature | No | - | °C |
| Heating or cooling curve | No | Choose from dropdown if local, automatic or not used | - |
| (Advanced) Minimal temperature difference | No | Long-term difference due to optimizations | \(\Delta\)K |
| (Advanced) Minimal temperature spread | No | Daily spread due to night reduction | \(\Delta\)K |
| Net floor area | Yes | Needed for Reference specific heat consumption | m2 |
| Night reduction | No | Choose from dropdown if local, automatic or not used | - |
| (Advanced) Operating mode | No | Choose from dropdown if heating or cooling mode | - |
| (Advanced) Reference cooling limit temperature | No | - | °C |
| Reference specific heat consumption | No | - | kWh/m2 |
| Reference heating limit temperature | No | - | °C |
| Reference optimum room temperature | No | - | °C |
| Reference period end | Yes | Date as string "2022-01-01" | string |
| Reference period start | Yes | Date as string "2023-01-01" | string |
| Reference room temperature | No | - | °C |
| Reference specific heat consumption | No | Overwrite energy consumption calculation from energy meters | kWh/m2 |
| Reference specific heat consumption | No | Set energy consumption instead of energy meters | kWh/m2 |
| Room temperature | No | - | °C |
| WASP | No | Choose from dropdown if local, automatic or not used | - |
Sub-components
In order to automatically calculate the energy consumption during the reference period the energy meters for gas and heat can be used. Alternatively you can set the attribute for the specific energy consumption.
| Pin | Required | Mapping info |
|---|---|---|
| Gas quantity | Yes | Cumulating timeseries in m3 |
| Attribute | Required | Mapping info | Unit |
|---|---|---|---|
| Calorific value of natural gas | No | Change to calorific value of delivered natural gas. Default: 13 kWh/m3 | kWh/m3 |
| Cost measurement device | Yes | Set to 'True' if this component should be considered in this analysis | binary |
| Pressure compensation factor of natural gas | No | Additional factor to compensate for elevation and line pressure at the termination point. Default: 1 | - |
| Pin | Required | Mapping info |
|---|---|---|
| Heating energy | Yes | Cumulating timeseries in kWh |
| Attribute | Required | Mapping info | Unit |
|---|---|---|---|
| Cost measurement device | Yes | Set to 'True' if this component should be considered in this analysis | binary |
Recommend Time Span
> 1 month
Recommended Repetition
on demand
- Track success of implemented measures influencing the room temperatures
Temperature Efficiency
The Temperature efficiency analysis determines the thermal efficiency of a heat recovery system and compares the efficiency to a reference value. These reference values can be derived from industry standards or the data sheet of the air handling unit. Low temperature efficiency values may indicate fouling or an overall bad quality of the heat recovery process.
Figure 1 shows a scheme of a heat recovery system (HRCS) and the temperatures of the ingoing and outgoing air.
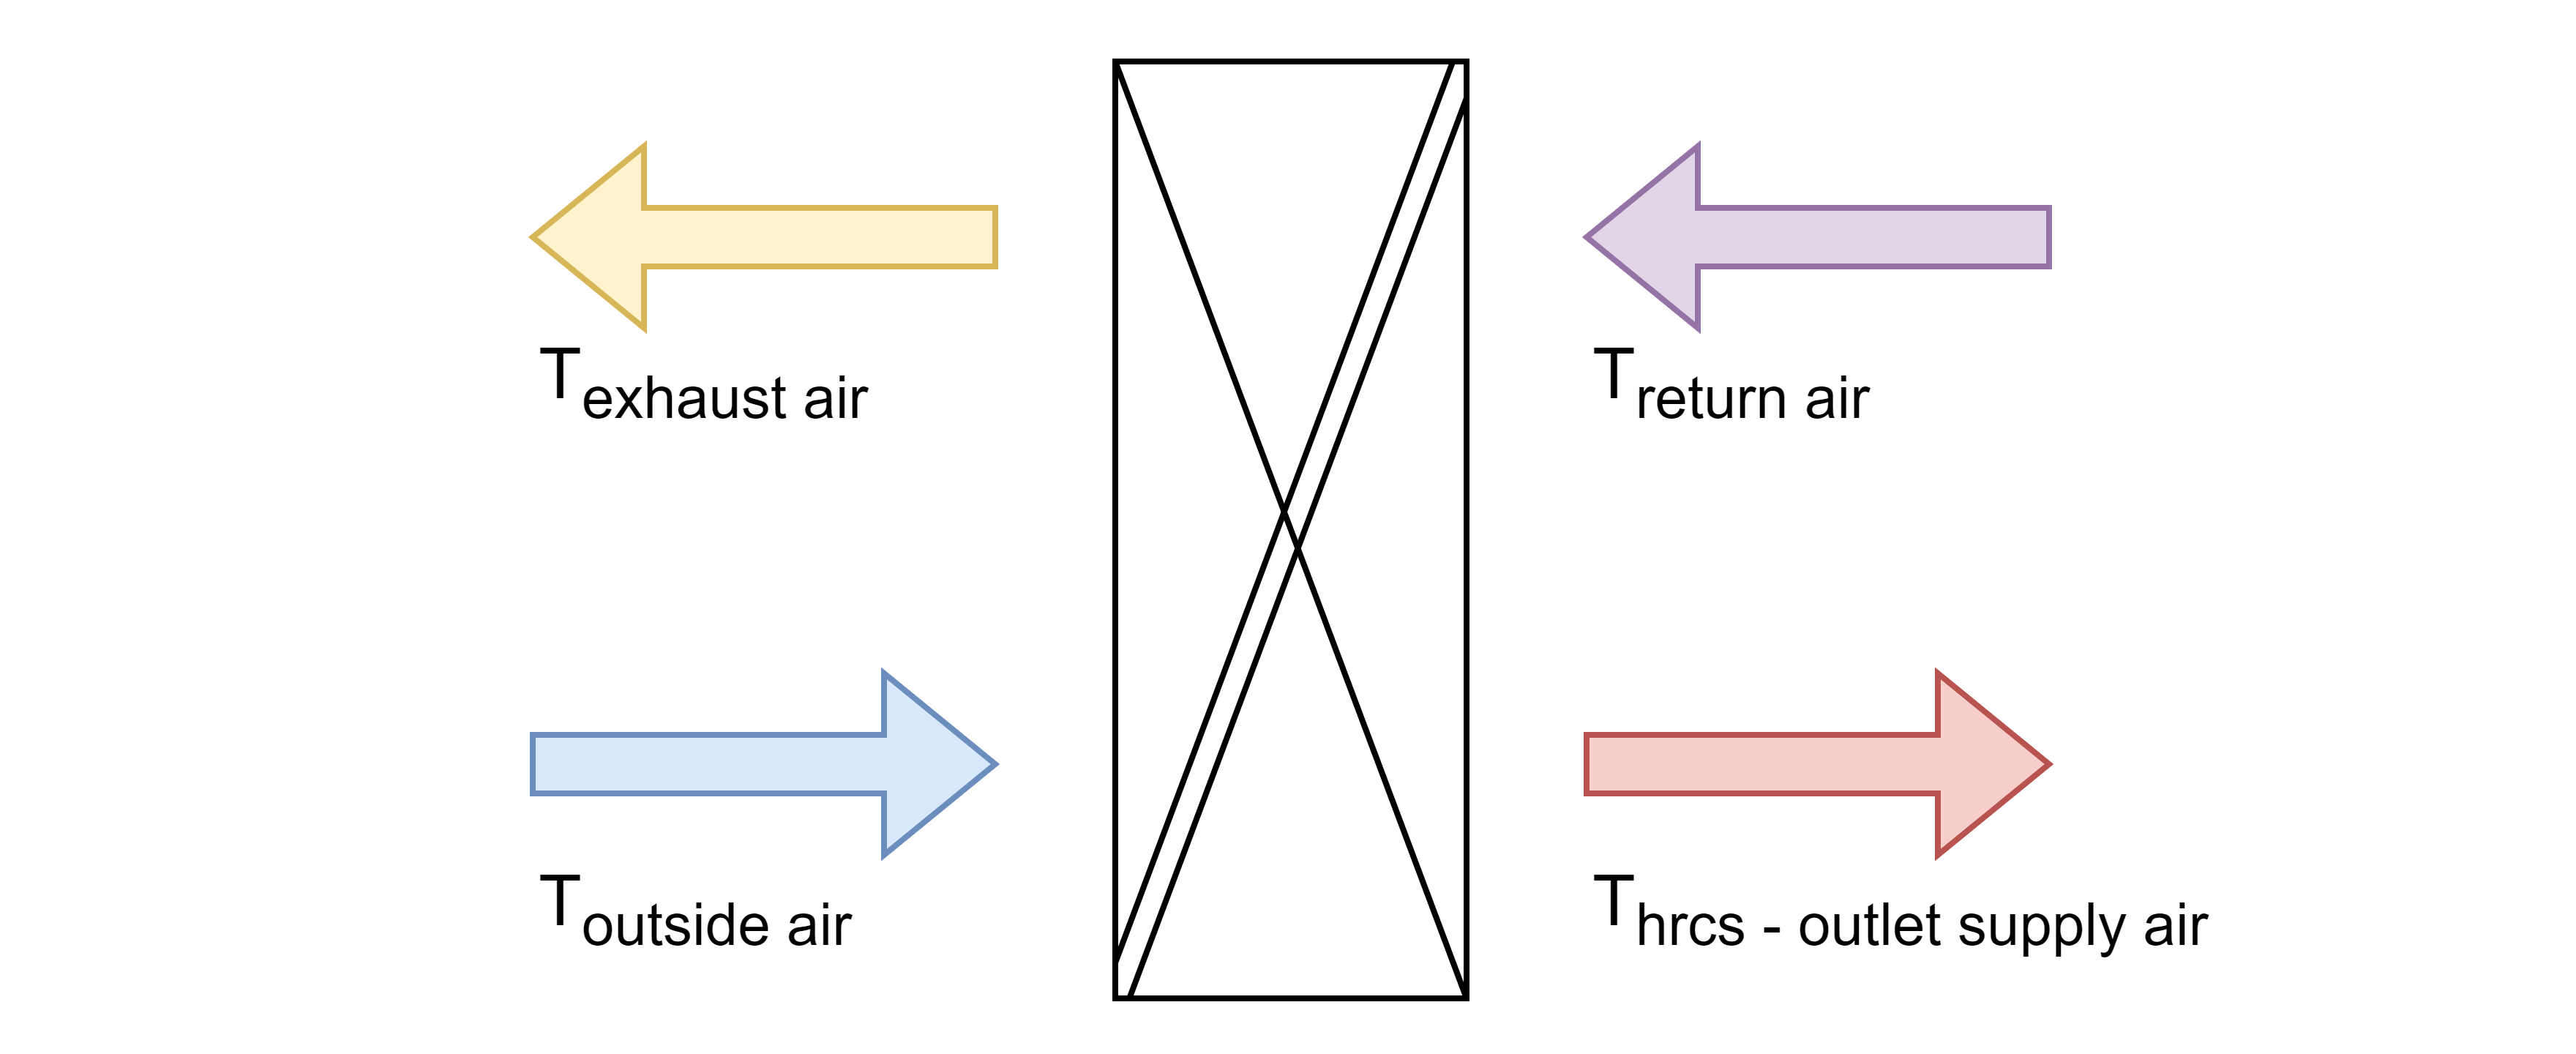
Figure 1: Temperatures of the ingoing and outgoing air of the HRCS
The temperature efficiency (dt. Rückwärmzahl) \(\Phi\) is calculated by:
As a second option, the temperature efficiency can be calculated by:
Alternatively, the temperature efficiency is estimated by the utilization of the HRCS \(u_\text{HRCS}\):
The efficiency is calculated under dry conditions (without condensation).
Value
- Determines the thermal efficiency of the heat recovery system
- Detects fouling
- Indicates a jammed unit
- Determines the quality and efficiency of the heat recovery process
- Detects if the HERO .controls app is currently running on the component and compares the temperature efficiency between the analysis period (with HERO) and reference period (without HERO)
- Estimates the savings potential of the HERO .controls app based on the improvement potential of the temperature efficiency by increased utilization of the HRCS
- Estimates the savings potential due to physical defects based on the improvement potential of the temperature efficiency
Recommended for components
- Air handling units
In order for the heat recovery system to be used efficiently, there must be a constant transfer of heat from the exhaust air to the outside air.
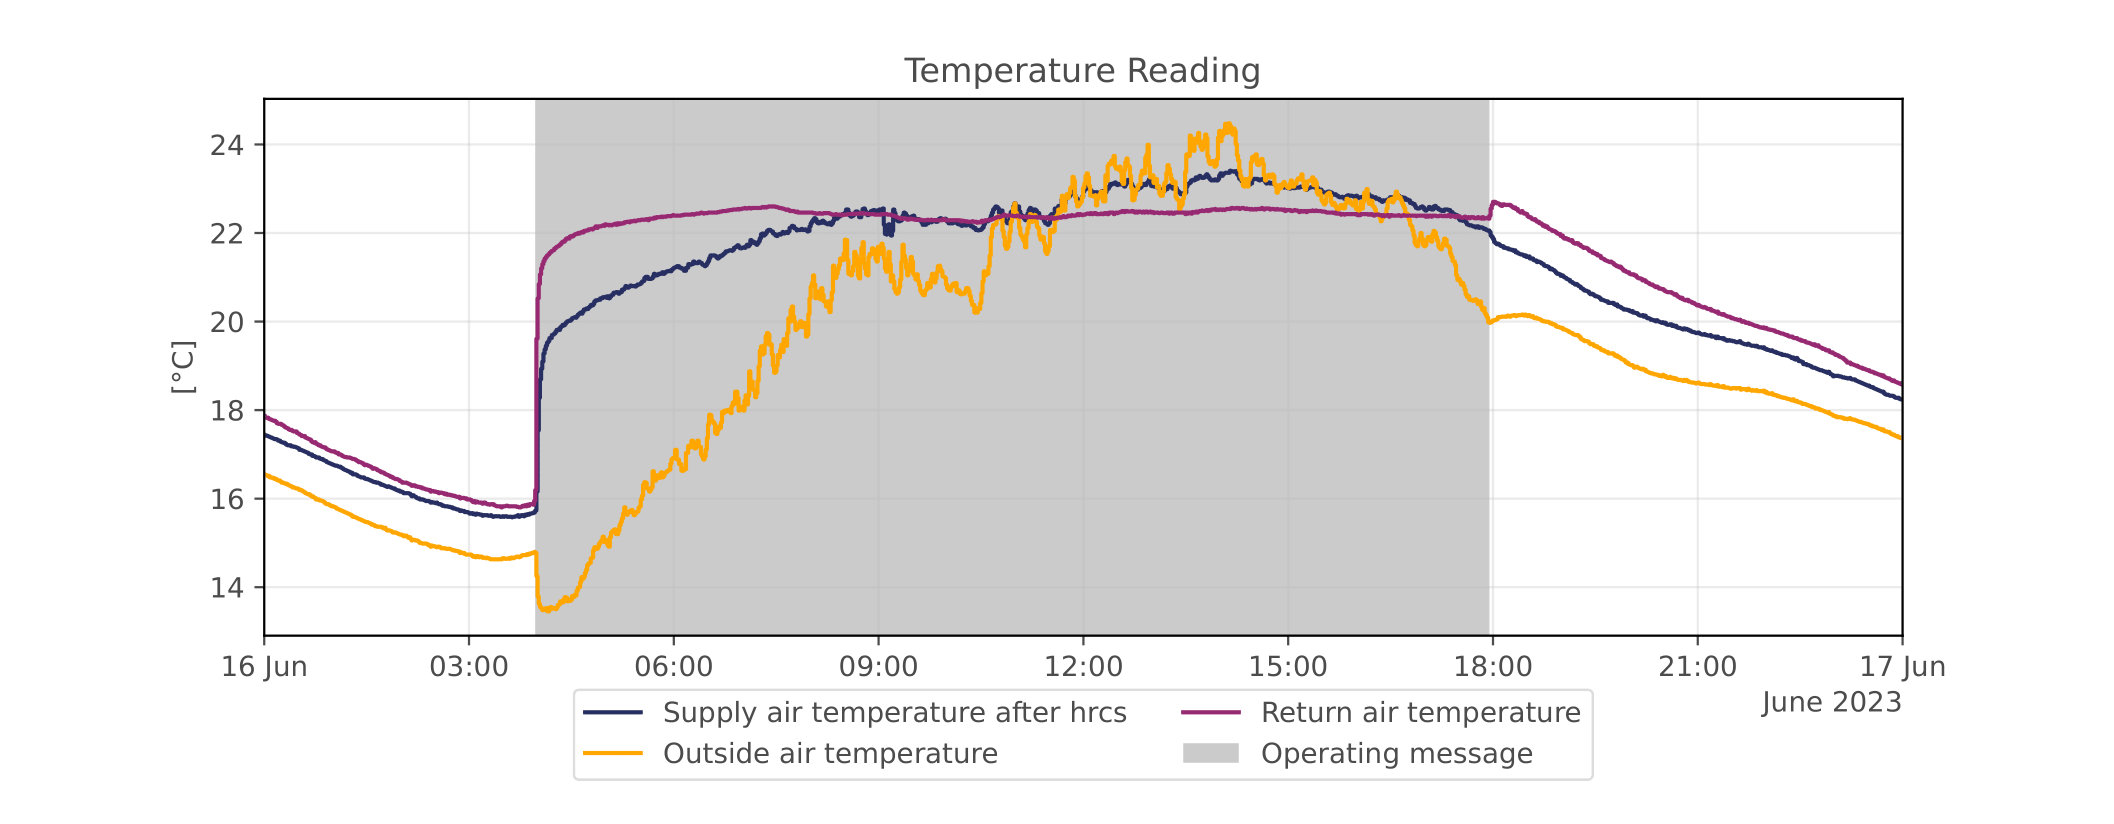
Figure 1: Temperature observations over a day
In Figure 1, within the operating time from 04:00 to 18:00 (grey shaded area), a regular "heating event" is observed between 04:00 and 11:00. However, from 11:00 onwards, the outside air temperature exceeds the exhaust air temperature and there is no longer a heat transfer along the original temperature gradient. During this period of the theoretical "cooling case", the heat recovered can no longer work efficiently.
Filtering of input values
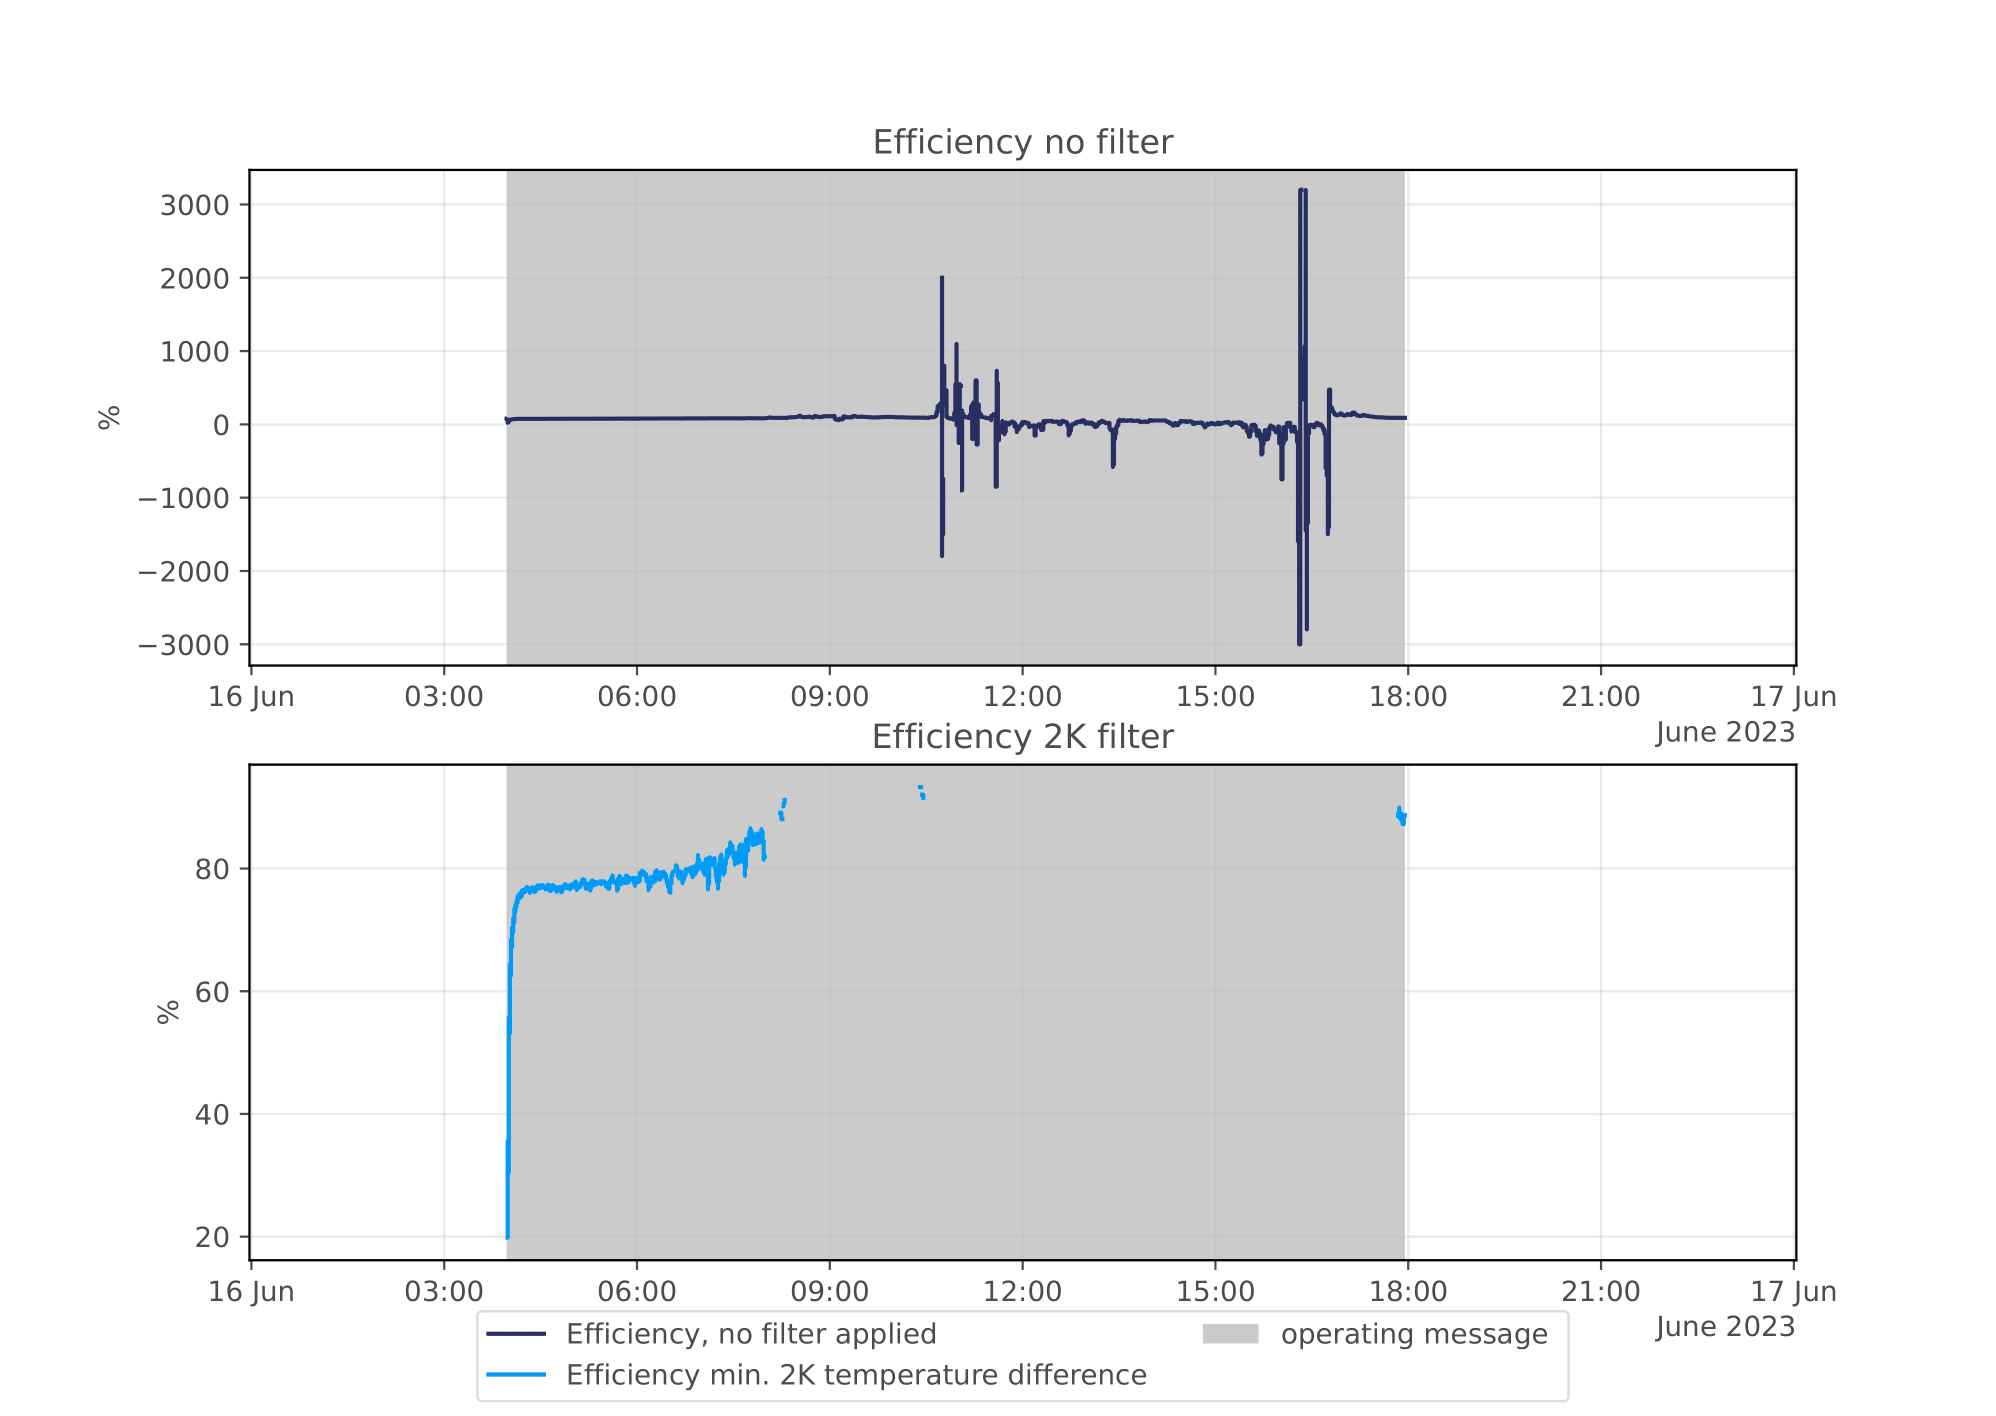
Figure 2: Temperature efficiency with filter (lower) and without filter (upper)
How this transition from heating to cooling can be observed based on the temperature efficiency coefficient is shown in Figure 2. As soon as the temperature difference between exhaust air and outside air falls below 2K from around 11:00 onwards, peak heat recovery coefficients of up to +-3000% are calculated. This is an indicator for a highly inefficient operation of the heat recovery system. If a 2K minimum temperature difference between outside air and exhaust air is introduced as seen in Figure 2, it can be observed that only reasonable temperature efficiency coefficients are calculated for these operating conditions. Periods of inefficient operations are filtered out.
In addition, the behavior of the heat recovery systems can be influenced by start-up processes. This can occur when the heat recovery system is started up after a longer period of inactivity. Due to, e.g. the thermal inertia of the system, the temperatures before and after the HRCS are not constant during the start-up process. This can lead to implausible values for the temperature efficiency. To exclude these effects, a start-up filter is applied. By that, the first 30 minutes of each operation period are neglected. The visualization of the start-up filter is shown in Figure 3.
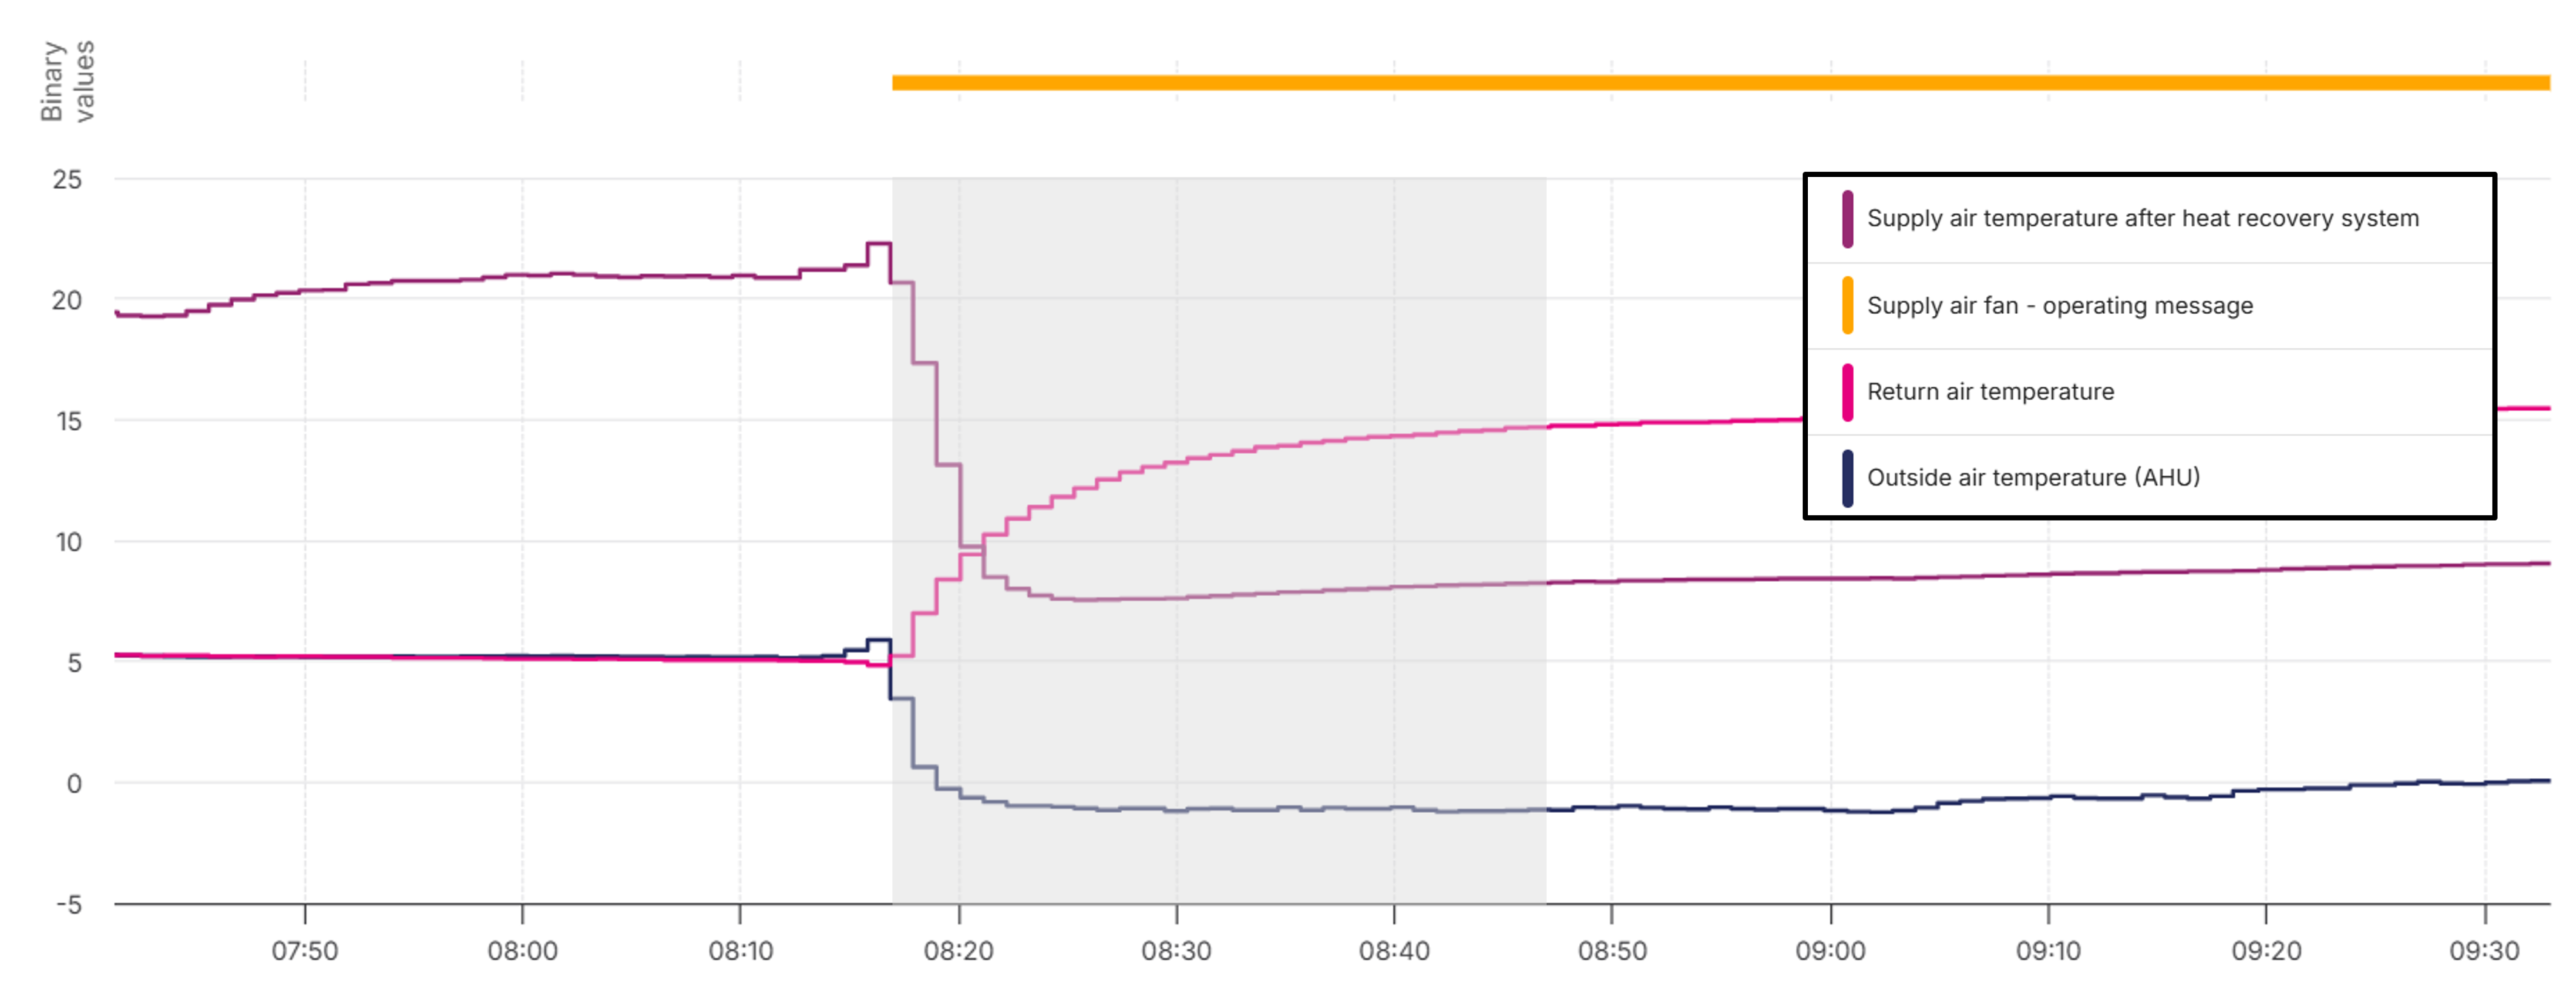
Figure 3: Start-up process of the HRCS
Savings Estimation: HERO
See Savings potential for how this fits the general pattern.
The savings estimation for the HERO .controls app is based on the improvement potential of the temperature efficiency by increased utilization of the HRCS. Consequently, the Supply air temperature after heat recovery system can be increased without any additional heating power. This assumption is valid while the building is in heating mode which is indicated by the datapoint building_mode being equal to one. The savings estimation is performed for the reference period indicated by the attributes Reference period start and Reference period end.
Figure 4 shows a scenario in which a savings potential is identified. The time of suboptimal utilization of the HRCS, indicated by the Heat recovery system - control signal here, is marked in grey. During that time, the Supply air temperature after heat recovery system could be increased by improving the utilization of the HRCS. The savings potential due to this temperature increase is marked in red.
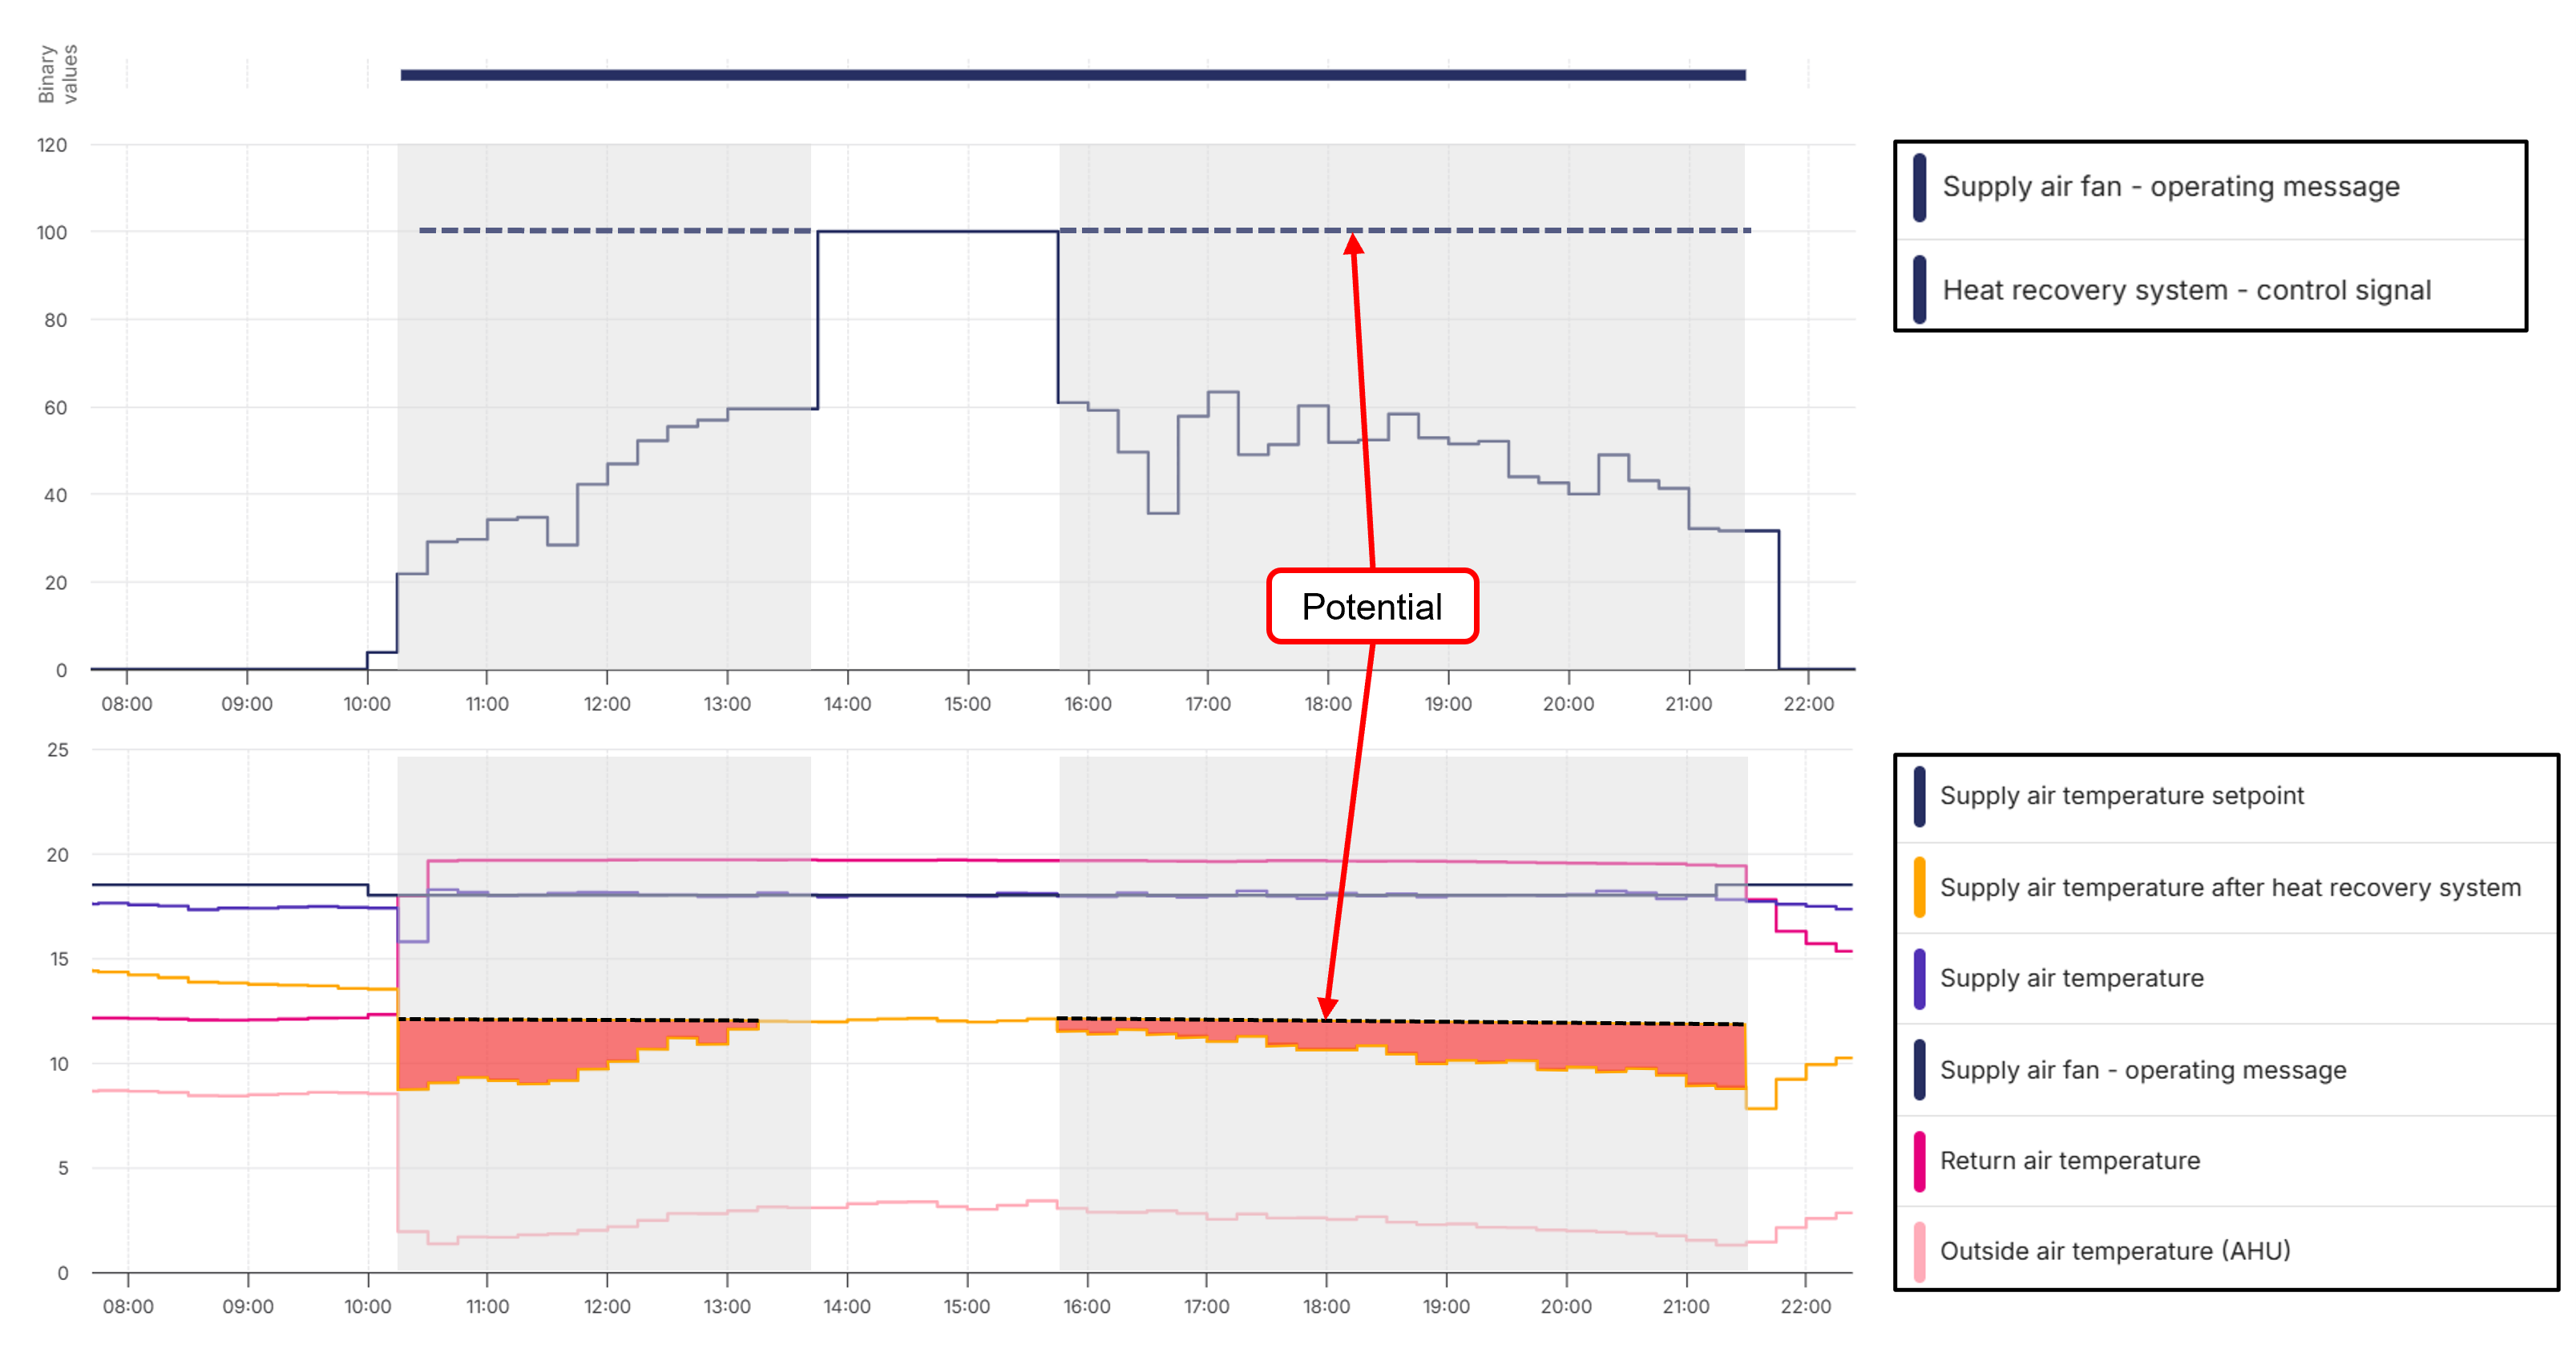
Savings Estimation: Physical defects
The savings estimation for physical defects is calculated in case the temperature efficiency is reduced although the HRCS is in an optimal utilization state. This means that the HRCS is utilized more than 90 % but the temperature efficiency is significantly below the comparison value indicated by the attribute "Heat recovery system efficiency". Causes for this behavior might be a defect of the heat recovery system, leakage, leaky flaps, a share of the volume flow being bypassed or an unequal ratio of supply and return air volume flow. The savings estimation is performed for the reference period indicated by the attributes Reference period start and Reference period end. The calculated savings potential is equal to the amount of energy that could be saved if the temperature efficiency were equal to the comparison value and not reduced. For example, if the average temperature efficiency at optimal utilization of the HRCS is calculated to 65 % and the comparison value is 75 %, the savings potential is the difference between the energy consumption at 65 % and 75 % temperature efficiency.
Signal colors
In order to determine the signal color the KPI temperature efficiency.mean is evaluated.
| Signal color | Available | Info |
|---|---|---|
| red | Yes | Default: 0 - 30 % efficiency is significantly below expected range |
| yellow | Yes | Default: 31 - 50 % efficiency is below expected range |
| green | Yes | Default: 51 - 100 % efficiency is within expected range |
Interpretations
| Available | Info |
|---|---|
| Yes | Interpretations summarize the result of the analysis |
| Yes | Hint in case the function of the HERO should be checked |
Recommendations
| Available | Info |
|---|---|
| Yes | Recommendations to service or exchange the heat recovery system |
| Yes | Recommendation to apply the HERO .controls app if a savings potential was identified |
| Yes | Information if a running HERO .controls app is detected for the component |
| Yes | Information how the temperature efficiency has changed between the analysis period (with HERO) and the reference period (without HERO) |
| Yes | Hint if there seems to be a physical defect based on the temperature efficiency being reduced compared to a reference value |
KPIs
Operational KPIs
| KPI reference | Info | Value Range | Unit |
|---|---|---|---|
| operating time | Total time of operation | 0 - inf | h |
| relative operating time | Total time of operation relative to analysis period | 0 - 100 | % |
| operating time not useful | Percentage of operating time during which the operation was inefficient | 0 - 100 | % |
Operating time not useful
During this time, the temperature efficiency is not calculated. To understand why it is considered inefficient, see the example.
Temperature efficiency KPIs
| KPI reference | Info | Value Range | Unit |
|---|---|---|---|
| temperature efficiency.mean | The average temperature efficiency of the heat recovery system while active | 0 - 100 | % |
| temperature efficiency.max | The maximal temperature efficiency of the heat recovery system while active | 0 - 100 | % |
| temperature efficiency.min | The minimal temperature efficiency of the heat recovery system while active | 0 - 100 | % |
Temperature efficiency KPIs for the reference period
In the table below, optimal utilization of the heat recovery system (HRCS) means the state in which the HRCS is utilized more than 90 %. The HRCS utilization is indicated by the Heat recovery system - position or the Heat recovery system - control signal. The suboptimal utilization of the HRCS means the state in which the HRCS is utilized less than 90 %.
| KPI reference | Info | Value Range | Unit |
|---|---|---|---|
| Reference period start | The start date of the reference period | YYYY-MM-DD | string |
| Reference period end | The end date of the reference period | YYYY-MM-DD | string |
| temperature efficiency.reference period.mean | The average temperature efficiency during the reference period | 0 - 100 | % |
| temperature efficiency.optimal hrcs utilization.reference period.mean | The average temperature efficiency while the HRCS is in optimal utilization state during the reference period | 0 - 100 | % |
| temperature efficiency.suboptimal hrcs utilization.reference period.mean | The average temperature efficiency while the HRCS is in suboptimal utilization state during the reference period | 0 - 100 | % |
| Operating time.optimal hrcs utilization.reference period.relative | The relative time of the HRCS being in the optimal utilization state during the reference period | 0 - 100 | % |
| Operating time.suboptimal hrcs utilization.reference period.relative | The relative time of the HRCS being in the suboptimal utilization state during the reference period | 0 - 100 | % |
Energy factor KPIs
| KPI Identifier | Info | Value Range | Unit |
|---|---|---|---|
| CO2 emission factor.heat | CO2 emission factor of thermal heat | 0 to inf | kg/kWh |
| energy price.heat | Energy price of thermal heat | 0 to inf | €/kWh |
KPIs regarding the savings estimation when suggesting the HERO app
The following table lists the KPIs that are related to the savings estimation for suggesting the HERO .controls app.
| KPI reference | Info | Value Range | Unit |
|---|---|---|---|
| Running HERO .controls app detected | Indicates if the HERO app was active when the analysis was executed | "Yes" or "No" | - |
| savings potential.HERO.reference period.energy | The energy savings potential during the reference period if the HERO had been active | 0 - inf | kWh |
| savings potential.HERO.reference period.financial | The financial savings potential during the reference period if the HERO had been active | 0 - inf | € |
| savings potential.HERO.reference period.CO2 emissions | The CO2 emissions savings potential during the reference period if the HERO had been active | 0 - inf | kg |
| Yearly savings potential.HERO.energy | The yearly energy savings potential if the HERO had been active | 0 - inf | kWh |
| Yearly savings potential.HERO.financial | The yearly financial savings potential if the HERO had been active | 0 - inf | € |
| Yearly savings potential.HERO.CO2 emissions | The yearly CO2 emissions savings potential if the HERO had been active | 0 - inf | kg |
KPIs regarding the savings estimation as a result of physical defects
The following table lists the KPIs that are related to the savings estimation as a result of physical defects.
| KPI reference | Info | Value Range | Unit |
|---|---|---|---|
| savings potential.physical defect.reference period.energy | The energy savings potential during the reference period as a result of physical defects | 0 - inf | kWh |
| savings potential.physical defect.reference period.financial | The financial savings potential during the reference period as a result of physical defects | 0 - inf | € |
| savings potential.physical defect.reference period.CO2 emissions | The CO2 emissions savings potential during the reference period as a result of physical defects | 0 - inf | kg |
| Yearly savings potential.physical defect.energy | The yearly energy savings potential as a result of physical defects | 0 - inf | kWh |
| Yearly savings potential.physical defect.financial | The yearly financial savings potential as a result of physical defects | 0 - inf | € |
| Yearly savings potential.physical defect.CO2 emissions | The yearly CO2 emissions savings potential as a result of physical defects | 0 - inf | kg |
At least one operating messages should be connected, otherwise the heat recovery system is expected to always be active.
It is recommended to add the utilization for more accurate results.
| Pin | Required | Mapping info | Unit |
|---|---|---|---|
| Return air temperature | Yes | - | °C |
| Exhaust air temperature | No | Either "Supply air temperature after heat recovery system" or "Exhaust air temperature" is required | °C |
| Supply air temperature after heat recovery system | No | Either "Supply air temperature after heat recovery system" or "Exhaust air temperature" is required | °C |
| Outside air temperature (AHU) | No | Either "Outside air temperature (AHU)" or "Outside air temperature (weather station)" is required | °C |
| Outside air temperature (weather station) | No | Either "Outside air temperature (AHU)" or "Outside air temperature (weather station)" is required | °C |
| Heat recovery system - operating message | No | If not available, HRCS "position" or "control signal" is used default: always on | - |
| Heat recovery system - position | No | Alternative to estimate the operating message. Activity threshold: 10 % | % |
| Heat recovery system - control signal | No | Alternative to estimate the operating message. Activity threshold: 10 % | % |
| Heat recovery system efficiency | No | Default: 75 % | % |
| Operating message | No | Default: always on | - |
| Supply air fan - operating message | No | - | - |
| Schedule timezone | No | Default "Europe/Berlin" | string |
| Attribute | Required | Mapping info | Unit |
|---|---|---|---|
| Heat recovery system leakage | No | Overwrites the percentage of leakage between supply and exhaust air flows. Set according to the data sheet. default: 0% | % |
| Temperature efficiency yellow limit | No | Overwrites the yellow limit for evaluation. Adjust according to the data sheet default: 70% | % |
| Temperature efficiency red limit | No | Overwrites the red limit for evaluation. Adjust according to the data sheet default: 30% | % |
| Additional Pins regarding the savings calculation | Required | Mapping info | Unit |
|---|---|---|---|
| Supply air fan - position | No | - | % |
| Supply air fan - control signal | No | Alternative source for the supply air fan - position. | % |
| Supply air fan - volume flow | No | - | m³/h |
| building_mode | Yes | building_mode is not a pin. It is a datapoint and set by the system automatically. | - |
| Attributes regarding the savings calculation | Required | Mapping info | Unit |
|---|---|---|---|
| Reference period start | Yes | Date in format "YYYY-MM-DD" | string |
| Reference period end | Yes | Date in format "YYYY-MM-DD" | string |
| CO2 emission factor heat | No | Default: 0.36 kg/kWh | kg/kWh |
| Heat price | No | Default: 0.15 €/kWh | €/kWh |
| Supply air fan - Default speed | No | Default: 90 % | % |
| Supply air fan - nominal power | No | Default: - | kW |
| Supply air fan - nominal volume flow | No | Default: - | m³/h |
| Supply air fan - specific fan power | No | Default: 2000 Ws/m³ | Ws/m³ |
Check out Where prices and emission factors come from for Energy price and CO2 emission factor sources and priorities.
Recommended Time Span
- 1 week for the analysis period
- By default the reference period is automatically set to 3 months. If not enough data is available, a shorter reference period is used.
- Define the reference period by setting the attributes "Reference period start" and "Reference period end" to up to 12 months for more reliable results.
Recommended Repetition
weekly
- Continuously monitor the temperature efficiency
Temperature Spread
The Temperature Spread analysis assesses the temperature difference between a supply and return temperature sensor of a heat or cold distribution system during the system's operation. It is proportional to the thermal output transferred to the consumer. While a small temperature spread indicates the potential for volume flow and therefore pump power consumption reduction, a huge spread indicates thermal under supply of the downstream systems and consumers.
Value
- Higher occupant comfort, health and performance
- Higher energy efficiency
- Lower operating costs
Recommended for components
Heat and cold distribution systems, such as
- Heating circuits
- Cooling circuits
- Thermal control loops
Checked conditions
- Operating mode compared to the component's expected operating mode
- Temperature spread is too small causing volume flows that are too high, evaluation is component-specific
- Temperature spread is too large and risk sufficient energy supply, evaluation is component-specific
- Temperature spread is as expected, evaluation is component-specific
- Condition checks on times of component's operation
In this example the Temperature spread analysis was applied to a Heating circuit.
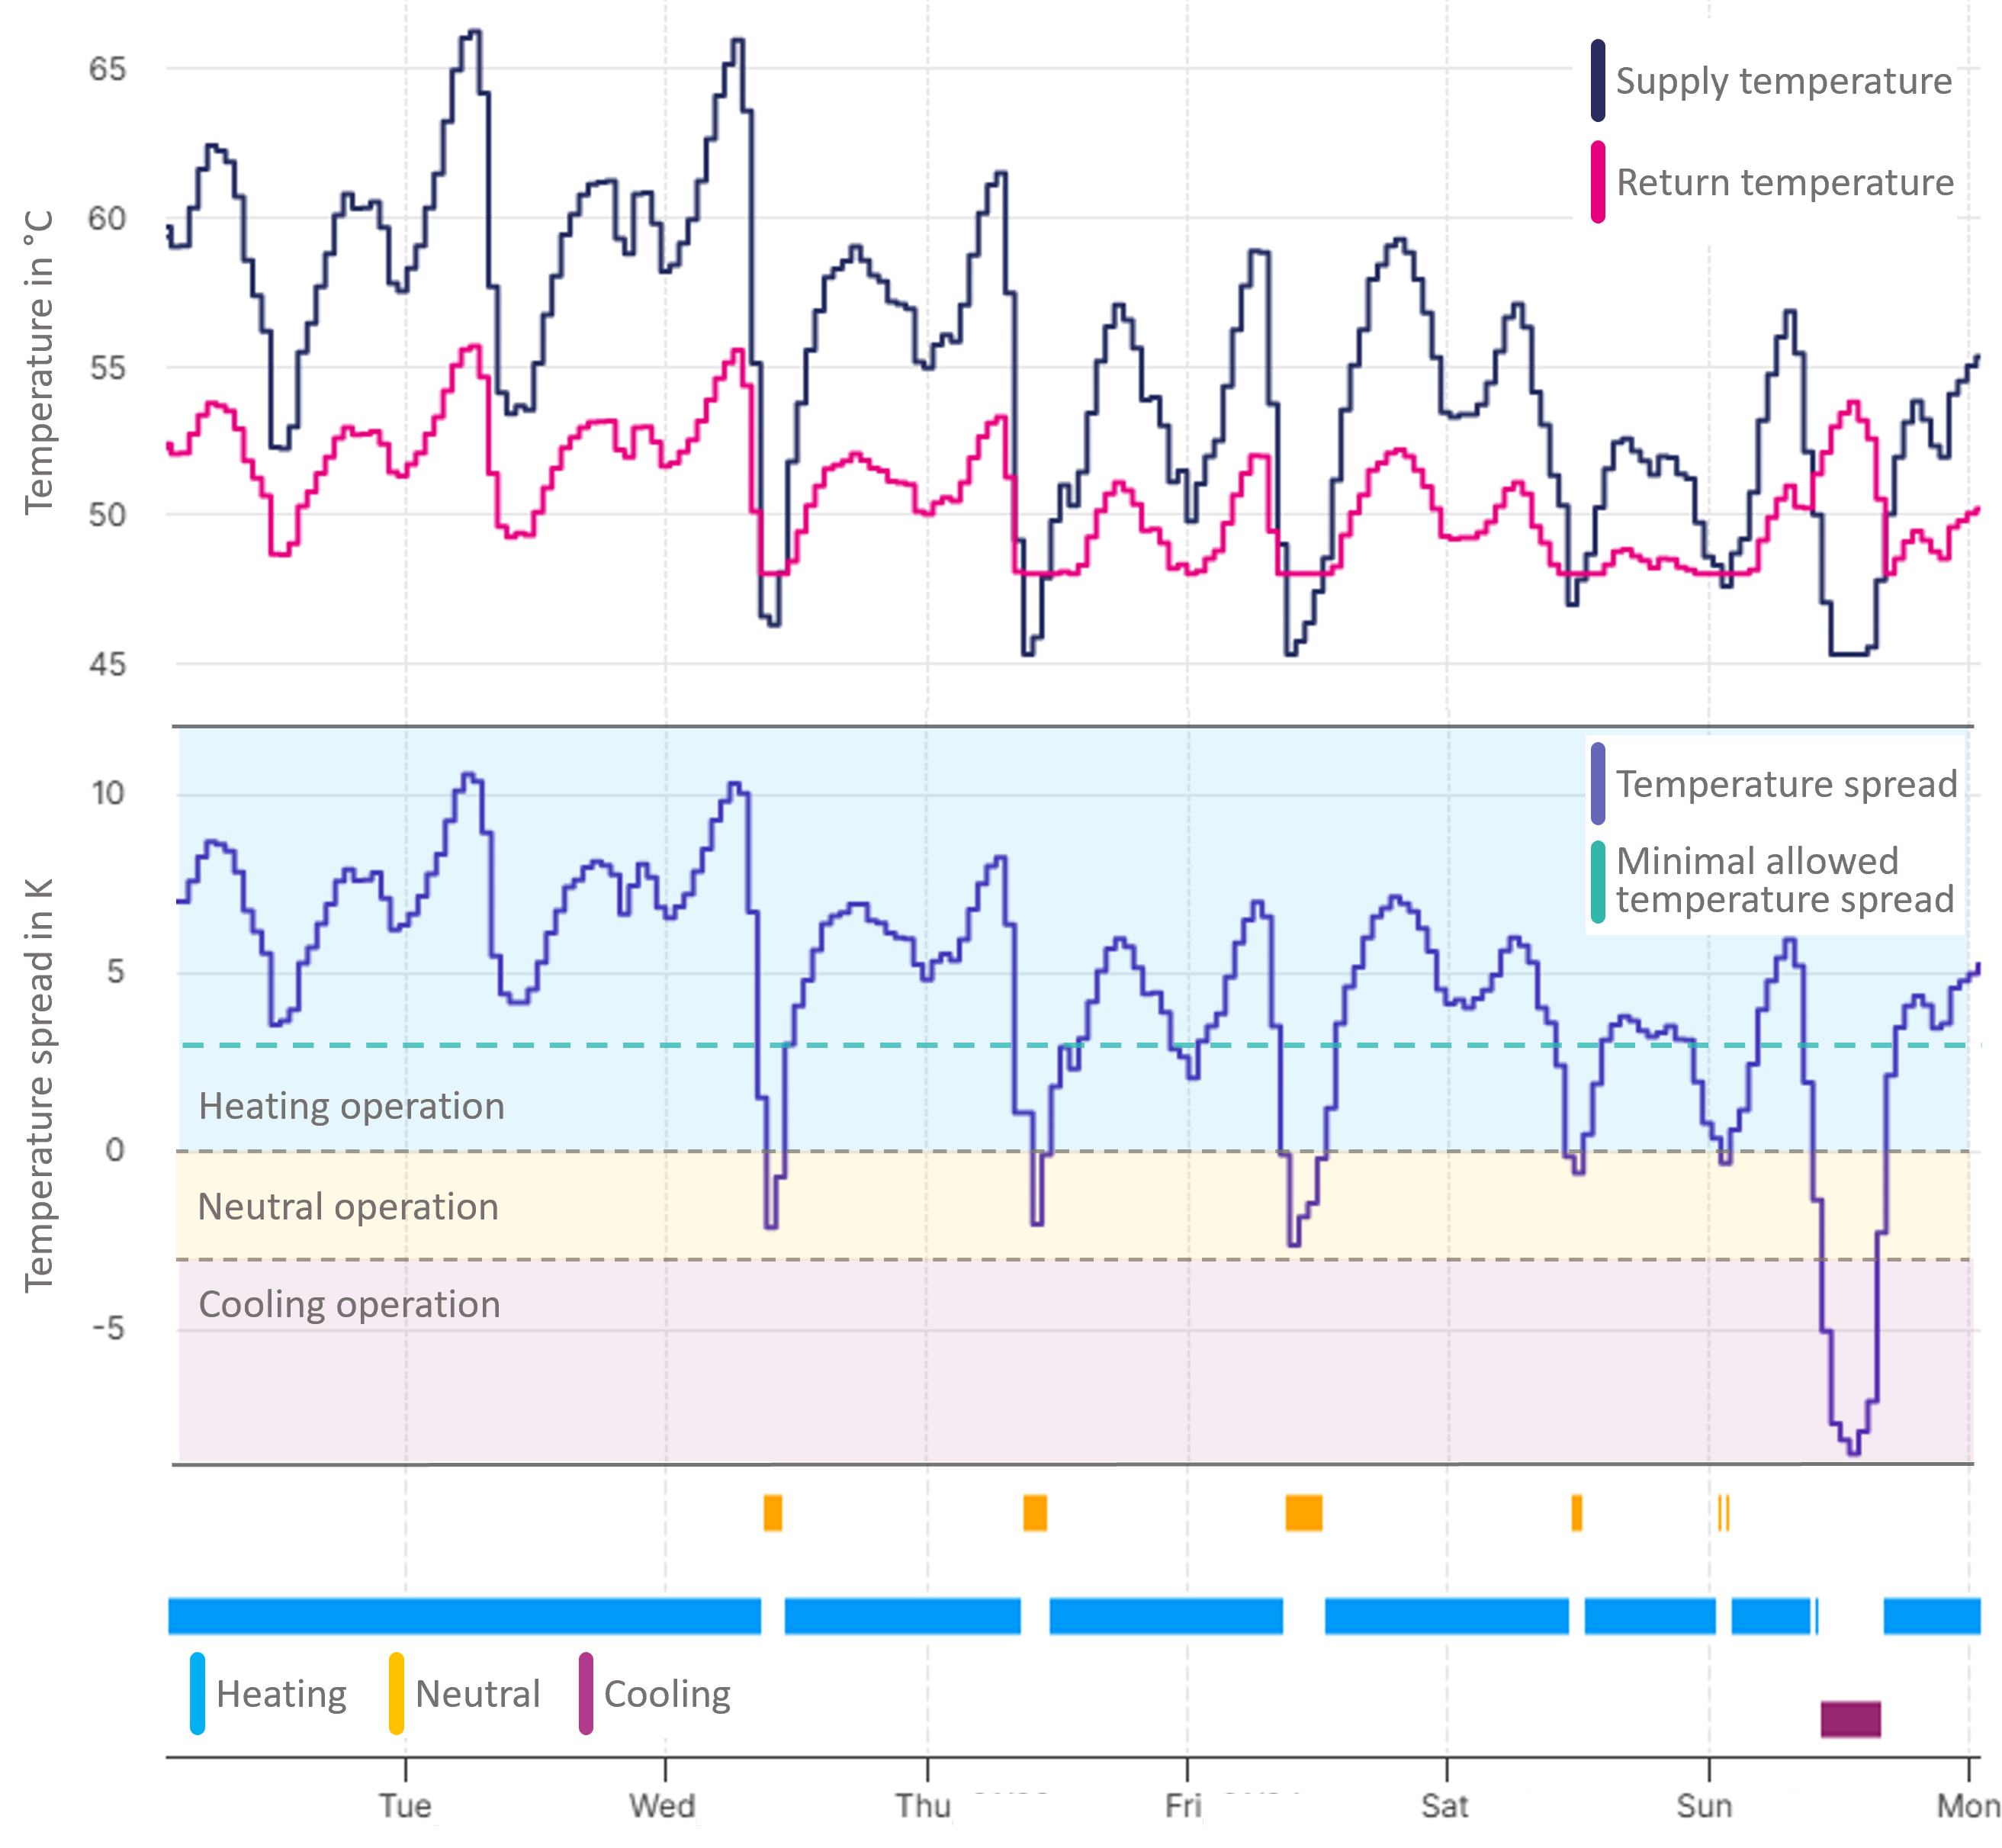
Figure 1: Temperature spread of heating circuit
Figure 1 illustrates the result for an analysis period of one week. The uppler plot shows the supply temperature and the return temperature of the heating circuit. In the middle plot you can see the corresponding temperature spread and the temperature spread ranges used to determine the current operating modes. The lower plot shows the resulting time slots of the operating modes for heating, cooling and neutral operation of the heating circuit.
Neutral operating mode
The neutral operating mode is used as a tolerance range to allow for measurement inaccuracies. The temperature spread limits for the neutral operating mode are defined based on the expected operating mode of the component. In this example the expected operating mode is heating.
The analysis calculates and interprets the temperature spread and the current operating mode. In this example the temperature spread is decreased below the allowed minimal temperature spread value of 3K. This is concluded as an interpretation of "Temperature spread too small" and can be seen in the KPI total.duration.below minimal allowed spread.relative.
General
| KPI | Value | Unit |
|---|---|---|
| Operating time | 168 | h |
| Operating time.relative | 100 | % |
Operating mode
| KPI | Value | Unit |
|---|---|---|
| Operating mode expectation | heating | - |
| Operating Mode.allowed | 162.30 | h |
| Operating Mode.allowed.relative | 96.59 | % |
| Operating Mode.cooling | 5.73 | h |
| Operating Mode.cooling.relative | 3.41 | % |
| Operating Mode.heating | 151.30 | h |
| Operating Mode.heating.relative | 90.09 | % |
| Operating Mode.neutral | 10.92 | h |
| Operating Mode.neutral.relative | 6.50 | % |
| Operating Mode.not allowed | 5.73 | h |
| Operating Mode.not allowed.relative | 3.41 | % |
Heating attributes
| KPI | Value | Unit |
|---|---|---|
| heating.maximum allowed spread | 20.00 | ΔK |
| heating.minimum allowed spread | 3.00 | ΔK |
Statistics for operating mode cooling
| KPI | Value | Unit |
|---|---|---|
| cooling.temperature spread.maximum | 8.54 | ΔK |
| cooling.temperature spread.mean | 7.04 | ΔK |
| cooling.temperature spread.minimum | 3.53 | ΔK |
Statistics for operating mode heating
| KPI | Value | Unit |
|---|---|---|
| heating.temperature spread.maximum | 10.77 | ΔK |
| heating.temperature spread.mean | 4.97 | ΔK |
| heating.temperature spread.minimum | -2.80 | ΔK |
Evaluation for operating mode heating
| KPI | Value | Unit |
|---|---|---|
| heating.duration.above maximum allowed spread | 0 | h |
| heating.duration.above maximum allowed spread.relative | 0 | % |
| heating.duration.below minimum allowed spread | 29.66 | h |
| heating.duration.below minimum allowed spread.relative | 18.28 | % |
| heating.duration.within allowed spread limits | 132.60 | h |
| heating.duration.within allowed spread limits.relative | 81.72 | % |
Total evaluation of temperature spread
| KPI | Value | Unit |
|---|---|---|
| total.duration.above maximum allowed spread | 0 | h |
| total.duration.above maximum allowed spread.relative | 0 | % |
| total.duration.below minimum allowed spread | 29.66 | h |
| total.duration.below minimum allowed spread.relative | 18.28 | % |
| total.duration.within allowed spread limits | 132.6 | h |
| total.duration.within allowed spread limits.relative | 81.72 | % |
Signal colors
| Signal color | Available | Info |
|---|---|---|
| red | Yes | Red analysis results indicate operating conditions which should be checked by the operator in any case because the temperature spreads have not been set optimally. |
| yellow | Yes | Yellow analysis results are shown for operating conditions which should be improved. |
| green | Yes | Green analaysis results show that there is sufficient temperature spread for this component in respect to usual tolerances. |
Interpretations
| Available | Info |
|---|---|
| Yes | Interpretations summarize the result of the analysis. |
Recommendations
| Available | Info |
|---|---|
| Yes | Recommendations on how to adjust volume flows for higher energy efficiency or better energy provision. No recommendation, if temperature spread is sufficient. |
KPIs
General
| KPI Identifier | Info | Value Range | Unit |
|---|---|---|---|
| Operating time | Amount of time component is switched on | 0 to inf | h |
| Operating time.relative | Amount of time component is switched on relative to analysis period | 0 to 100 | % |
Statistics of temperature spread
Temperature spread
Heat flow direction can be derived from the corresponding operating mode of the component.
| KPI Identifier | Info | Value Range | Unit |
|---|---|---|---|
| Operating mode expectation | Expected operating mode based on general components behavior or operating mode attribute. | Operating mode e.g. "heating operation" | string |
| Operating Mode.allowed | Amount of time the component is operated in a allowed operating mode. | 0 to inf | h |
| Operating Mode.allowed.relative | Amount of time the component is operated in a allowed operating mode relative to operating time. | 0 to 100 | % |
| Operating Mode.cooling | Amount of time the component is operated in cooling mode. | 0 to inf | h |
| Operating Mode.cooling.relative | Amount of time the component is operated in cooling mode relative to operating time. | 0 to 100 | % |
| Operating Mode.heating | Amount of time the component operated is in heating mode. | 0 to inf | h |
| Operating Mode.heating.relative | Amount of time the component is operated in heating mode relative to operating time. | 0 to 100 | % |
| Operating Mode.neutral | Amount of time the component is operated in a neutral mode. (Usually impossible to reach under real conditions) | 0 to inf | h |
| Operating Mode.neutral.relative | Amount of time the component is operated in a neutral mode relative to operating time. (Usually impossible to reach under real conditions) | 0 to 100 | % |
| Operating Mode.not allowed | Amount of time the component is operated in a prohibited operating mode. | 0 to inf | h |
| Operating Mode.not allowed.relative | Amount of time the component is operated in a prohibited operating mode relative to operaint time. | 0 to 100 | % |
Operating modes
The operating mode is an indication for the heat transfer originating from the component to a consumer.
The heating mode indicates that a consumer is being supplied with heat.
The cooling mode indicates that a consumer is being supplied with cold.
The KPIs for a specific operating mode are only returned when the component had operation in these modes.
| KPI Identifier | Info | Value Range | Unit |
|---|---|---|---|
| <operating mode>.duration.above maximum allowed spread | Amount of time the temperature spread exceeded the maximum allowed spread specific for <operating mode>. | 0 to inf | h |
| <operating mode>.duration.above maximum allowed spread.relative | Amount of time the temperature spread exceeded the maximum allowed spread specific for <operating mode> relative to operating time. | 0 to 100 | % |
| <operating mode>.duration.below minimum allowed spread | Amount of time the temperature spread fell below the minimum allowed spread specific for <operating mode>. | 0 to inf | h |
| <operating mode>.duration.below minimum allowed spread.relative | Amount of time the temperature spread fell below the minimum allowed spread specific for <operating mode> relative to operating time. | 0 to 100 | % |
| <operating mode>.duration.within allowed spread limits | Amount of time the temperature spread stayed inside the desired maximum and minimum allowed spreads for a specific <operating mode>. | 0 to inf | h |
| <operating mode>.duration.within allowed spread limits.relative | Amount of time the temperature spread stayed inside the desired maximum and minimum allowed spreads for a specific <operating mode> relative to operating time. | 0 to 100 | % |
| <operating mode>.maximum allowed spread | Maximum allowed temperature spread for the <operating mode>, calculated from attributes. | -inf to inf | ΔK |
| <operating mode>.minimum allowed spread | Maximum allowed temperature spread for the <operating mode>, calculated from attributes. | -inf to inf | ΔK |
| <operating mode>.temperature spread.maximum | Maximum calculated temperature spread during operation in <operating mode>. | -inf to inf | ΔK |
| <operating mode>.temperature spread.mean | Average calculated temperature spread during operation in <operating mode>. | -inf to inf | ΔK |
| <operating mode>.temperature spread.minimum | Minimum calculated temperature spread during operation in <operating mode>. | -inf to inf | ΔK |
| KPI Identifier | Info | Value Range | Unit |
|---|---|---|---|
| total.duration.above maximum allowed spread | Amount of time the temperature spread exceeded the maximum allowed spread. This includes all operating modes. | 0 to inf | h |
| total.duration.above maximum allowed spread.relative | Amount of time the temperature spread exceeded the maximum allowed spread relative to operating time. This includes all operating modes. | 0 to 100 | % |
| total.duration.below minimum allowed spread | Amount of time the temperature spread fell below the minimum allowed spread. This includes all operating modes. | 0 to inf | h |
| total.duration.below minimum allowed spread.relative | Amount of time the temperature spread fell below the minimum allowed spread relative to operating time. This includes all operating modes. | 0 to 100 | % |
| total.duration.within allowed spread limits | Amount of time the temperature spread stayed inside the desired maximum and minimum allowed spreads. This includes all operating modes. | 0 to inf | h |
| total.duration.within allowed spread limits.relative | Amount of time the temperature spread stayed inside the desired maximum and minimum allowed spreads relative to operating time. This includes all operating modes. | 0 to 100 | % |
Specific KPIs for Heat pumps, Compression chillers and Heat transfer units
Evaluation of subcomponents
Each component has subcomponents which will be set as a prefix infront of the KPIs above. The temperature spreads for each subcomponent will be evaluated independently.
Example for the temperature spread: "<subcomponent>.<operating mode>.temperature spread.mean", "condenser.heating.temperature spread.mean".
The KPIs for total.duration are additionally introduced for the whole component, they have no subcomponent prefix.
Prioritisation of the operating message pins
Order for operating messages is Pump - operating message, Pump - control signal, Operating message. If no pin is available the operating message will be considered as always on.
Operating mode
The operating mode is expected to be cooling.
| Pin | Required | Mapping info |
|---|---|---|
| Operating message | No | - |
| Pump - control signal | No | - |
| Pump - operating message | No | - |
| Supply temperature - water side | Yes | - |
| Return temperature - water side | Yes | - |
| Attribute | Required | Mapping info | Unit |
|---|---|---|---|
| Design supply temperature | No | Default: 10.0 | °C |
| Design return temperature | No | Default: 16.0 | °C |
| Minimal temperature spread | No | Default: 2.0 | K |
Prioritisation of the operating message pins
Order for operating messages is Pump - operating message, Pump - control signal, Operating message. If no pin is available the operating message will be considered as always on.
Operating mode
The operating mode is expected to be heating.
| Pin | Required | Mapping info |
|---|---|---|
| Operating message | No | - |
| Pump - control signal | No | - |
| Pump - operating message | No | - |
| Supply temperature - water side | Yes | - |
| Return temperature - water side | Yes | - |
| Attribute | Required | Mapping info | Unit |
|---|---|---|---|
| Design supply temperature | No | Default: 60.0 | °C |
| Design return temperature | No | Default: 40.0 | °C |
| Minimal temperature spread | No | Default: 5.0 | K |
Prioritisation of the operating message pins
Order for operating messages is Operating message, Pump - operating message, Pump - control signal. If no pin is available the operating message will be considered as always on.
Operating mode
The operating mode is expected to be heating.
| Pin | Required | Mapping info |
|---|---|---|
| Operating message | No | - |
| Pump - control signal | No | - |
| Pump - operating message | No | - |
| Return temperature | Yes | - |
| Supply temperature | Yes | - |
| Attribute | Required | Mapping info | Unit |
|---|---|---|---|
| Design supply temperature | No | Default: 70.0 | °C |
| Design return temperature | No | Default: 50.0 | °C |
| Minimal temperature spread | No | Default: 5.0 | K |
Prioritisation of the operating message pins
Order for operating messages is Operating message, Evaporator - pump - operating message, Evaporator - pump - control signal, Condenser - pump - operating message, Condenser - Pump - control signal. If no Pin is available the operating message will be considered as always on.
Subcomponents
There are two subcomponents: Condenser, Evaporator. The temperature spread can be evaluated for each of these independently. If both are connected, also the overall operating mode of the component is evaluated. The overall operating mode is expected to be cooling.
| Pin | Required | Mapping info |
|---|---|---|
| Operating message | No | - |
| Evaporator - pump - operating message | No | - |
| Evaporator - pump - control signal | No | - |
| Condenser - pump - operating message | No | - |
| Condenser - Pump - control signal | No | - |
| Outlet temperature - condenser | No | - |
| Inlet temperature - condenser | No | - |
| Outlet temperature - evaporator | No | - |
| Inlet temperature - evaporator | No | - |
| Attribute | Required | Mapping info | Unit |
|---|---|---|---|
| Condenser - design return temperature | No | Default: 50.0 | °C |
| Condenser - design supply temperature | No | Default: 44.0 | °C |
| Condenser - minimal temperature spread | No | Default: 2.0 | K |
| Evaporator - design return temperature | No | Default: 16.0 | °C |
| Evaporator - design supply temperature | No | Default: 8.0 | °C |
| Evaporator - minimal temperature spread | No | Default: 2.0 | K |
Prioritisation of the operating message pins
Order for operating messages is Pump - operating message, Pump - control signal, Operating message. If no pin is available the operating message will be considered as always on.
Operating mode
The operating mode is expected to be cooling.
| Pin | Required | Mapping info |
|---|---|---|
| Operating message | No | - |
| Pump - control signal | No | - |
| Pump - operating message | No | - |
| Return temperature | Yes | - |
| Supply temperature | Yes | - |
| Attribute | Required | Mapping info | Unit |
|---|---|---|---|
| Design supply temperature | No | Default: 10.0 | °C |
| Design return temperature | No | Default: 16.0 | °C |
| Minimal temperature spread | No | Default: 2.0 | K |
Prioritisation of the operating message pins
Order for operating messages is Operating message, Evaporator - pump - operating message, Evaporator - pump - control signal, Condenser - pump - operating message, Condenser - Pump - control signal. If no Pin is available the operating message will be considered as always on.
Subcomponents
There are two subcomponents: Condenser, Evaporator. The temperature spread can be evaluated for each of these independently. If both are connected, also the overall operating mode of the component is evaluated. The overall operating mode is expected to be heating.
| Pin | Required | Mapping info |
|---|---|---|
| Operating message | No | - |
| Evaporator - pump - operating message | No | - |
| Evaporator - pump - control signal | No | - |
| Condenser - pump - operating message | No | - |
| Condenser - Pump - control signal | No | - |
| Outlet temperature - condenser | No | - |
| Inlet temperature - condenser | No | - |
| Outlet temperature - evaporator | No | - |
| Inlet temperature - evaporator | No | - |
Overall operating modes
heating_mode:
- Evaporator heating
- Condenser heating
cooling_mode: (External switch of evaporator side with condenser side)
- Evaporator cooling
- Condenser cooling
| Attribute | Required | Mapping info | Unit |
|---|---|---|---|
| Condenser cooling - design return temperature | No | Default: 16.0 | °C |
| Condenser cooling - design supply temperature | No | Default: 8.0 | °C |
| Condenser cooling - minimal temperature spread | No | Default: 2.0 | K |
| Condenser heating - design return temperature | No | Default: 44.0 | °C |
| Condenser heating - design supply temperature | No | Default: 50.0 | °C |
| Condenser heating - minimal temperature spread | No | Default: 2.0 | K |
| Evaporator cooling - design return temperature | No | Default: 16.0 | °C |
| Evaporator cooling - design supply temperature | No | Default: 8.0 | °C |
| Evaporator cooling - minimal temperature spread | No | Default: 2.0 | K |
| Evaporator heating - design return temperature | No | Default: 44.0 | °C |
| Evaporator heating - design supply temperature | No | Default: 50.0 | °C |
| Evaporator heating - minimal temperature spread | No | Default: 2.0 | K |
| Overall operating mode | No | Default: heating_mode. Allowed values: cooling_mode heating_mode heating_and_cooling_mode | - |
Prioritisation of the operating message pins
Order for operating messages is Operating message, Secondary side - pump - operating message, Primary side - pump - operating message, Secondary side - pump - control signal, Primary side - pump - control signal. If no pin is available the operating message will be considered as always on.
Subcomponents
There are two subcomponents: Primary, Secondary. The temperature spread can be evaluated for each of these independently. If both are connected, also the overall operating mode of the component is evaluated. The overall operating mode is expected to be heating.
| Pin | Required | Mapping info |
|---|---|---|
| Operating message | No | - |
| Primary side - pump - operating message | No | - |
| Primary side - pump - control signal | No | - |
| Secondary side - pump - operating message | No | - |
| Secondary side - pump - control signal | No | - |
| Supply temperature - primary | No | - |
| Return temperature - primary | No | - |
| Return temperature - secondary | No | - |
| Supply temperature - secondary | No | - |
Overall operating modes
heating_mode:
- Primary heating
- Secondary heating
cooling_mode: (External switch of evaporator side with condenser side)
- Primary cooling
- Secondary cooling
| Attribute | Required | Mapping info | Unit |
|---|---|---|---|
| Overall operating mode | No | Default: heating_mode. Allowed values: cooling_mode heating_mode heating_and_cooling_mode | - |
| Primary cooling - design return temperature | No | Default: 14.0 | °C |
| Primary cooling - design supply temperature | No | Default: 8.0 | °C |
| Primary cooling - minimal temperature spread | No | Default: 2.0 | K |
| Primary heating - design return temperature | No | Default: 65.0 | °C |
| Primary heating - design supply temperature | No | Default: 125.0 | °C |
| Primary heating - minimal temperature spread | No | Default: 10.0 | K |
| Secondary cooling - design return temperature | No | Default: 16.0 | °C |
| Secondary cooling - design supply temperature | No | Default: 10.0 | °C |
| Secondary cooling - minimal temperature spread | No | Default: 2.0 | K |
| Secondary heating - design return temperature | No | Default: 35.0 | °C |
| Secondary heating - design supply temperature | No | Default: 70.0 | °C |
| Secondary heating - minimal temperature spread | No | Default: 5.0 | K |
Prioritisation of the operating message pins
Order for operating messages is Pump - operating message, Pump - control signal, Operating message. If no pin is available the operating message will be considered as always on.
Operating mode
The operating mode is expected to be heating.
| Pin | Required | Mapping info |
|---|---|---|
| Operating message | No | - |
| Pump - control signal | No | - |
| Pump - operating message | No | - |
| Return temperature | Yes | - |
| Supply temperature | Yes | - |
| Attribute | Required | Mapping info | Unit |
|---|---|---|---|
| Design supply temperature | No | Default: 70.0 | °C |
| Design return temperature | No | Default: 50.0 | °C |
| Minimal temperature spread | No | Default: 5.0 | K |
Prioritisation of the operating message pins
Order for operating messages is Pump - operating message, Operating message - fan. If no pin is available the operating message will be considered as always on.
Operating mode
The operating mode is can be heating or cooling. By default the operating mode is expected to be cooling.
| Pin | Required | Mapping info |
|---|---|---|
| Operating message | No | - |
| Operating message - fan | No | - |
| Return temperature | Yes | - |
| Supply temperature | Yes | - |
| Attribute | Required | Mapping info | Unit |
|---|---|---|---|
| Operating mode | No | Default: cooling_mode. Allowed values: cooling_mode heating_mode | - |
| Cooling - design return temperature | No | Default: 50.0 | °C |
| Cooling - design supply temperature | No | Default: 44.0 | °C |
| Cooling - minimal temperature spread | No | Default: 2.0 | K |
| Heating - design return temperature | No | Default: 10.0 | °C |
| Heating - design supply temperature | No | Default: 16.0 | °C |
| Heating - minimal temperature spread | No | Default: 2.0 | K |
Prioritisation of the operating message pins
For each subcomponent, the order is
Subcomponents
There are two subcomponents: Air heater (expected operating mode: heating) and Air cooler (expected operating mode: cooling). The temperature spread is evaluated for each subcomponent independently.
| Pin | Required | Mapping info |
|---|---|---|
| Air cooler - Operating message | No | - |
| Air cooler - Pump - Control signal | No | - |
| Air cooler - Pump - Operating message | No | - |
| Air cooler - Water return temperature | Yes | Required if the air cooler shall be analyzed. |
| Air cooler - Water supply temperature | Yes | Required if the air cooler shall be analyzed. |
| Air heater - Operating message | No | - |
| Air heater - Pump - Control signal | No | - |
| Air heater - Pump - Operating message | No | - |
| Air heater - Water return temperature | Yes | Required if the air heater shall be analyzed. |
| Air heater - Water supply temperature | Yes | Required if the air heater shall be analyzed. |
| Operating message | No | - |
| Attribute | Required | Mapping info | Unit |
|---|---|---|---|
| Air cooler - Design return temperature | No | Default: 16.0 | °C |
| Air cooler - Design supply temperature | No | Default: 10.0 | °C |
| Air cooler - Minimal temperature spread | No | Default: 1.0 | K |
| Air heater - Design return temperature | No | Default: 40.0 | °C |
| Air heater - Design supply temperature | No | Default: 60.0 | °C |
| Air heater - Minimal temperature spread | No | Default: 5.0 | K |
Prioritisation of the operating message pins
Order for operating messages is Pump - operating message, Pump - control signal, Operating message. If no pin is available the operating message will be considered as always on.
Operating mode
The operating mode is can be heating or cooling. By default the operating mode is expected to be heating.
| Pin | Required | Mapping info |
|---|---|---|
| Inlet temperature recirculation | Yes | - |
| Operating message | No | - |
| Pump - control signal | No | - |
| Pump - operating message | No | - |
| Outlet temperature | Yes | - |
Attributes
It is not possible to change the attributes for the thermal control loop. The default values are listed just for reference.
| Attribute | Required | Mapping info | Unit |
|---|---|---|---|
| Operating mode | No | Default: heating_mode. Allowed values: cooling_mode heating_mode | - |
| Cooling - design return temperature | No | Default: 50.0 | °C |
| Cooling - design supply temperature | No | Default: 44.0 | °C |
| Cooling - minimal temperature spread | No | Default: 2.0 | K |
| Heating - design return temperature | No | Default: 50.0 | °C |
| Heating - design supply temperature | No | Default: 70.0 | °C |
| Heating - minimal temperature spread | No | Default: 5.0 | K |
Recommend Time Span
1 day to 1 week
Recommended Repetition
Every month
- After changes of operational modes, e.g., transfers to heating mode
- After changes in the control system
- After maintenance or replacements
"Temperature spread too large"
Explanation
High temperature spreads indicate a low volume flow of the heat transfer medium in the system. This can cause the energy distribution in the system to be uneven and more difficult to control. The temperature distribution within radiators in particular can be poor, which is disadvantageous for user comfort. It can also happen that not enough energy is released into the room when heating or not enough energy is extracted from the room when cooling.
Suggestion
First check whether the supply temperatures are set appropriately. In most systems, the supply temperature should be higher at lower outside temperatures than at high outside temperatures when heating. This can be achieved using a heating curve on the heating controller in the building or with the aedifion CURV controls app. How high the supply temperature should be at lower outside temperatures depends on the heating surfaces. On the one hand, you can refer to the planning documents to find out which supply temperature is intended for delivering the maximum heating performance and ensure that this supply temperature is not exceeded at low outside temperatures. On the other hand, the temperature can also be determined through testing. If the desired room temperatures are reached in the rooms and the temperature spread is high, the supply temperature should be reduced. If the temperature is not reached in individual rooms, this indicates that these rooms are being supplied with an insufficient volume flow. This problem can be addressed by reducing the resistance on the pre-adjustable valves on the radiators. The same applies in reverse for cooling. Furthermore, check the setting of the pumps. If the temperature spread is high and the pumps are set to a low delivery head, the delivery head should be increased for testing in order to observe the temperature spread. This setting can usually be made directly on the pump. Ideally, pumps that support an operating mode with a variable delivery head should be activated in this mode, since this is more energy-efficient.
"Temperature spread too small"
Explanation
Low temperature spreads indicate a high volume flow of the heat transfer medium in the system. This indicates that the heat transfer medium is only exchanging a small amount of energy within the rooms. On the one hand, this might be due to the fact that the pumps are set to an excessively high output and therefore have higher operating costs and wear out more quickly. On the other hand, the low temperature spread might imply that the heat exchangers and radiators cannot provide enough power because the temperature difference between the heating/cooling surfaces and the room is too small. This in turn suggests a supply temperature that is too low when heating and too high when cooling.
Suggestion
First check whether the supply temperatures are set appropriately. In most systems, the supply temperature should be higher at lower outside temperatures than at high outside temperatures. This can be achieved using a heating curve on the heating controller in the building or with the aedifion CURV controls app. How high the supply temperature should be set at lower outside temperatures depends on the heating surfaces. On the one hand, you can refer to the planning documents to check which supply temperature is intended for providing the maximum heating power and ensure that this supply temperature is reached at low outside temperatures. On the other hand, the temperature can also be determined by testing. If the desired room temperatures are not reached in many rooms and the temperature spread is small, the supply temperature should be increased. If the temperature is only not reached in individual rooms, this indicates that these rooms are being supplied with an insufficient volume flow. This problem can be solved by reducing the resistance at the radiator. The same applies in reverse for cooling. Continue to check the pump settings. If the temperature spread is low and the pump is set to a high delivery head, the delivery head needs to be reduced for testing purposes in order to observe the temperature spread. This setting can usually be made directly on the pump. Ideally, pumps that support an operating mode with a variable delivery head should be activated in this mode, since this is more energy-efficient.
Thermal Comfort
The Thermal Comfort analysis quantifies the thermal comfort of a room on a scale of 0-100%. First, the comfort temperature is defined for the room according to DIN EN 16798-1. This comfort temperature depends on the outside air temperature. The analysis then calculates the spread between this comfort temperature and the actual temperature of the room. Finally, the spread is converted to a percentage of thermal comfort.
Value
- Check and evaluate the thermal comfort level of a room
- Higher occupant comfort, health and performance
- Monitor room temperature
Recommended for components
- Rooms with usual conditioning like offices, schools, salesrooms
Checked conditions
- Sufficient thermal comfort
- Deviation between room temperature, comfort temperature and setpoint
This example is intended to illustrate how the thermal comfort is calculated and which options are available to customise the analysis.
Figure 1 shows the relationship between the spread (difference between the room temperature and the comfort temperature) and the percentage of thermal comfort. The thermal comfort decreases, while the spread increases the further out you go.
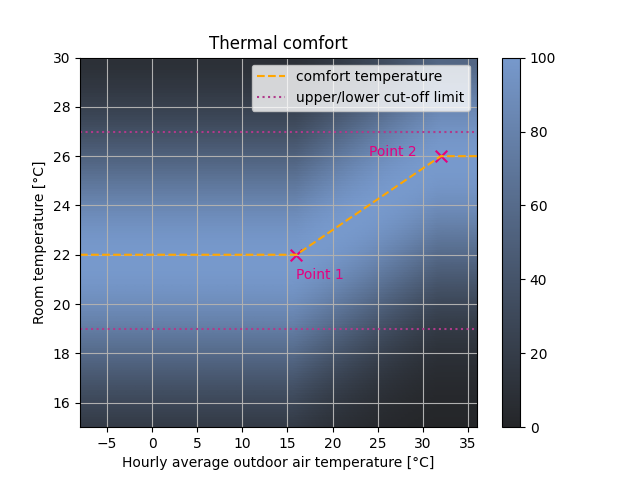
This relationship follows a normal distribution curve that produces a continuous percentage of thermal comfort, peaking at 100% when the room temperature is the same as the comfort temperature. The comfort temperature, represented by the yellow line in figure 1, follows the standard of DIN EN 16798-1 by default. However, it can be adjusted by using four attributes to move point 1 and 2. (See comfort temperature curve attributes under the section Components)
Alternativly, the pin Comfort temperature can be mapped for a customised and time-dependend comfort temperature.
The analysis also allows the setting of two cut-off limits via the attributes upper and lower limit for room temperature. If the room temperature exceeds the upper limit or falls below the lower limit, a warning is issued by the analysis. None of the limits are set by default.
A normal distribution curve for a comfort temperature of 21 °C is shown in Figure 2 (blue line).
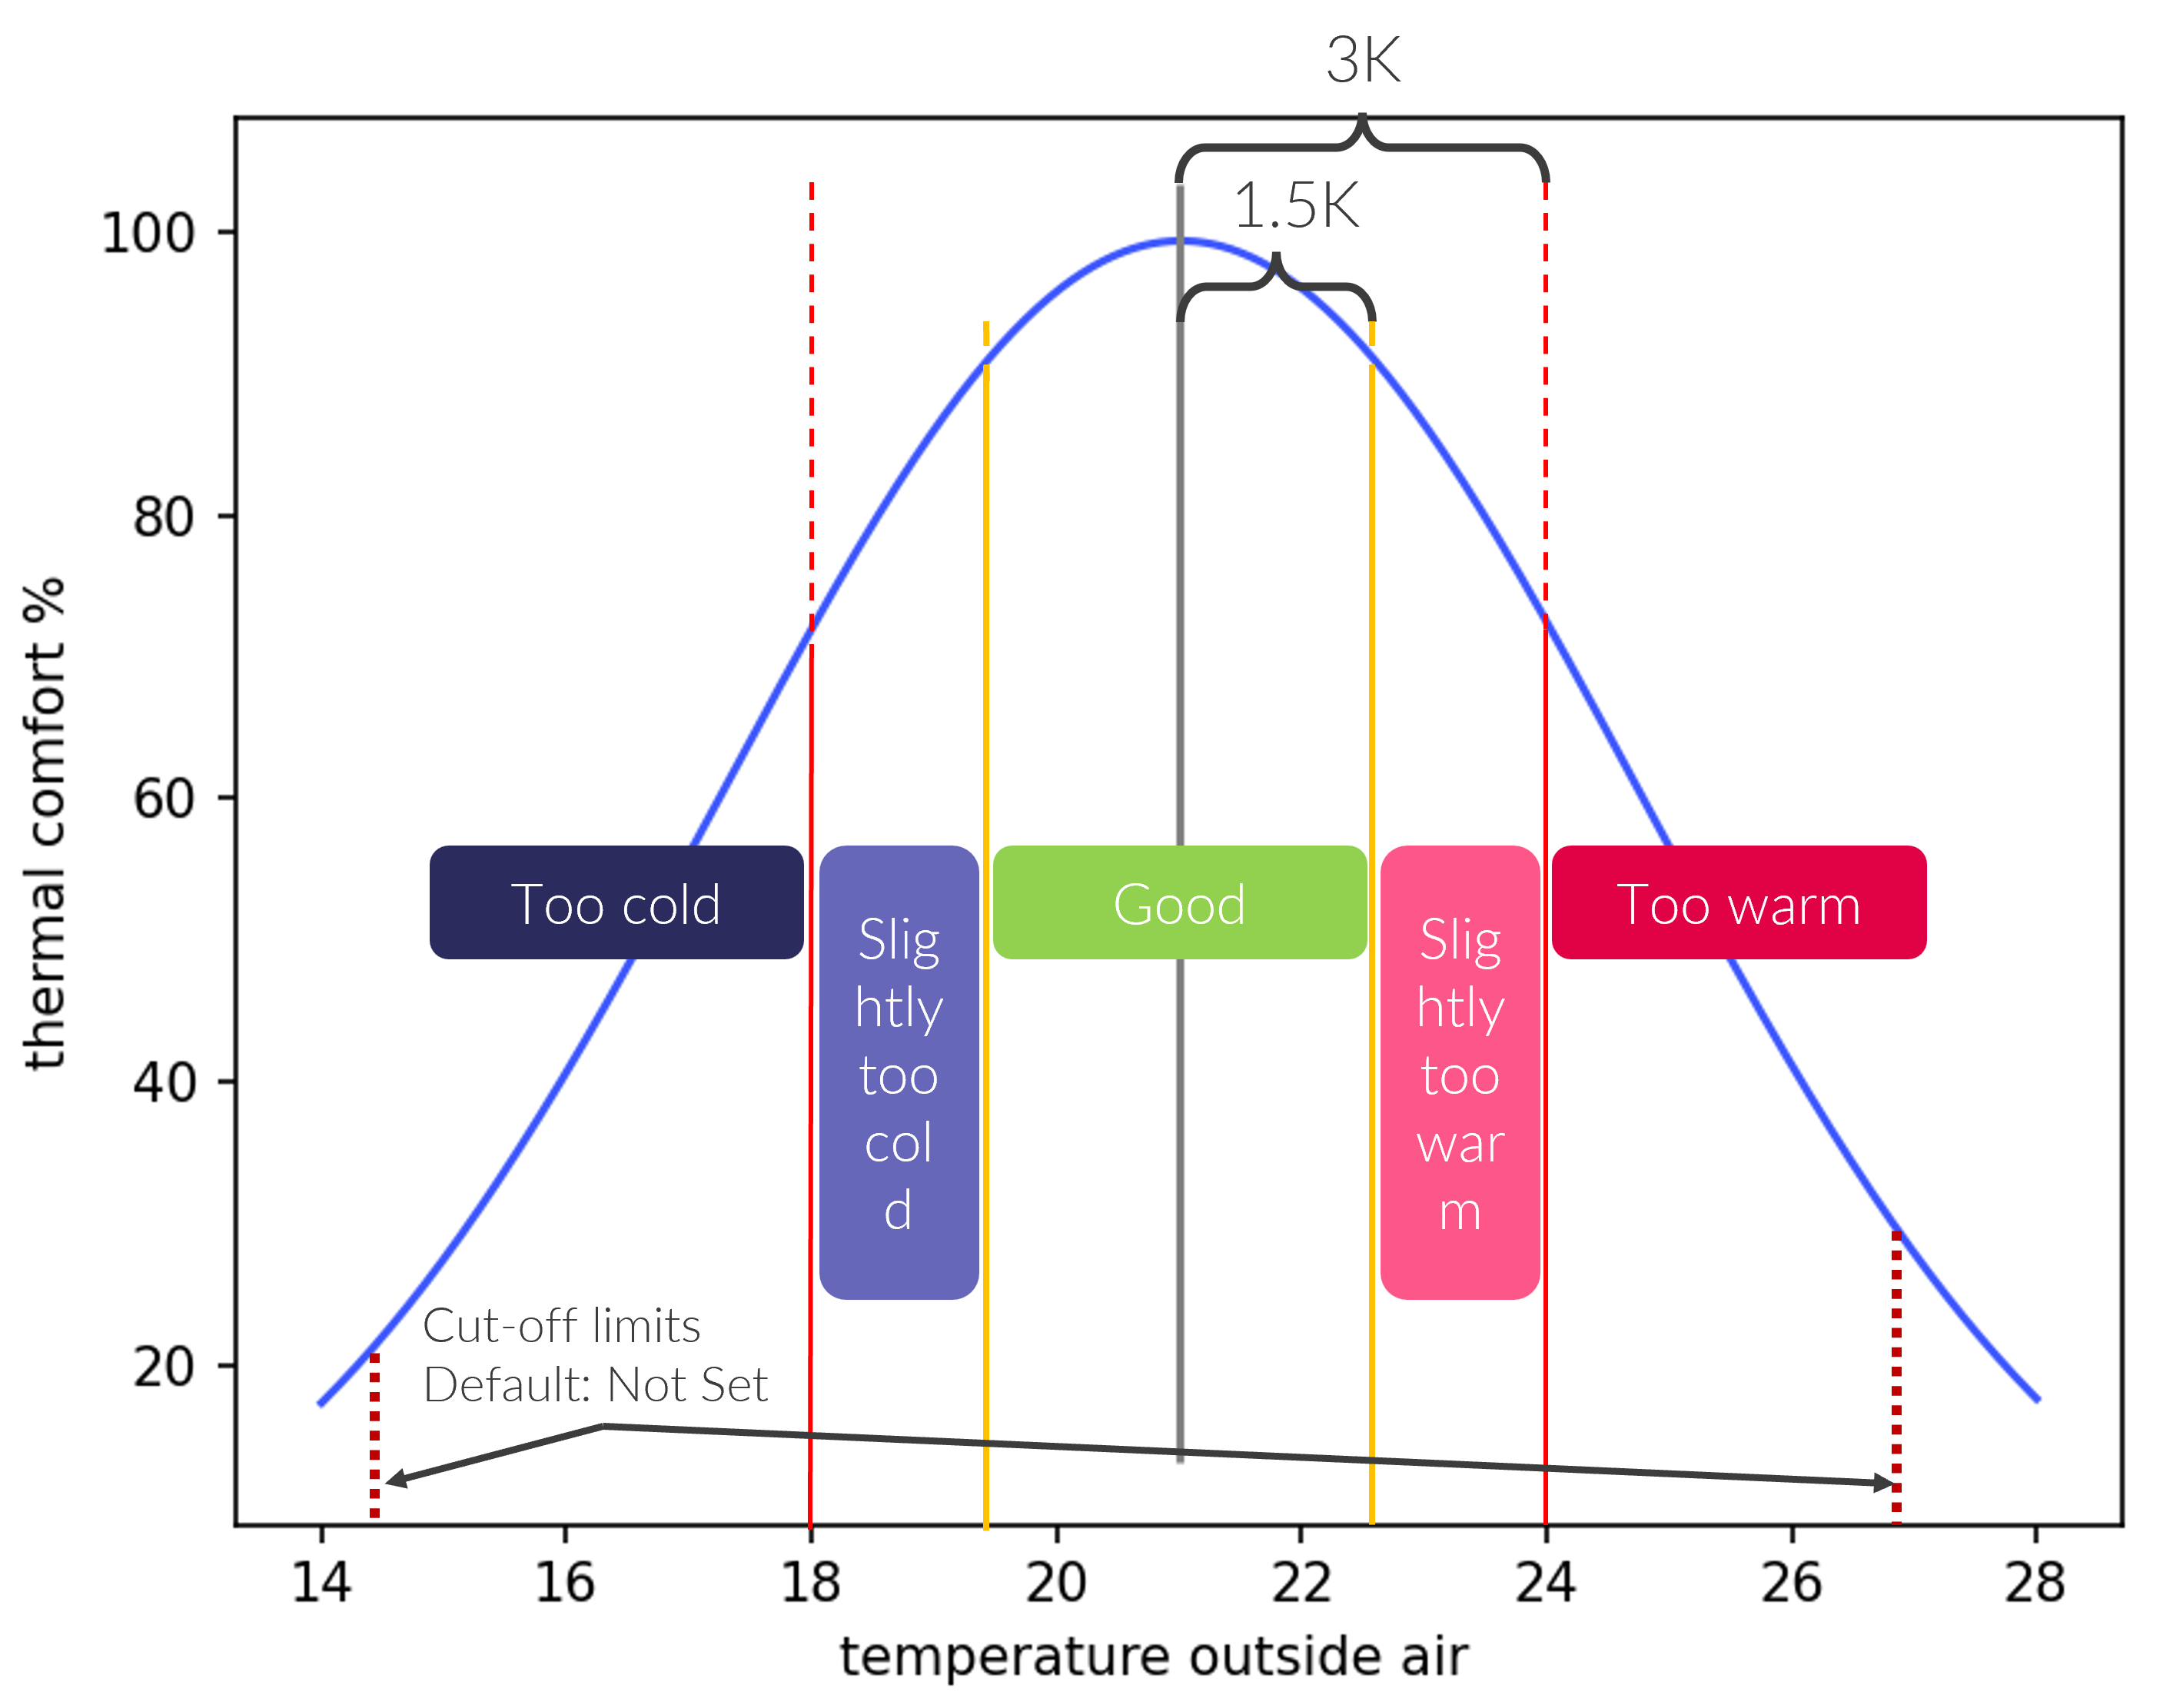
For better interlinking with the wellbeing analysis (asset cockpit), the thermal comfort is categorised into the five categories as shown below in Figure 2. In the KPIs, the relative and absolute time in the respective category is returned. The limits for each category are based on the yellow and red limits (signal colors) and can be set using the corresponding attributes for the signal colors. The maximum acceptable difference between the comfort temperature and the maximum deviation is set as the value for the attribute. By default, this is 1.5K deviation from the comfort temperature for the yellow limit and 3K for the red limit. This corresponds to a thermal comfort of 92% at the yellow limit and 72% at the red limit. This values are adjustable via two attributes for the red and yellow limit
Signal colors
| Signal color | Available | Info |
|---|---|---|
| red | Yes | Default: more than ±3K spread, thermal comfort is bad. |
| yellow | Yes | Default: between ±(1.5 to 3K) spread, thermal comfort is acceptable. |
| green | Yes | Default: within ±1.5K spread, thermal comfort is good. |
Interpretations
| Available | Info |
|---|---|
| Yes | Evaluation of the thermal comfort level. |
Recommendations
| Available | Info |
|---|---|
| Yes | Recommendations to improve the thermal comfort and adjust setpoints. |
KPIs
Operating Time
| KPI Identifier | Info | Value Range | Unit |
|---|---|---|---|
| operating time | Duration of presence, the active room control, or a set schedule attribute if the presence is not being measured. | 0 to inf | h |
| operating time.relative | Duration of presence, the active room control, or a set schedule attribute if the presence is not being measured relative to the evaluation period. | 0 to 100 | % |
Thermal comfort kpis
| KPI Identifier | Info | Value Range | Unit |
|---|---|---|---|
| Thermal comfort.mean | Average thermal comfort during the evaluation period, depending on room temperature and comfort temperature. | 0 to 100 | % |
| Thermal comfort.maximum | Maximal thermal comfort during the evaluation period, depending on room temperature and comfort temperature. | 0 to 100 | % |
| Thermal comfort.minimum | Minimal thermal comfort during the evaluation period, depending on room temperature and comfort temperature. | 0 to 100 | % |
| Thermal comfort good.relative | Duration the thermal comfort was good relative to active time. | 0 to 100 | % |
| Thermal comfort acceptable.relative | Duration the the thermal comfort was acceptable relative to active time. | 0 to 100 | % |
| Thermal comfort bad.relative | Duration the thermal comfort was bad relative to active time. | 0 to 100 | % |
| Duration thermal comfort good | Absolute time during which the thermal comfort was good. | 0 to inf | h |
| Duration thermal comfort acceptable | Absolute time during which the thermal comfort was acceptable. | 0 to inf | h |
| Thermal comfort bad.relative | Absolute time during which the thermal comfort was bad. | 0 to inf | h |
Differences
Negative values indicate that the first temperature reading was below the seccond temperature reading, positive values that the first temperature reading was above the seccond temperature reading.
Tolerances and thresholds
Usually tolerances and thresholds are 1K above and below the optimal values. The only exeptions are KPIs who return significant deviations. In this case the tolerances are 3K above and below the optimal values.
Temperature KPIs
| KPI Identifier | Info | Value Range | Unit |
|---|---|---|---|
| Difference room temperature and comfort temperature.mean | Average temperature difference between room temperature and comfort temperature. (Negative values indicate room temperature was below comfort temperature, positive values that the room temperature was above comfort temperature) | -inf to +inf | ΔK |
| Difference room temperature and comfort temperature.minimum | Minimum temperature difference between room temperature and comfort temperature. (Negative values indicate room temperature was below comfort temperature, positive values that the room temperature was above comfort temperature) | -inf to +inf | ΔK |
| Difference room temperature and comfort temperature.maximum | Maximum temperature difference between room temperature and comfort temperature. (Negative values indicate room temperature was below comfort temperature, positive values that the room temperature was above comfort temperature) | -inf to inf | ΔK |
| Duration room temperature within comfort temperature tolerance | Absolute time during which the room temperature was within the tolerance for comfort temperature. (tolerance ±1K of the comfort temperature) | 0 to inf | h |
| Duration room temperature outside comfort temperature tolerance too cold | Absolut time during which the room temperature was below the tolerance for comfort temperature. (tolerance ±1K of the comfort temperature | 0 to inf | h |
| Duration room temperature outside comfort temperature tolerance too warm | Absolut duration during which the room temperature was above the tolerance for comfort temperature. (tolerance ±1K of the comfort temperature) | 0 to inf | h |
| Duration room temperatur within comfort temperature tolerance.relative | Percentage of active time of the room in which the room temperature was within the tolerance for the comfort temperature. (tolerance ±1K of the comfort temperature) | 0 to inf | h |
| Duration room temperature outside comfort temperature tolerance too cold.relative | Percentage of active time of the room in which the room temperature was below the tolerance for the comfort temperature. (tolerance ±1K of the comfort temperature) | 0 to 100 | % |
| Duration room temperature outside comfort temperature tolerance too warm.relative | Percentage of active time of the room in which the room temperature was above the tolerance for the comfort temperature. (tolerance ±1K of the comfort temperature) | 0 to 100 | % |
| Temperature-weighted duration too cold | Cumulated temperature-weighted time during which the room temperature was below the comfort temperature threshold (threshold: room temperature -1K below comfort temperature) | 0 to -inf | °Cd |
| Temperature-weighted duration too warm | Cumulated temperature-weighted time during which the room temperature was above the comfort temperature threshold (threshold: room temperature +1K above comfort temperature) | 0 to inf | °Cd |
| Duration room temperature above upper cut-off limit | Absolute time during which the room temperature was above the upper cut-off temperature for room temperature. | 0 to inf | h |
| Duration room temperature below lower cut-off limit | Absolute time during which the room temperature was below the lower cut-off temperature for room temperature. | 0 to inf | h |
| Room temperature outside cut-off limits.relative | Percentage of active time of the room during which the room temperature was above the upper and below the lower cut-off temperature. | 0 to 100 | % |
Room temperature classification KPIs
| KPI Identifier | Info | Value Range | Unit |
|---|---|---|---|
| Duration room temperature good | Absolute time during which the room temperature was good. | 0 to inf | h |
| Duration room temperature slightly too warm | Absolute time during which the room temperature was slightly too warm. | 0 to inf | h |
| Duration room temperature slightly too cold | Absolute time during which the room temperature was slightly too cold. | 0 to inf | h |
| Duration room temperature too warm | Absolute time during which the room temperature was too warm. | 0 to inf | h |
| Duration room temperature too cold | Absolute time during which the room temperature was too cold. | 0 to inf | h |
| Duration room temperature good.relative | Percentage of active time of the room in which the room temperature was good. | 0 to 100 | % |
| Duration room temperature slightly too warm.relative | Percentage of active time of the room in which the room temperature was slightly too warm. | 0 to 100 | % |
| Duration room temperature slightly too cold.relative | Percentage of active time of the room in which the room temperature was slightly too cold. | 0 to 100 | % |
| Duration room temperature too warm.relative | Percentage of active time of the room in which the room temperature was too warm. | 0 to 100 | % |
| Duration room temperature too cold.relative | Percentage of active time of the room in which the room temperature was too cold. | 0 to 100 | % |
Setpoint KPIs
| KPI Identifier | Info | Value Range | Unit |
|---|---|---|---|
| Difference setpoint and comfort temperature.mean | Mean temperature difference between room temperature and the setpoint temperature. (Negative values indicate that the setpoint temperature was below comfort temperature, positive values that the setpoint temperature was above comfort temperature) | -inf to +inf | ΔK |
| Difference setpoint and comfort temperature.minimum | Minimum temperature difference between room temperature and the setpoint temperature. (Negative values indicate that the setpoint temperature was below comfort temperature, positive values that the setpoint temperature was above comfort temperature) | -inf to +inf | ΔK |
| Difference setpoint and comfort temperature.maximum | Maximum temperature difference between room temperature and the setpoint temperature. (Negative values indicate that the setpoint temperature was below comfort temperature, positive values that the setpoint temperature was above comfort temperature) | -inf to +inf | ΔK |
| Duration outside tolerance for comfort temperature below setpoint.relative | Percentage of active time of the room in which the comfort temperature was below the tolerance for the setpoint. (tolerance ±1K of the comfort temperature) | 0 to 100 | % |
| Duration outside tolerance for comfort temperature above setpoint.relative | Percentage of active time of the room in which the comfort temperature was above the tolerance for the setpoint. (tolerance ±1K of the comfort temperature) | 0 to 100 | % |
| Duration within tolerance for comfort temperature and setpoint.relative | Percentage of active time of the room in which the comfort temperature was within the tolerance for the setpoint. (tolerance ±1K of the comfort temperature) | 0 to 100 | % |
| Temperature-weighted duration comfort temperature below setpoint | Cumulated temperature-weighted time during which the comfort temperature was above the setpoint threshold. (threshold: comfort temperature +1K above setpoint) | 0 to inf | °Cd |
| Temperature-weighted duration comfort temperature above setpoint | Cumulated temperature-weighted time during which the comfort temperature was below the setpoint threshold. (threshold: comfort temperature -1K below setpoint) | 0 to inf | °Cd |
| Duration outside tolerance for room temperature significantly below setpoint.relative | Percentage of active time of the room in which the comfort temperature was significantly above the tolerance for the setpoint. (tolerance ±3K of the comfort temperature) | 0 to 100 | % |
| Duration outside tolerance for room temperature significantly above setpoint.relative | Percentage of active time of the room in which the comfort temperature was significantly above the tolerance for the setpoint. (tolerance ±3K of the comfort temperature) | 0 to 100 | % |
| Duration outside tolerance for room temperature above setpoint.relative | Percentage of active time of the room in which the room temperature was above the tolerance for the setpoint. (tolerance ±1K of the comfort temperature) | 0 to 100 | % |
| Duration outside tolerance for room temperature below setpoint.relative | Percentage of active time of the room in which the room temperature was below the tolerance for the setpoint. (tolerance ±1K of the comfort temperature) | 0 to 100 | % |
Setpoints
If setpoints are mapped, they allow for a better understandig of the issue why the thermal comfort may only be acceptabel or bad. If not mapped, setpoint KPIs and reccomendations regarding adjustments of the setpoints are not available. The setpoints are not relevent for the calculation of the thermal comfort.
| Pin | Required | Mapping info | Unit |
|---|---|---|---|
| Comfort temperature | No | If this pin is connected it overwrites the comfort temperature of the comfort temperature curve | °C |
| Operating message | No | Mapping of either presence (preferred) or operating message is strongly recommended. If both pins are mapped, presence is used. If both pins are not available and a schedule attribute is set, the schedule is used to calculate an operating message Default: Always presence | binary |
| Outside air temperature | No | - | °C |
| Presence | No | Mapping of either presence (preferred) or operating message is strongly recommended. If both pins are mapped, presence is used. If both pins are not available and a schedule attribute is set, the schedule is used to calculate an operating message Default: Always presence | binary |
| Temperature | Yes | - | °C |
| Temperature base setpoint | No | °C | |
| Temperature setpoint adjustment | No | - | °C |
| Temperature setpoint (calculated) | No | - | °C |
Cut-off limits
Ensure that the upper cut-off limit is always higher than the lower cut-off limit and also higher or lower than the expected comfort temperatures. Adjust the comfort temperatures if necessary. The limits can also be set individually.
Comfort temperature curve
If the values for either point of the comfort temperature curve are changed, always pay attention to the meaningfulness of the values you are using. To get an idea of where point 1 & 2 are located see the example.
| Attribute | Required | Mapping info | Unit |
|---|---|---|---|
| Upper limit for room temperatur | No | - | °C |
| Lower limit for room temperatur | No | - | °C |
| Comfort temperature curve - lower point 1 Room temperature | No | Default: 22.0 | °C |
| Comfort temperature curve - lower point 1 outside air temperature | No | Default: 16.0 | °C |
| Comfort temperature curve - upper point 2 Room temperature | No | Default: 26.0 | °C |
| Comfort temperature curve - upper point 2 outside air temperature | No | Default: 32.0 | °C |
| Thermal comfort evaluation threshold in hours per week | No | Default: 4.0 | h |
| Thermal comfort red limit | No | Default: 3 | K |
| Thermal comfort yellow limit | No | Default: 1.5 | K |
Recommend Time Span
1 week
Recommended Repetition
Every month
- After changes of presence schedules or room schedules
Virtual Meter
The Virtual Meter analysis determines the amount of electrical power, gas, heat, and water which is measured by meters or used by other components. If meter data is not available, other data sources like power can be used to infer the consumption.
When heat or cold meters are analyzed, the temperature difference and volume flow are used to calculate the "virtual heat" which is compared to the "measured heat" if the required pins are available. The Virtual Meter Analysis substitutes physical meters and enables energy/resource flow tracing.
Value
Summarized and evaluates energy/resource flow:
- Traces and provides insights to energy/resource consumption
- Additional weather normalized energy/resource consumption for meter components
- Enables comparison between hardware heat meters and calculated "virtual heat"
Recommended for components
Meters and distribution systems such as:
- Boilers
- Cold meters
- Cooling circuits
- Combined heat and power
- Electricity meters
- Gas meters
- Heat meters
- Heat pumps
- Heating circuits
- Thermal control loops
- Water meters
Checked conditions
- For heat and cold meters: compares the measured heat with the "virtual heat" (calculated by analysis), if both are available.
The virtual meter analysis was tested on a combined heat and power plant for one week. Figure 1 shows the inlet/outlet temperatures, volume flow, and heat flow of the combined heat and power plant.
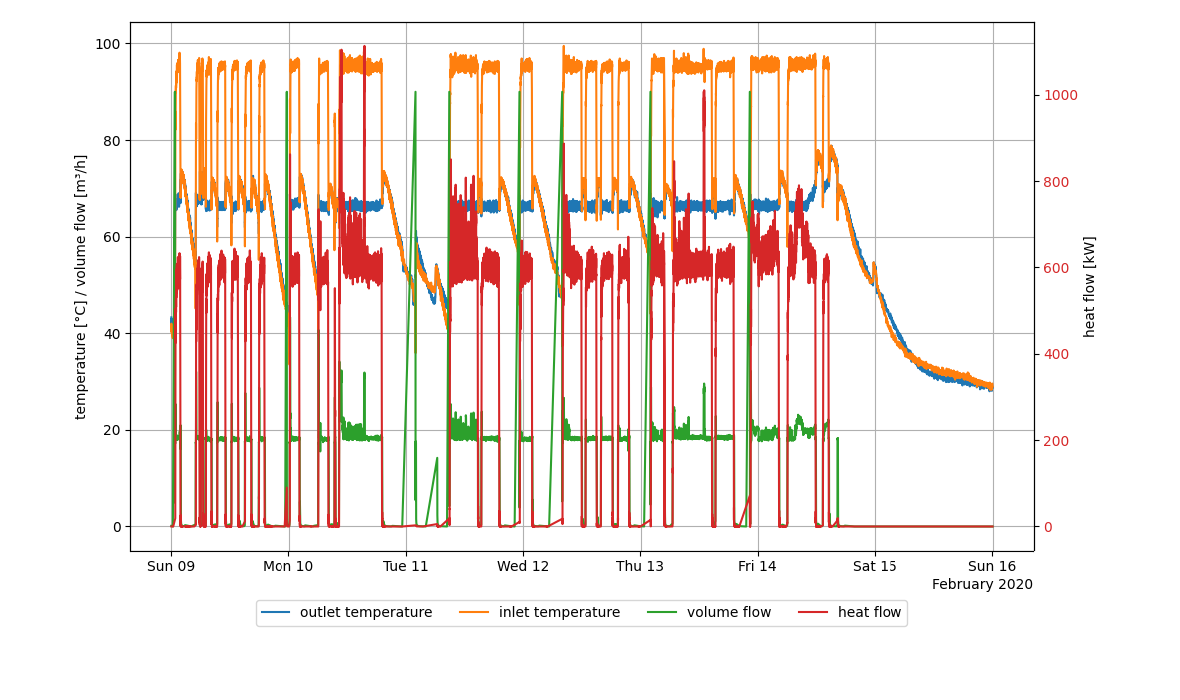
Figure 1: Temperatures, volume flow and heat flow of combined heat and power plant
The virtual heat is compared with the measured heat and based on the relatively small difference between the two heats, a green signal color is returned.
| KPI | Value | Unit |
|---|---|---|
| measured heat | 43.4 | MWh |
| measured heat flow.mean | 444.6 | kW |
| measured heat flow.minimum | 0.1 | kW |
| measured heat flow.maximum | 1113.1 | kW |
| virtual heat | 41.4 | MWh |
| virtual heat flow.mean | 324.1 | kW |
| virtual heat flow.minimum | -1213.2 | kW |
| virtual heat flow.maximum | 1061.8 | kW |
| heat difference | 2.01 | MWh |
| heat difference.relative | 4.63 | % |
The analysis only returns recommendations and evaluations if both a measured heat/heat flow is available, and a "virtual heat" is calculated. Otherwise, only KPI results are returned.
Signal colors
| Signal color | Available | Info |
|---|---|---|
| red | No | - |
| yellow | Yes | There is a significant difference between the virtual heat and the measured heat for this component or its sub-components. |
| green | Yes | There is no significant difference between the virtual heat and the measured heat for this component and all of its sub-components. |
Interpretations
| Available | Info |
|---|---|
| Yes | Either the operational rule checks of the analysis were tested positive or not. |
Recommendations
| Available | Info |
|---|---|
| Yes | Consider re-calibrating the heat meter. |
KPIs
All KPIs are extended with a suffix that describes which data source was used to measure or calculate the consumption. F.e. heat.from pin Heating energy
Statistics of electrical energy
The .weather normalized variant below corrects for the weather actually experienced during the period. See Weather normalization.
| KPI Identifier | Info | Value Range | Unit |
|---|---|---|---|
| electrical power.maximum | Largest electrical power | -inf to inf | kW |
| electrical power.minimum | Smallest electrical power | -inf to inf | kW |
| electrical power.mean | Average electrical power | -inf to inf | kW |
| electrical energy | Total electrical energy consumed during the analysis period | -inf to inf | MWh |
| electrical energy.weather normalized | Total weather normalized electrical energy consumed during the analysis period | -inf to inf | MWh |
Statistics of gas consumption
| KPI Identifier | Info | Value Range | Unit |
|---|---|---|---|
| gas volume flow.maximum | Largest gas volume flow | -inf to inf | m3/h |
| gas volume flow.minimum | Smallest gas volume flow | -inf to inf | m3/h |
| gas volume flow.mean | Average gas volume flow | -inf to inf | m3/h |
| gas volume | Total gas volume consumed during the analysis period | -inf to inf | m3 |
Statistics of heat
Negative values indicate cooling, while positive indicate heating.
Virtual and measured heat:
The "virtual heat" refers to heat calculated using temperatures and volume flows where "measured heat" refers to heats supplied by physical heat meters. The KPIs and time series are available for both cases and referred to as either measured or virtual heats e.g.:
measured heat flow is the heat flow measured by a heat meter
Units:
The units of the returned heat and heat flow are selected according to the magnitude of the result. Typical units are presented in the table below. Other possible units include MWh for heat and MW or W for heat flow.
Heat pump:
The KPI identifiers are extended by the prefix condenser or evaporator to specify the side of the heat pump the virtual heat meter is applied on. E.g.:
heat flow.maximum will be evaporator heat flow.maximum
The .weather normalized variant below corrects for the weather actually experienced during the period. See Weather normalization.
| KPI Identifier | Info | Value Range | Unit |
|---|---|---|---|
| heat flow.maximum | Largest heat flow | -inf to inf | kW |
| heat flow.minimum | Smallest heat flow | -inf to inf | kW |
| heat flow.mean | Average heat flow | -inf to inf | kW |
| heat | Aggregated heat transferred | -inf to inf | kWh |
| heat.weather normalized | Aggregated weather normalized heat transferred | -inf to inf | kWh |
| heat difference | Difference between measured and virtual heat | -inf to inf | kWh |
| heat difference.relative | Percentage difference between virtual and measured heat | 0 to 100 | % |
Statistics of water consumption
| KPI Identifier | Info | Value Range | Unit |
|---|---|---|---|
| water volume flow.maximum | Largest water volume flow | -inf to inf | m3/h |
| water volume flow.minimum | Smallest water volume flow | -inf to inf | m3/h |
| water volume flow.mean | Average water volume flow | -inf to inf | m3/h |
| water volume | Total water volume consumed during the analysis period | -inf to inf | m3 |
Output KPI prioritization
Heat and cold meters provide consumption KPIs from all possible data sources. Which result is used for the meter page and asset overview is prioritized in the following way:
- heat/cold.from pin Heating/Cooling energy
- heat/cold.from pin Heating/Cooling energy consumption values
- heat/cold.from pin Heating/Cooling power
- heat/cold.from volume flow and temperature spread
Weather normalization
When calculating the weather normalized energy consumption, pins and attributes from the building component or weather station components are checked for the outside air temperature, room temperature and heating/cooling limit temperatures.
The outside air temperature is loaded from the following sources and priorities:
- Building pin outside air temperature
- Weather station pin outside air temperature
- Weather service
Additionally, the following building attributes can be set:
| Attribute | Required | Mapping info |
|---|---|---|
| Room temperature | No | Fallback: 22 °C |
| Cooling limit temperature | No | Default: 24 °C |
| Heating limit temperature | No | Default: 20 °C |
| Pin | Required | Mapping info |
|---|---|---|
| Heating energy | No | - |
| Heating energy consumption values | No | - |
| Heating power | No | - |
| Supply temperature | No | - |
| Return temperature | No | - |
| Volume flow | No | - |
| Attribute | Required | Mapping info |
|---|---|---|
| Weather normalization | No | Default: True |
| Pin | Required | Mapping info |
|---|---|---|
| Cooling energy | No | - |
| Cooling energy consumption values | No | - |
| Cooling power | No | - |
| Supply temperature | No | - |
| Return temperature | No | - |
| Volume flow | No | - |
| Attribute | Required | Mapping info |
|---|---|---|
| Weather normalization | No | Default: True |
| Pin | Required | Mapping info |
|---|---|---|
| Active energy | No | - |
| Active energy consumption values | No | - |
| Active power | No | - |
| Attribute | Required | Mapping info |
|---|---|---|
| Weather normalization | No | Default: False |
| Energy application | No | Default: General use |
| Pin | Required | Mapping info |
|---|---|---|
| Heating energy consumption values | No | - |
| Gas quantity | No | - |
| Gas quantity consumption values | No | - |
| Volume flow | No | - |
| Attribute | Required | Mapping info |
|---|---|---|
| Weather normalization | No | Default: True |
Volume flow approximation
For cooling and heating circuits, the volume flow can be approximated with the nominal volume flow if the necessary information is provided by the component pins and attributes. The following are required in any case: valve type attribute and a timeseries representing the activity of the component. The timeseries can be inferred from different candidates of the pump, valve or general pins of the circuit. The nominal volume flow can either be provided by its attribute or inferred from the attributes nominal power and supply/return design temperatures. Attribute defaults for the volume flow approximation are not considered since it would lead to inaccurate calculations. For a 3-way-valve, the volume flow is considered to be equal to the nominal volume flow while the circuit is active. If the valve type is 2-way, the valve position is also required to determine the volume flow.
| Pin | Required | Mapping info |
|---|---|---|
| Cooling energy | No | - |
| Cooling power | No | - |
| Supply temperature | No | - |
| Return temperature | No | - |
| Volume flow | No | - |
| Valve - position | No | - |
| Attribute | Required | Mapping info |
|---|---|---|
| Valve type | No | Default not considered: Attribute has to be set by user |
| Nominal volume flow | No | Default not considered: Attribute has to be set by user |
| Nominal power | No | Default not considered: Attribute has to be set by user |
| Design supply temperature | No | Default not considered: Attribute has to be set by user |
| Design return temperature | No | Default not considered: Attribute has to be set by user |
| Pin | Required | Mapping info |
|---|---|---|
| Heating energy | No | - |
| Heating power | No | - |
| Supply temperature | No | - |
| Return temperature | No | - |
| Volume flow | No | - |
| Valve - position | No | - |
| Attribute | Required | Mapping info |
|---|---|---|
| Valve type | No | Default: not considered, attribute has to be set by the user |
| Nominal volume flow | No | Default: not considered, attribute has to be set by the user |
| Nominal power | No | Default: not considered, attribute has to be set by the user |
| Design supply temperature | No | Default: not considered, attribute has to be set by the user |
| Design return temperature | No | Default: not considered, attribute has to be set by the user |
| Pin | Required | Mapping info |
|---|---|---|
| Heating energy | No | - |
| Heating power | No | - |
| Supply temperature | No | - |
| Return temperature | No | - |
| Volume flow | No | - |
| Pin | Required | Mapping info |
|---|---|---|
| Heating energy | No | - |
| Heating power | No | - |
| Supply temperature | No | - |
| Return temperature | No | - |
| Volume flow | No | - |
The Virtual Heat Meter is determined on the condenser and evaporator side depending on the mapped datapoints.
| Pin | Required | Mapping info |
|---|---|---|
| Condenser - heating energy | No | Required, if condenser shall be analyzed. |
| Condenser - heating power | No | Required, if condenser shall be analyzed. |
| Condenser - inlet temperature | No | Required, if condenser shall be analyzed. |
| Condenser - outlet temperature | No | Required, if condenser shall be analyzed. |
| Condenser - Volume flow | No | Required, if condenser shall be analyzed. |
| Evaporator - heating energy | No | Required, if evaporator shall be analyzed. |
| Evaporator - heating power | No | Required, if evaporator shall be analyzed. |
| Evaporator - inlet temperature | No | Required, if evaporator shall be analyzed. |
| Evaporator - outlet temperature | No | Required, if evaporator shall be analyzed. |
| Evaporator - Volume flow | No | Required, if evaporator shall be analyzed. |
| Pin | Required | Mapping info |
|---|---|---|
| Water quantity | No | - |
| Water quantity consumption values | No | - |
| Volume flow | No | - |
Recommend Time Span
1 day to 1 month
Recommended Repetition
Every month
Weather Station
Two important sensors for HVAC system control are the outdoor air temperature sensor and the outdoor air humidity sensor. Many control decisions, e.g., what amount of heat/humidity is to be provided, and the switching between heating and cooling modes, are made based on the measured outdoor temperature and humidity. The sensors are prone to wear out over the lifetime of the building. Furthermore, the sensors are often influenced by solar radiation or heat emitted from components in its surrounding. Wrongly measured outside air temperature or humidity directly corresponds to a thermal over/under supply of the building or incorrect indoor humidity, often leading to poor user comfort and increased energy consumption.
The Weather Station analysis identifies installation errors and measurement offsets of the outdoor air temperature sensor and derives optimization measures for better outdoor air temperature measuring.
This analysis can only be performed for periods of at least one week. Furthermore, the minute and second values of the start and end times are disregarded in the calculation to accommodate the full hours of the weather data (i.e., "2020-01-01 01:12:55" becomes "2020-01-01 01:00:00").
Value
- Higher operational performance due to reliable information about outside air conditions
- Higher occupant comfort, health, and performance
- Lower operating costs
- Better system coordination in systems with redundant sensors
Recommended for components
- Weather station
Checked conditions
- Offset between measured outdoor air temperature and weather service reference data
- Offset between measured outdoor air humidity and weather service reference data
- Outdoor air temperature sensor is mistakenly influenced by solar radiation
- Outdoor air temperature sensor is mistakenly influenced by its surrounding, e.g., exhaust gases
- Outdoor air temperature measures are compliant to weather service reference data
For this Weather Station analysis we instantiated a "weather station" component and analyzed a week of weather data. The following plot shows the measured temperature of a sensor located at a building facade. During the reviewed period in the summer, the sensor is influenced in the afternoon.
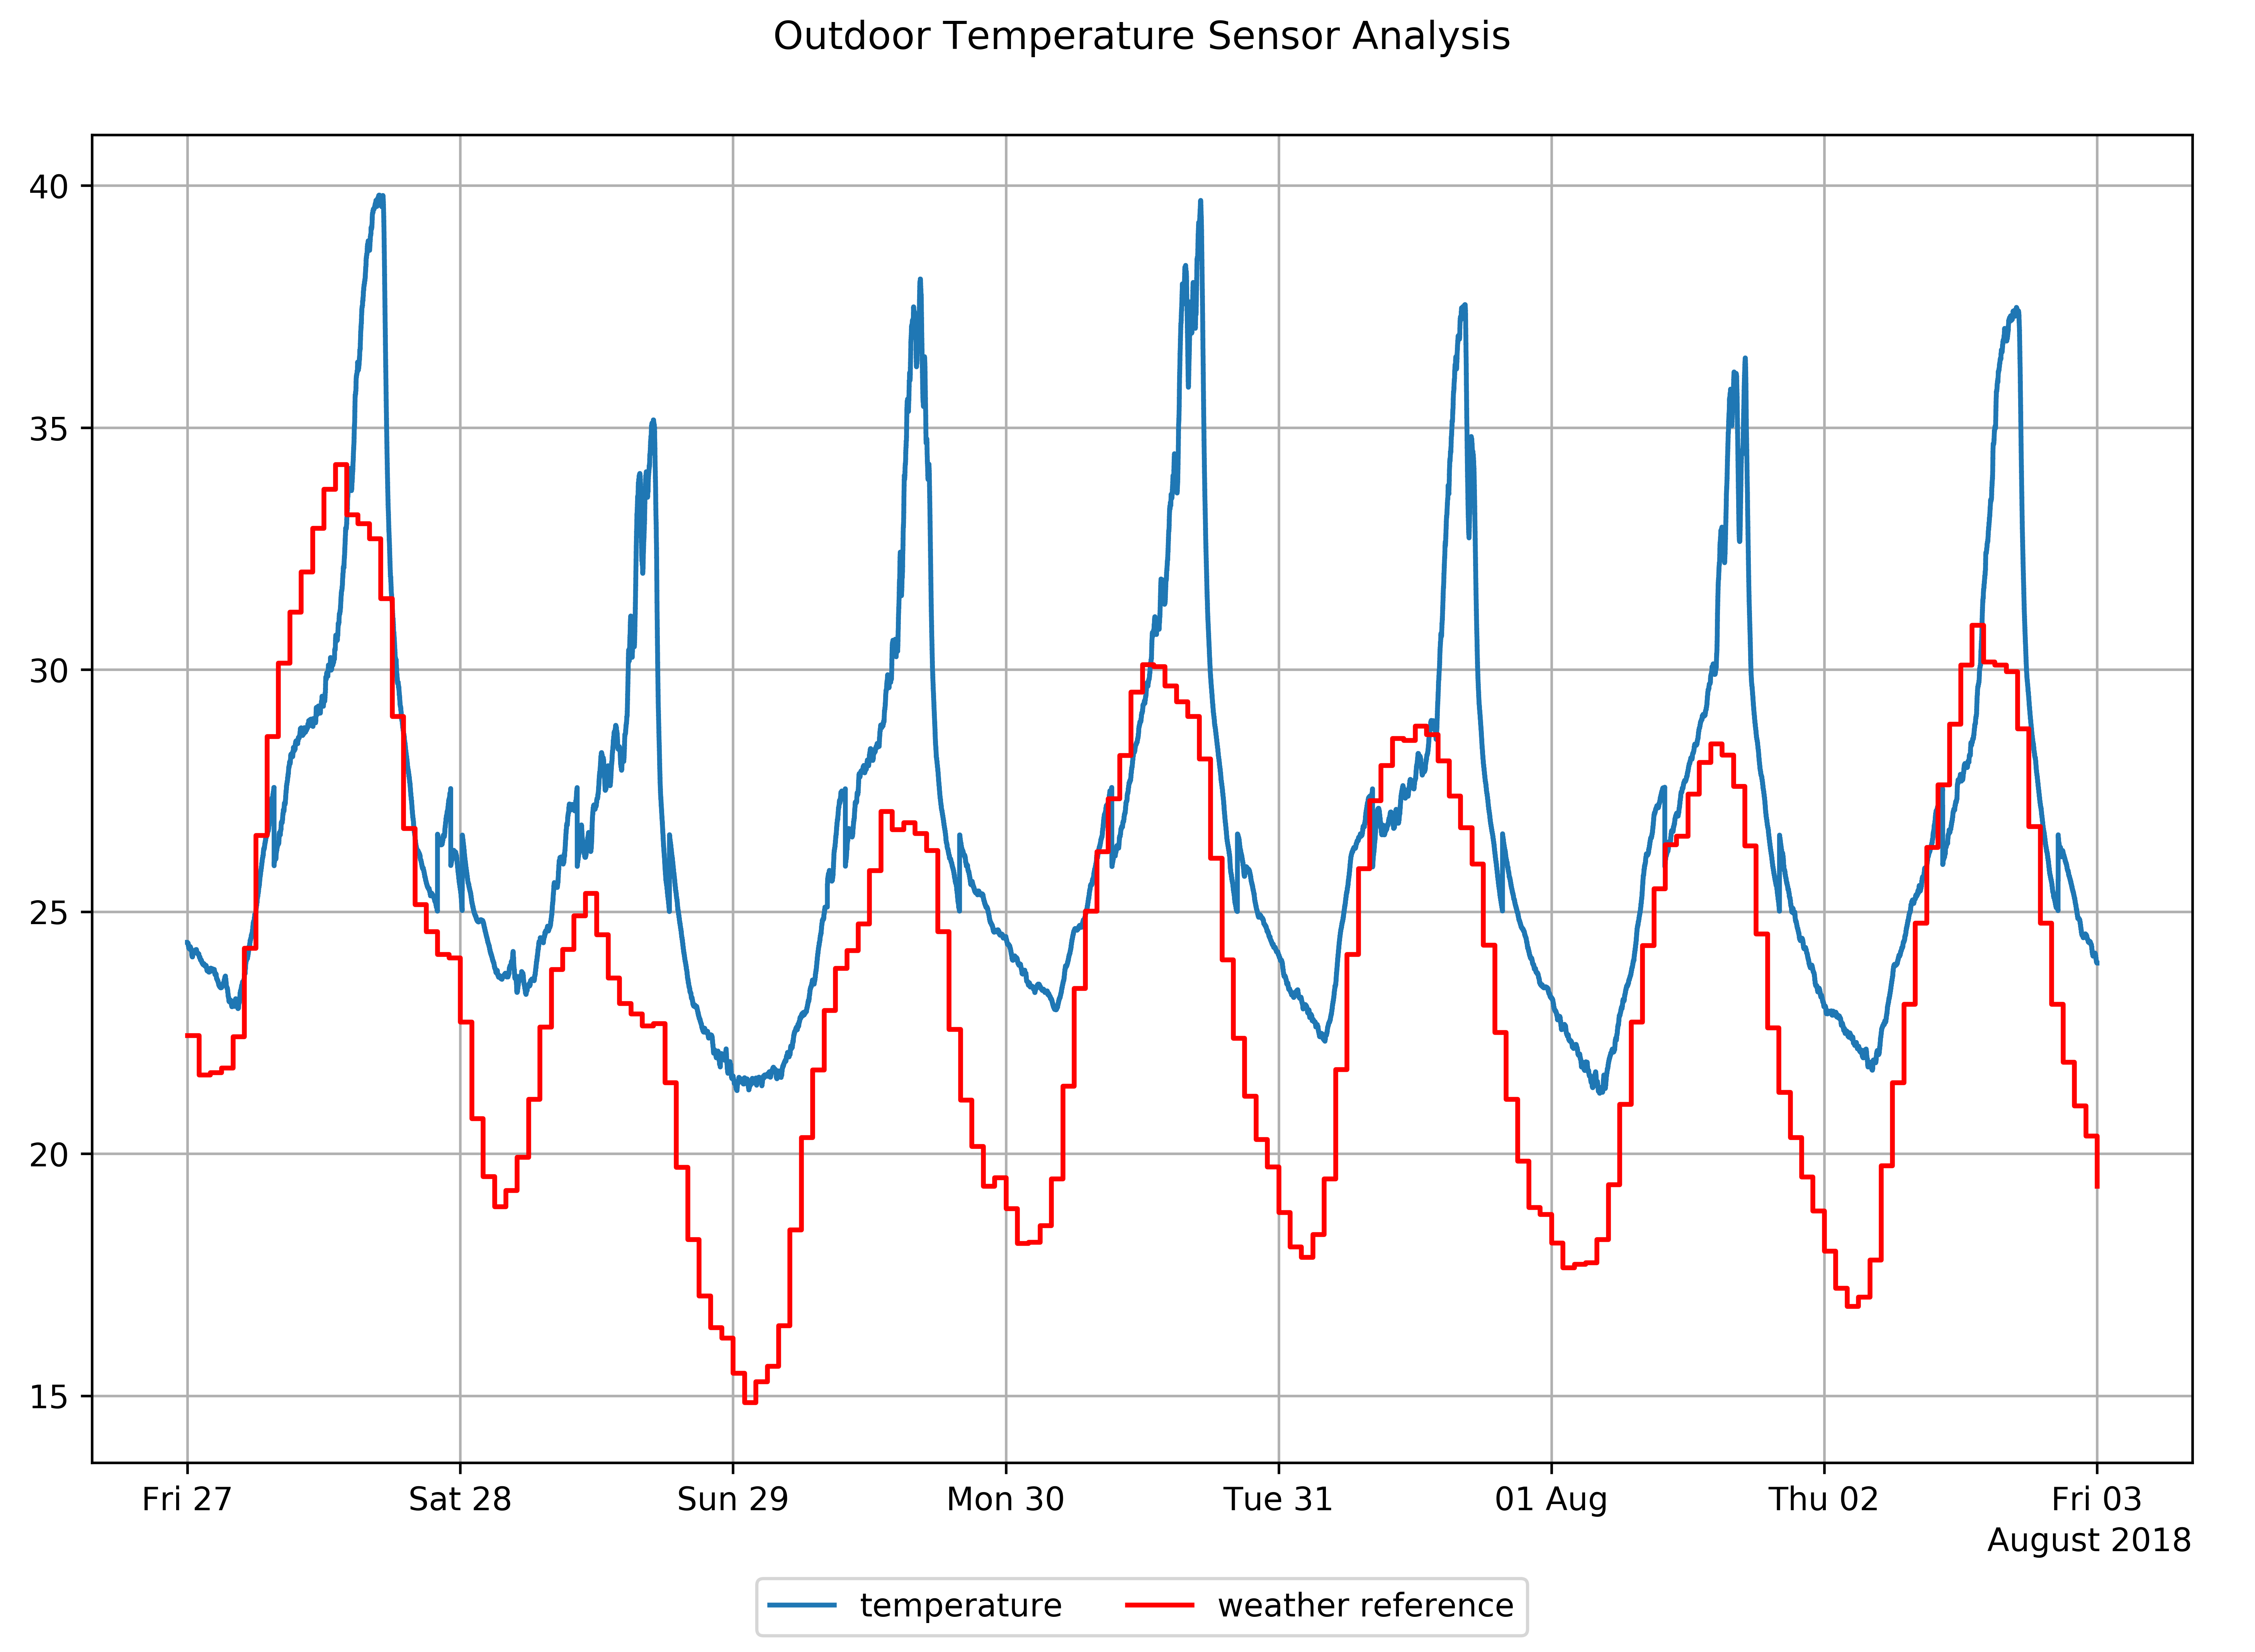
Figure 1: Measured data of the outside air temperature and reference outside air temperature
In figure 1 you can see a significant difference between sensor and weather reference. This is also reflected in the value of the calculated KPIs. During the analysis period, all 7 days are recognized by the KPI as "radiation influenced days".
| KPI | Value | Unit |
|---|---|---|
| temperature mean absolute error | 3.31 | Kelvin |
| temperature error (95th percentile) | 8.76 | Kelvin |
| radiation influenced.relative | 100 | % |
| radiation influenced days | 7 | count |
The error metrics used in this analysis are the mean absolute error and error at the 95th percentile. To evaluate the temperature error at the 95th percentile, the deviation between the measured outside air temperature and the reference outside air temperature is sorted by deviation magnitude and plotted over the normalized time, as can be seen in figure 2.
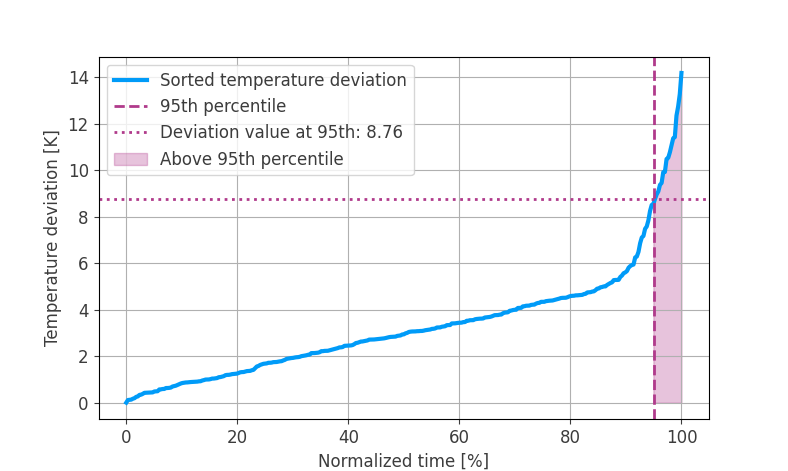
Figure 2: Sorted temperature deviation with evaluation at 95th percentile
The deviation value that is evaluated is taken from the 95th percentile. This means that for 5% (8.4 hours for one week) of the analysis period, the temperature deviation was equal to or greater than the deviation value at the 95th percentile. For this example we have a temperature deviation of 8.76 K or greater for 5% of the analysis period.
Signal colors
| Signal color | Available | Info |
|---|---|---|
| red | Yes | Significant solar radiation influence and/or offset identified. |
| yellow | Yes | Partial solar radiation influence and/or moderate offset identified. |
| green | Yes | Sufficient accuracy of outdoor air measurements. |
Interpretations
| Available | Info |
|---|---|
| Yes | Interpretations summarize the result of the analysis. |
Recommendations
| Available | Info |
|---|---|
| Yes | Recommendations to improve outdoor air temperature measurement, if necessary or re-calibrate the sensor, if physically implausible measures are observed. No recommendation, in case of sufficient measurement quality. |
KPIs
| KPI Identifier | Info | Value Range | Unit |
|---|---|---|---|
| temperature mean absolute error | Mean absolute error between the measured outdoor air temperature and the reference data set | 0 to inf | Kelvin |
| temperature error (95th percentile) | Temperature error at the 95th percentile between the measured outdoor air temperature and the reference data set | 0 to inf | Kelvin |
| radiation influenced days.relative | Ratio of days with more than one hour of sun radiation influence to days analyzed | 0 to 100 | % |
| radiation influenced days | Days with more than one hour of sun radiation influence | 0 to inf | days |
| humidity mean absolute error | Mean absolute error of the offset between measured outdoor air relative humidity and the reference data set | 0 to inf | Kelvin |
The project location is required to check temperature measurement, it is used to determine sunrise and sunset times. The weather service needs to be active in the project to use this analysis.
| Pin | Required | Mapping info |
|---|---|---|
| Humidity | No | Mandatory for outside air humidity checkup. |
| Reference relative humidity | No | Use datapoint as source of reference data. This pin is required if Humidity should be checked. |
| Reference temperature | No | Use datapoint as source of reference data. This pin is required if Temperature should be checked. |
| Temperature | No | Mandatory for outside air temperature checkup. |
| Attribute | Required | Mapping info |
|---|---|---|
| Latitude | No | This attribute is not used anymore, please use the project location. |
| Longitude | No | This attribute is not used anymore, please use the project location. |
Recommend Time Span
At least 1 week, longer time spans are recommended
Recommended Repetition
Every month
- After changes of operational modes, e.g., transfers to heating mode
- After changes in the control system
- After maintenance or replacements
Wellbeing
The Wellbeing analysis aggregates thermal comfort and room air quality for several/all Room components in the project in order to estimate the overall indoor wellbeing of users of the building. Thus, this is an analysis of the component building.
Depending on the available sensors on room level, the analysis will determine the most accurate wellbeing estimation possible and adjust its benchmarking.
Value
- Insights into the thermal comfort of all rooms in the building
- Insights into the air quality of rooms
- Benchmarking of wellbeing
Recommended for components
Buildings
Checked conditions
- Wellbeing
- Thermal comfort (according to Fanger)
- Air quality
This example shows the results of an Wellbeing analysis displayed in the Asset Overview.

Figure 1: Wellbeing Asset Overview result overview
Above all the result cards the interpretation text of the result is highlighted with the signal color of the result. In the top left the current KPI and the monthly trend is shown. On the right side of that you will find the recommendations of this result as well as further information about the function.
The six plots below are:
- The building benchmark
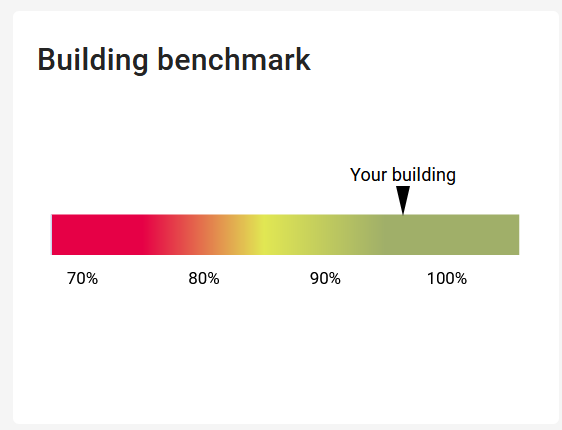
Figure 2: Wellbeing Asset Overview plot bullet graph
The month´s average wellbeing is plotted inside a bullet graph showing the limits of the signal color.
- Compared to last months
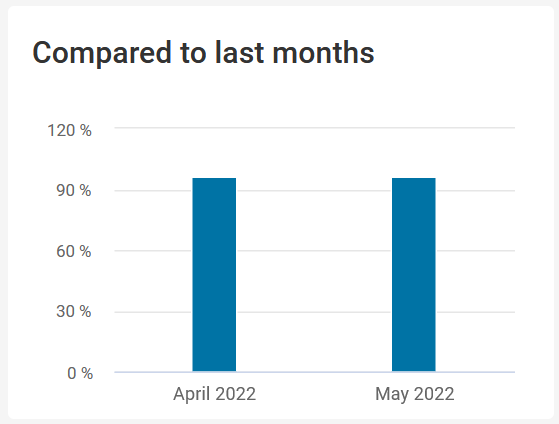
Figure 3: Wellbeing Asset Overview plot month comparison
The plot shows the current KPI of up to the last three months, including the month of the analysis.
- Reduction by cause
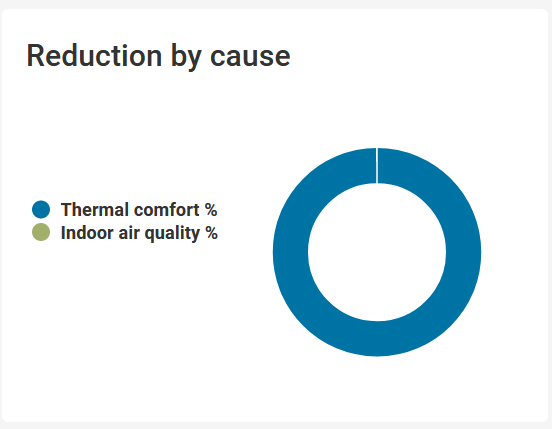
Figure 4: Wellbeing Asset Overview plot Reduction by cause
The plot shows the reason why the wellbeing in the building is reduced. The reasons (currently Thermal comfort and Indoor air quality) are weighted by the amount they contributed to the reduction.
- Percentage of people dissatisfied with thermal comfort
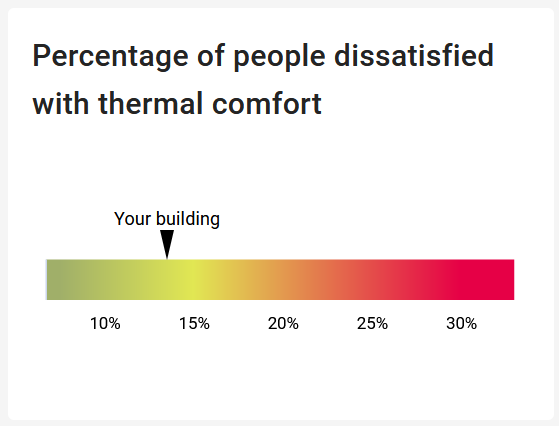
Figure 5: Wellbeing Asset Overview plot Percentage of people dissatisfied
The plot shows the percentage of people in an average group who would be dissatisfied with the thermal comfort accross all rooms.
- Thermal comfort compared to last months
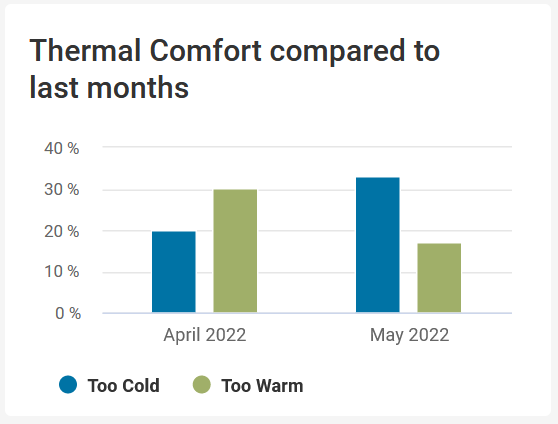
Figure 6: Wellbeing Asset Overview plot thermal comfort last months
The plot shows the thermal comfort of the last three months, split into too warm and too cold.
- Thermal comfort
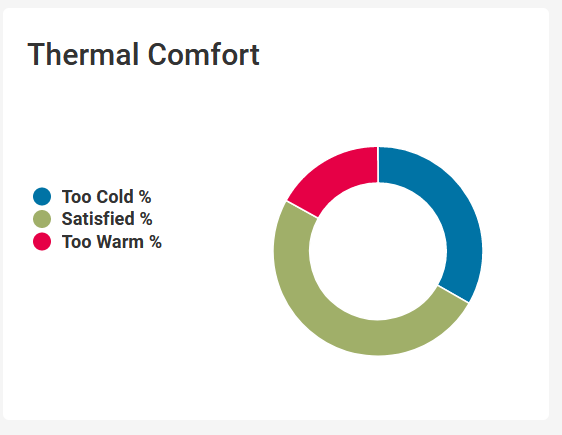
Figure 7: Wellbeing Asset Overview plot thermal comfort
The plot shows the breakdown of predicted thermal comfort votes how what percentages of people are likely to feel "too cold", "satisfied" and "too warm".
Signal colors
| Signal color | Available | Info |
|---|---|---|
| red | Yes | Wellbeing significantly reduced for this building. |
| yellow | Yes | Wellbeing reduced for this building. |
| green | Yes | Wellbeing as expected for this building. |
Interpretations
| Available | Info |
|---|---|
| Yes | Interpretations summarize the result of the analysis. |
Recommendations
| Available | Info |
|---|---|
| Yes | Info text and recommendation for action. |
KPIs
Summary KPI
| KPI reference | Info | Value Range | Unit |
|---|---|---|---|
| current | Wellbeing | 0 to 100 | % |
| development | Change in wellbeing compared to last analysis period | -inf to inf | % |
Timeseries
The timeseries is saved as a virtual datapoint. Every run of the analysis will add the summary KPI (current value) as an observation at the start of the analysis period to the timeseries.
| Timeseries datapointID | Info | Unit |
|---|---|---|
| {project_id}_{instance_id}_productivity | Productivity timeseries | % |
| {project_id}_{instance_id}_thermal_comfort_warm | Thermal comfort too warm timeseries | h |
| {project_id}_{instance_id}_thermal_comfort_cold | Thermal comfort too cold timeseries | h |
Plots
| Identifier | Type | Info | Unit |
|---|---|---|---|
| benchmark | bullet_graph | Wellbeing benchmarking including color scale Automatically adjusted depending on availability of thermal comfort and room air qualitiy determination | % |
| month_comparison | bar_chart | Wellbeing of the last 3 months | % |
| pie_chart_productivity | pie_chart | Reasons for wellbeing reduction by loss category | % |
| co2 | gauge_chart | Average indoor air CO2 concentration during occupancy Optional plot: Availability requires CO2 sensors | ppm |
| temperature | gauge_chart | Average temperature during occupancy Optional plot: Availability requires temperature sensors | °C |
| gauge_chart | gauge_chart | Average humidity during occupancy Optional plot: Availability requires humidity sensors | % |
| benchmark_thermal_comfort | bullet_graph | Percentage of people dissatisfied with thermal comfort. Minimum of people dissatisfied is 5 % in regards to Fanger Optional plot: Availability requires temperature sensors | % |
| month_comparison_thermal_comfort | bar_chart | Thermal comfort compared to last months Optional plot: Availability requires temperature sensors | % |
| pie_chart_thermal_comfort | pie_chart | Thermal Comfort Optional plot: Availability requires temperature sensors | % |
| Pin | Required | Mapping info | Unit |
|---|---|---|---|
| - | - | - | - |
| Attribute | Required | Mapping info | Unit |
|---|---|---|---|
| - | - | - | - |
Sub-components
At leat one sub-component is needed to get a result for this analysis function.
| Pin | Required | Mapping info | Unit |
|---|---|---|---|
| Presence | No | Presence message is used to reduce evaluation to periodes of actual room usage 1 = presence 0 = no presence | binary |
| Operating message | No | Operating message of room control will be considered in case no presence data point is mapped 1 = operating 0 = switched-off | binary |
| Temperature | No | Necessary to determine thermal comfort and reqired in case CO2 is not mapped | °C |
| Relative humidity | No | Needed for high precision determination of thermal comfort | % |
| CO2 | No | Necessary to determine room air quality and reqired in case temperature is not mapped | ppm |
| Outside air temperature | No | Needed for high precision determination of thermal comfort | °C |
| Attribute | Required | Mapping info | Unit |
|---|---|---|---|
| Area | No | Results will be averaged over the room areas if all are provided. If not all are provided, a simple average is used | m2 |
| Calculation of user satisfaction | Yes | Flag a room to be considered for the wellbeing analysis True: Room is considered False Room in not considered | binary |
Adding the weather station is optional. It overwrights mapping on a room level for the regarding pins, thus filling missing mappings.
| Pin | Required | Mapping info | Unit |
|---|---|---|---|
| Temperature | No | Needed for high precision determination of thermal comfort | °C |
| Attribute | Required | Mapping info | Unit |
|---|---|---|---|
| - | - | - | - |
Recommend Time Span
1 month
Recommended Repetition
Monthly
- Continuously monitor wellbeing
- Identifying high impact wellbeing optimization measures
- Track success of wellbeing measures
Information
The library of analytics functions is constantly expanding. If you are missing an analytics function, wish to implement your own functions, or want us to implement it for you, feel free to contact us.