Framework
A detailed specification of the .analytics framework.
Introduction
Figure 1 provides an overview over the aedifion.analytics framework. Each item of the figure is explained in the chapter Technical documentation, while the chapter Process provides inside into the aedifion.analytics workflow.
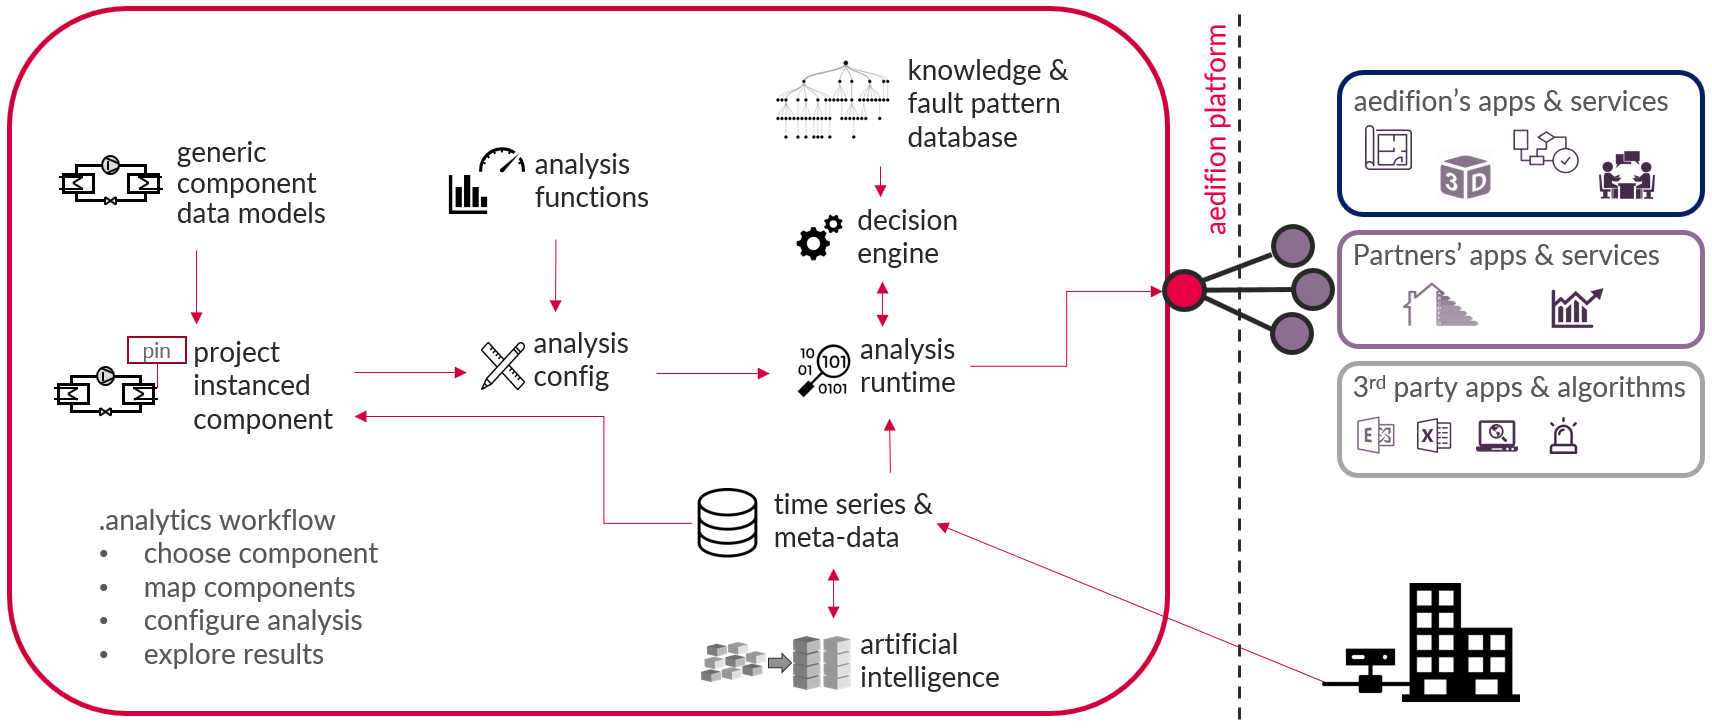
Figure 1: aedifion.analytics framework
Technical documentation
The aedifion.analytics framework consists of a component data model library, a library of analysis functions, a knowledge & fault pattern database, a decision engine, an analysis configuration pattern, and an analysis runtime environment. Any framework interactions including analysis results are available via APIs.
Component data model library
Short summary on terminology:
- Components are virtual or logical objects within a building or energy-related plants, such as e.g. pumps, boilers, thermal zones, control loops and so forth.
- Component data models are generic data models of components.
- Instanced components are component data models instanced for a specific project. They can be mapped to adapt them to specific projects.
- Mapping is the process of linking datapoints to pins of the component data model and adding meta data tags.
All component data models are collected in the aedifion component data model library. The component data models needed for a specific project can be chosen from this library. As soon as a component gets instanced to a specific project, it can be mapped to specify it for that project. Configuring an instanced component with analysis functions enables its analysis.
Learn more? Explore the available components.
Analysis functions
Analysis functions are granular and generic algorithms to analyse the operation of components.
Analysis functions are available per component data model and get executed on mapped pins and meta data of instanced components. E.g., an analysis of plant cycles is available for several instanced components like heat pumps, air handling units, boilers and so forth. This analysis requires a mapping of the pin operating message of the analyzed instanced component.
Learn more? Explore the available analysis functions.
Analysis runtime
The analysis runtime is the engine which executes analysis determinations. It utilizes stream and batch processing services of the aedifion.io platform and performs evaluations of the analysis configuration on demand. If an interpretation of the analysis results is required, the analysis runtime calls the decision engine.
Decision engine
The decision engine is the part of the analytics process which interprets a determined analytics result. It takes digitized engineering knowledge from the knowledge & fault pattern database into account in order to decide either the operation of the instanced components is okay, sub-optimal, faulty, dangerous, etc. Interpretations of the operational quality and recommendations on how to optimize it are based on this decision.
Example
- A heat pump cycles several times per hour.
- This can easily be identified via the KPI number of cycles per hour.
- The decision engine decides at which threshold value this is too frequent is made in the decision engine.
- If the decision is too frequent, recommendation on how to increase the cycle time is queried from the knowledge & fault pattern database by the decision engine.
- The decision and recommendations are returned to the analytics runtime.
Knowledge and fault pattern database
The knowledge & fault pattern database is the gathered engineering knowledge used to interpret analysis results, identify faulty component operation and give recommendations of optimization measures.
Process
The process starts with instancing a component, that means assigning a component data model to a specific project. An instanced component gets project individualized by mapping the component which assigns datapoints and meta data to the instanced component. Configuring an analysis describes the process of choosing analysis functions which shall be run on the instanced component. The last step of the process is exploring the analysis results provided by the framework and trigger optimization measures derived from the provided data insights. In the following, each step is explained in detail.
Instancing a component
Instancing a component describes the process of assigning a generic component data model to a specific project. Colloquially expressed: Choose the components of your building/project from the component data model library.
Mapping a component
Mapping a component is the process which individualizes the generic instanced component data model for a specific project. This comprises linking datapoints, respectively their time series, to the pins of the instanced component and adding meta data tags to it. A mapped component is ready for analysis.
Ingested as well as AI-generated meta data can be used to support the mapping, especially the linking of datapoints and pins.
Configuring an analysis
Configuring an analysis is the process to individualize the analysis which should be run on an instanced component. Choices are:
- Which analysis functions shall be run on the component? This can be a subset of the analysis functions available for the component data model.
- It is possible to define several configurations on the same instanced component and thus create individual analysis sets.
- Advanced settings: analyze multi-time intervals. This option allows to perform analyses over a fixed number of time intervals, a fixed interval length or a combination of both.
The analysis configuration will be passed to the analytics runtime when analysis results of this configuration are queried.
Exploring results
Querying results is easy: Choose a start and end time and an analysis config which shall be executed. The analytics runtime will evaluate the analysis functions of the config and return its results within seconds.
Depending on the utilized analysis functions, the result type differentiates. A set of key performance indicators, restructured or virtually determined time series, qualitative evaluations (traffic light colors), interpretations and recommendations is returned.
Key performance indicators: Known indicators from engineering and thermodynamics in order to get a quick, comparable overview over a component's operation and performance, e.g., the coefficient of performance.
Restructured time series: Restructuring time series helps to focus on a certain aspect of the time series and allows visual analysis of this aspect. E.g., the overall load distribution of a component can easily be analyzed via a load duration graph which is just a restructured power time series.
Virtually determined time series: Some analysis functions determine time series via mathematical correlations. E.g., a fluid heat flux via two temperature sensors, a volume flow sensor, and knowledge of the fluid medium.
Qualitative evaluation: Sometimes green, yellow, red is all what is required to get an overview over the components operation.
Interpretation: This is the interpretation of the analysis results by the decision machine. E.g., "The component is pulsing in extremely high frequency."
Recommendation: This is the recommendation of optimization measures given by the decision engine. E.g., "Reduce component pulsing by throttling the output heat power. Throttling can be realized by partial-load operation of the component or installation of an input power choke."
Take action: The aedifion.analytics framework provides transparency and interpretation of operation of components, recommendations of optimization measures, and prioritization of these measures. The measures are minimally invasive optimizations with high overall impact on the energy systems performance, which can often be carried out by adjustments within building management systems by any technician or engineer.
Learn more? Explore the available analysis functions.