Data
The concept of aedifion.io's data generation.
Overview
The aedifion.io platform is all about collecting, storing, processing, and visualizing data with the goal to optimize the operation of buildings, plants, or even whole districts w.r.t. their primary energy consumption. To this end, aedifion continuously collects fine-grained time series and meta data directly from the building automation technology in the targeted plants, buildings, and districts. This primary, native dataset is complemented by further useful data from third party sources such as weather predictions or room occupancy.
In this article, we first lay out the data model of the aedifion.io platform, then provide an overview of the native and third party data it provides.
Data model
All data on aedifion.io is separated into two categories: time series data and meta data. In the following, we briefly explain how these two types of data are structured.
Time series data
Time series data refers to all data that continuously changes over time. This applies, e.g., to real measurements collected from sensors and actors in the field, but also to stream aggregation functions that generate continuous outputs.
The set of time series data is structured into many single time series, where each time series is related to a single physical or virtual datapoint.
HeadQuarters
  -> Office01_RoomTemperature
  -> Office01_CO2
  -> Office02_RoomTemperature
  -> ...
  -> Office10_RoomTemperature
  -> Office10_CO2
  -> Offices_RoomTemperature_average
  -> Offices_CO2_average
In the above example, we have the time series data set for the building HeadQuarters, that consists of 22 individual time series. The first twenty of those, Office01_RoomTemperature to Office10_CO2 correspond to physical sensors while the last two, Offices_RoomTemperature_average and Offices_CO2_average, correspond to virtual datapoints that are generated by computing the average over the other sensors.
A single time series has a name and a list of observations, i.e., (time, value) tuples, with an optional set of tags per observation.
Time series example
Name: Office10_RoomTemperature
Time                 | Value | Tags
---------------------+-------------------------
2019-02-06T12:00:00Z |  20.1 |
2019-02-06T12:01:30Z |  20.3 |
2019-02-06T12:03:00Z |  20.2 |
2019-02-06T12:04:30Z |  20.5 | maintenance=True
2019-02-06T12:06:00Z |  20.8 | maintenance=True
2019-02-06T12:07:30Z |  21.1 | maintenance=True
...
2019-02-06T23:30:00Z |   0.0 | outOfService=True
2019-02-06T23:30:00Z |   0.0 | outOfService=True
In the above example, the sensor Office10_RoomTemperature is read every 1.5 minutes. The time-dependent tags mark a maintenance period and when the sensor reported an error.
Meta data
Meta data refers to all data that remains largely unchanged over time such as units and descriptions of datapoints, but also user-generated meta-data such as favorites, renamings, or custom plot views.
Most meta data is stored within tags that can then be freely assigned to projects, devices, or datapoints. The main ingredients of a single tag are a short (string) key and an arbitrarily long (string) value. A tag can be as short and simple as 'unit'='°C' or as long and complex as a JSON-encoded configuration of a custom plot view, e.g.,
'plotView':
  '{
    "chart":{
      "type":"line",
      "datapoints":[
        {
          "plotPosition":"0",
          "dataPointID":"bacnet100-4120-CO2",
          "project_id":"4",
          "interpolation":"zero-order-hold",
          "marker":"",
          "dashstyle":"solid"
        },
        {
          "plotPosition":"1",
          "dataPointID":"bacnet100-4120-Humidity-HUM",
          "project_id":"4",
          "interpolation":"zero-order-hold",
          "marker":"",
          "dashstyle":"solid"

        },
        {
          "plotPosition":"2",
          "dataPointID":"bacnet100-4120-Window-Closed-WIN",
          "project_id":"4",
          "interpolation":"zero-order-hold",
          "marker":"",
          "dashstyle":"solid"
        },
        {
          "plotPosition":"3",
          "dataPointID":"bacnet100-4120-Ambient-air-temperature-T_Amb",
          "project_id":"4",
          "interpolation":"zero-order-hold",
          "marker":"",
          "dashstyle":"solid"
        }
      ]
    }
  }'
Tags allow filtering through projects, devices, and datapoints using a range of high-level criteria, e.g., "show me all CO2 sensors", or "filter out every datapoint that has a fault". And, tags can be used to specify access control policies, e.g., "user A gets access to all datapoints that correspond to temperature sensors".
Native data
Native data refers to all time series and meta data that is directly collected or generated by aedifion and does not come from third party sources.
Data from building automation
Most of the native data is collected automatically from your building automation network by the aedifion Edge Device. This includes time series data for all discovered datapoints as well as meta data for all discovered devices and datapoints.
Time series
A typical non-residential building has between 1000 and 15 000 datapoints that can be automatically discovered and logged by the aedifion Edge Device. This typically includes, among many others, the following types of data:
- Room temperatures
- CO2 concentrations
- Setpoints and schedules
- Alarm states
- ...
Want to see in detail which datapoints are discovered? The following is a complete list of datapoints that the aedifion Edge Device has discovered in the main building of the E.ON ERC.
Download: Datapoints in E.ON ERC
Meta data
Most building automation networks such as BACnet provide a set of meta data that can be automatically collected. This meta data is logged daily and ingested into the aedifion.io platform where it is stored as tags on devices and datapoints.
The following example shows the set of meta data tags that have been automatically collected from a real BACnet datapoint. As we can see, this already contains a lot of useful information, such as min and max values, units, and error flags.
Tags of a real datapoint
Key               | Value
------------------+--------------------------------------
bacnet_id         | 514
description       | 'Ventil Kühler Besprechung-3'
deviceType        | 'AO OUT9'
minPresValue      | 0.0
maxPresValue      | 100.0
objinstance       | 3000563
objtype           | 'analogOutput'
outOfService      | 'False'
priorityArray     | ['null', 'null', ..., 'null', 100.0]
reliability       | 'noFaultDetected'
resolution        | 1.0
relinquishDefault | 0.0
statusFlags       | [0, 0, 0, 0]
units             | 'percent'
Virtual datapoints
A virtual datapoint is a datapoint not gathered from the local building but from the aedifion cloud. It usually is the result of a calculation or transformation of existing physical datapoints from the building, such as the efficiency ratio of a heat pump.
The virtual datapoint makes the output continuously available in the form of a new datapoint in aedifion.io's time series database.
The time series based on the virtual datapoint's result are handled exactly the same as time series data. Virtual datapoints are denoted as such in their datapoint key according to customers conventions.
AI-generated meta data
The aedifion.io platform uses state-of-the-art machine learning and AI techniques to augment the already provided data. From the already given observations and metadata collected from the Edge Devices, it regularly predicts additional tags (e.g. the type of the data point) and provides them via the API or the frontend. The AI system is able to learn and is therefore expanded perpetually to further improve the quality of the annotations.
The latest classifier we provide, is able to classify the data into five sets of classes:
L1_analog_digitalL2_virtualL3_directionL4_typeL5_unit.
All sets of classes are ordered in a tree-like structure separated by slashes (like a directory structure or paths on a website). For example within L4_type /position/damper position is closely related to /position/valve position and not related to /temperature/liquid/hot/return flow. A full list of each class is shown below.
L1_analog_digital:
/analog/digital/multi-state
L2_virtual:
/physical/virtual
L3_direction:
/input/output
L4_type:
/counter/electric/current/electric/frequency/electric/power factor/electric/resistor/electric/voltage/energy/chill energy/energy/electrical energy/energy/heat energy/gas concentration/CO2/gas concentration/VOC/global radiation/illumination intensity/message/alarm/message/available/message/modus/message/operating/message/presence/message/switch command/misc /operating time/parameter/parameter/parameter/setpoint/position/damper position/position/misc/position/valve position/power/electric/power/thermal/pressure/gaseous/absolute/pressure/gaseous/differential/pressure/liquid/absolute/pressure/liquid/differential/relative humidity /rotational speed/temperature/difference/temperature/gaseous/exhaust/temperature/gaseous/extract/temperature/gaseous/indoor/temperature/gaseous/misc/temperature/gaseous/outdoor/temperature/gaseous/recirculation/temperature/gaseous/supply/temperature/liquid/cold/input flow/temperature/liquid/cold/return flow/temperature/liquid/cold/storage tank/temperature/liquid/hot/input flow/temperature/liquid/hot/return flow/temperature/liquid/hot/storage tank/temperature/liquid/warm/input flow/temperature/liquid/warm/return flow/temperature/liquid/warm/storage tank/volume flow/gaseous/volume flow/liquid/wind speed
L5_unit:
/electric/Ampere/electric/Ohm/electric/Volt/energy/Joule/energy/KiloBTU/energy/KiloWattHours/energy/TonHours/energy/WattHours/frequency/Hertz/frequency/rpm/light/Candela/light/Lumen/light/Lux/power/KiloBTUsPerHour/power/Kilowatt/power/TonsRefrigeration/power/Watt/pressure/Pascal/pressure/bar/scalar/degrees/scalar/generic/scalar/percent/scalar/ppm/scalar/radiant/speed/kmPerHour/speed/meterPerSecond/temperature/Celsius/temperature/Fahrenheit/temperature/Kelvin/time/hours/time/minutes/time/seconds/volume flow/cubicMetersPerHour/volume flow/gallonsPerMinute/volume flow/litersPerMinute/volume flow/litersPerSecond
Each time the classifier runs, a tag for the datapoint is created, which looks as follows:
AI generated meta data tag
{
  "id": 92807,
  "key": "L4_type",
  "probability": 0.857322,
  "protected": true,
  "source": "ai",
  "value": "/gas concentration/CO2"
}
The key of the tag is one of the class sets e.g. "L4_type". The value of this tag is /gas concentration/CO2, which indicates that the analyzed datapoint is recognized as a CO2 sensor. A complete list of all the possible values and their meanings can be found within the engineers' specification section. With just those properties you can easily filter the set of datapoints.
The tag has "ai" as a source, since it is originating from an AI-based classifier. Each classifier also provides the property probability. In this example the classifier has a confidence of 85.73% that the given classification is correct.
For more information on the classification process refer to the section on artificial intelligence based meta data generation.
Third party data
Microsoft Exchange
On request, data from Microsoft Exchange can be integrated into the aedifion.io platform. This currently includes only the booking status of rooms that are available as a resource in Microsoft Exchange. Booking status is made available for the past and future as a boolean time series on aedifion.io.
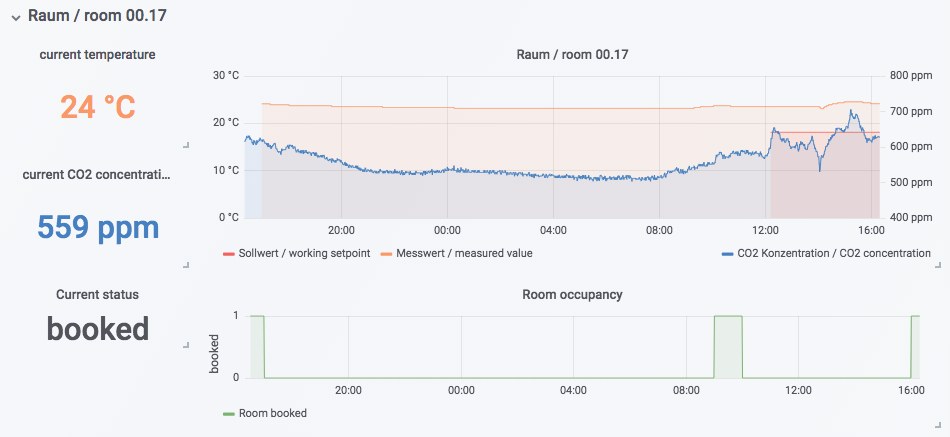
Figure 1: Visualization of the temperature, CO2 concentration and booking status of a meeting room
Weather data
aedifion.io uses weather data services for weather data integration. Therefore, both current and predicted weather conditions localized by geocoordinates are available on aedifion.io.
Learn more? Explore the weather data specifications.