Datapoints
This section offers a short overview of the functionalities available in the Datapoints.
Data exploration and data management
The frontend visualizes historical data and real time data using line plots. If you have set a units system or currency system in your profile the observations are converted into the selected system (if possible). For a better overview, the displayed timeseries are listed in a legend below the diagram. The list includes further information such as the displayed unit of the timeseries, further tags, and additional actions. Possible actions are deselecting the datapoint, hiding the datapoint in the diagram and further editing options.
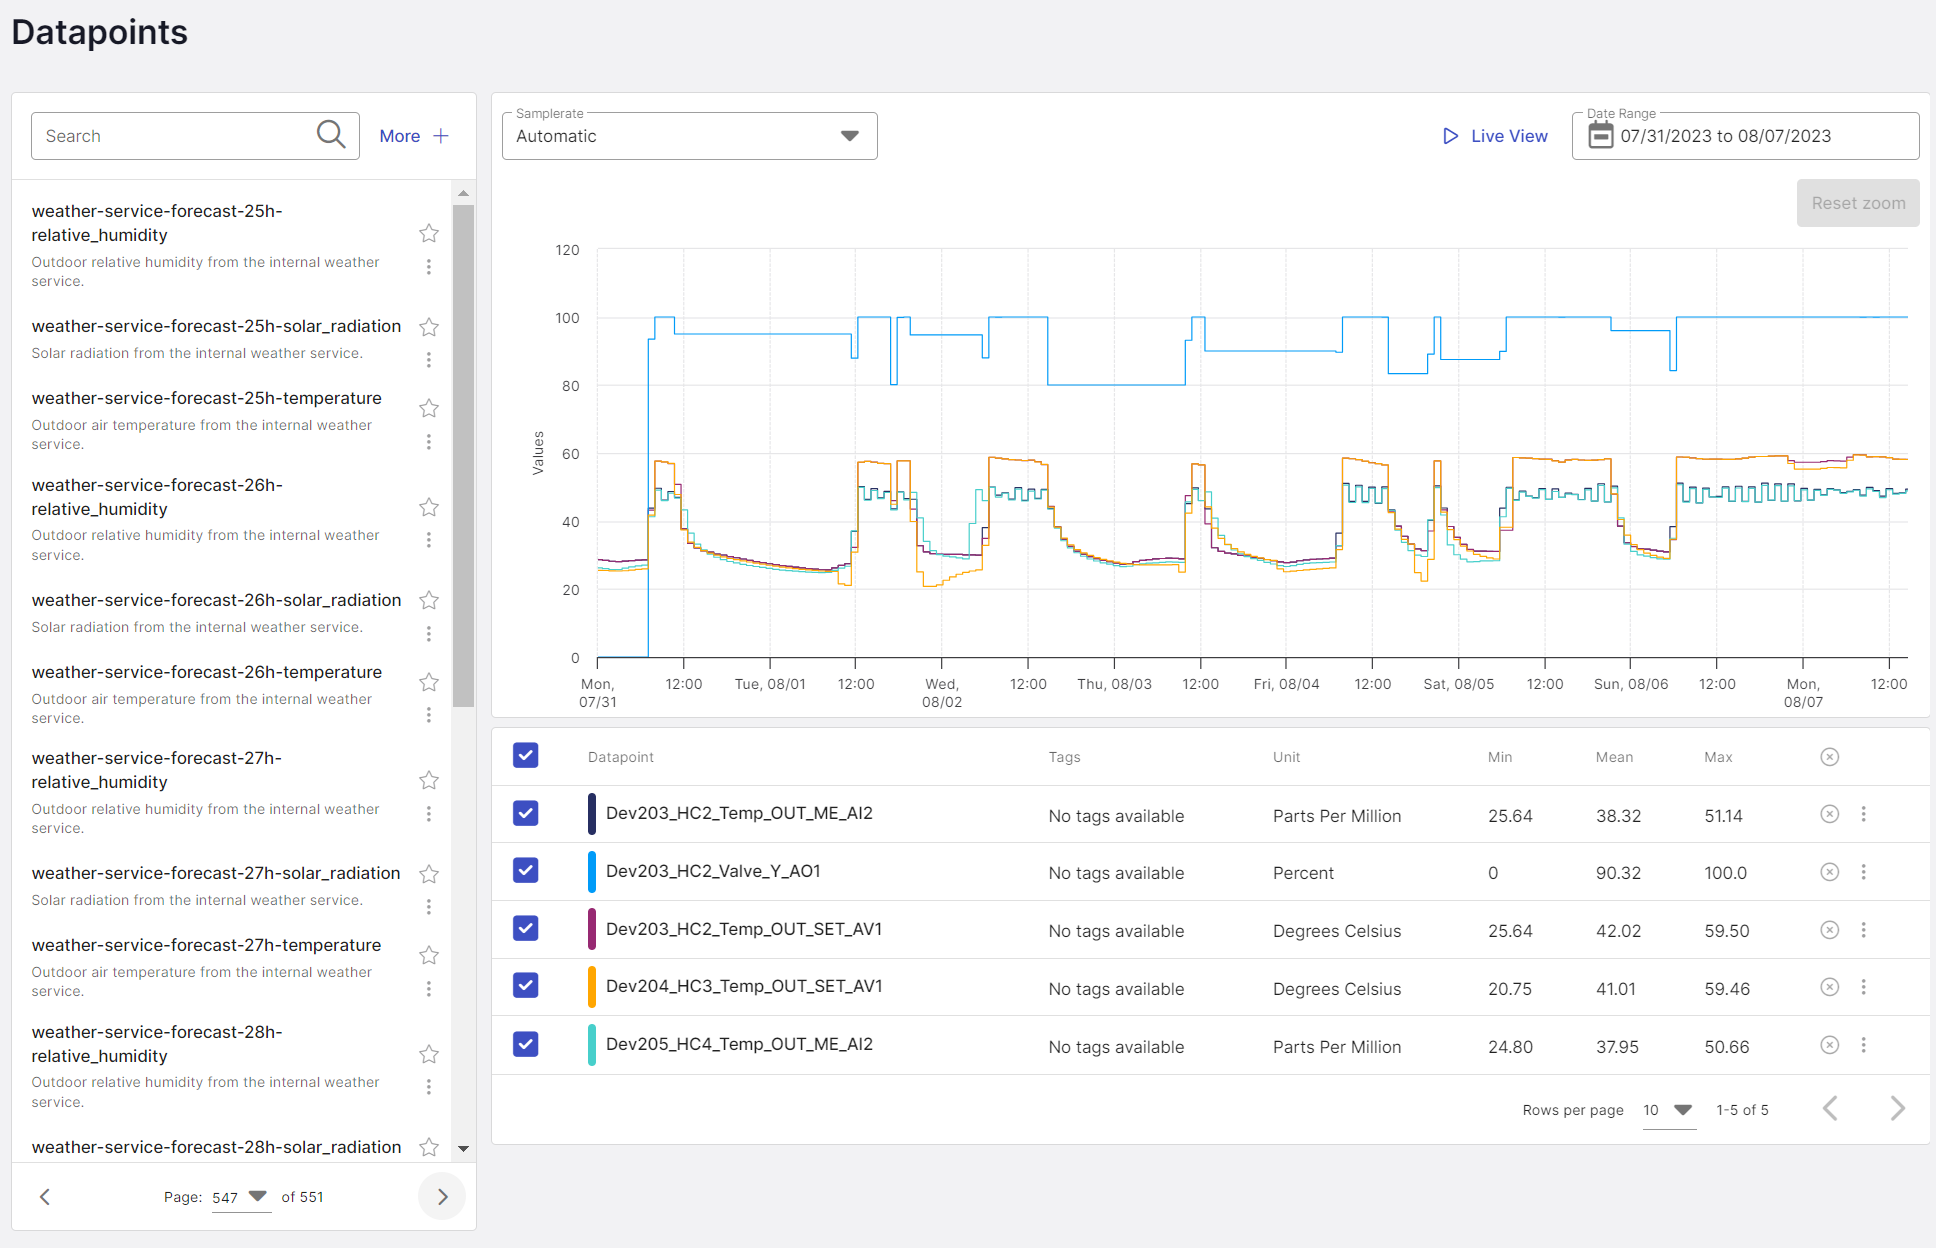
Figure 1: Line plotting of several datapoints, legend of datapoints below
Binary values are plotted as a range plot above the line plot. Here, a visible area means a value of 1.

Tagging and filtering functionality
Beside a plain text datapoint search, filtering datapoints via user-favorites, writability, and tags is provided. AI-classification tags, user-added tags and automation system protocol-tags are used.
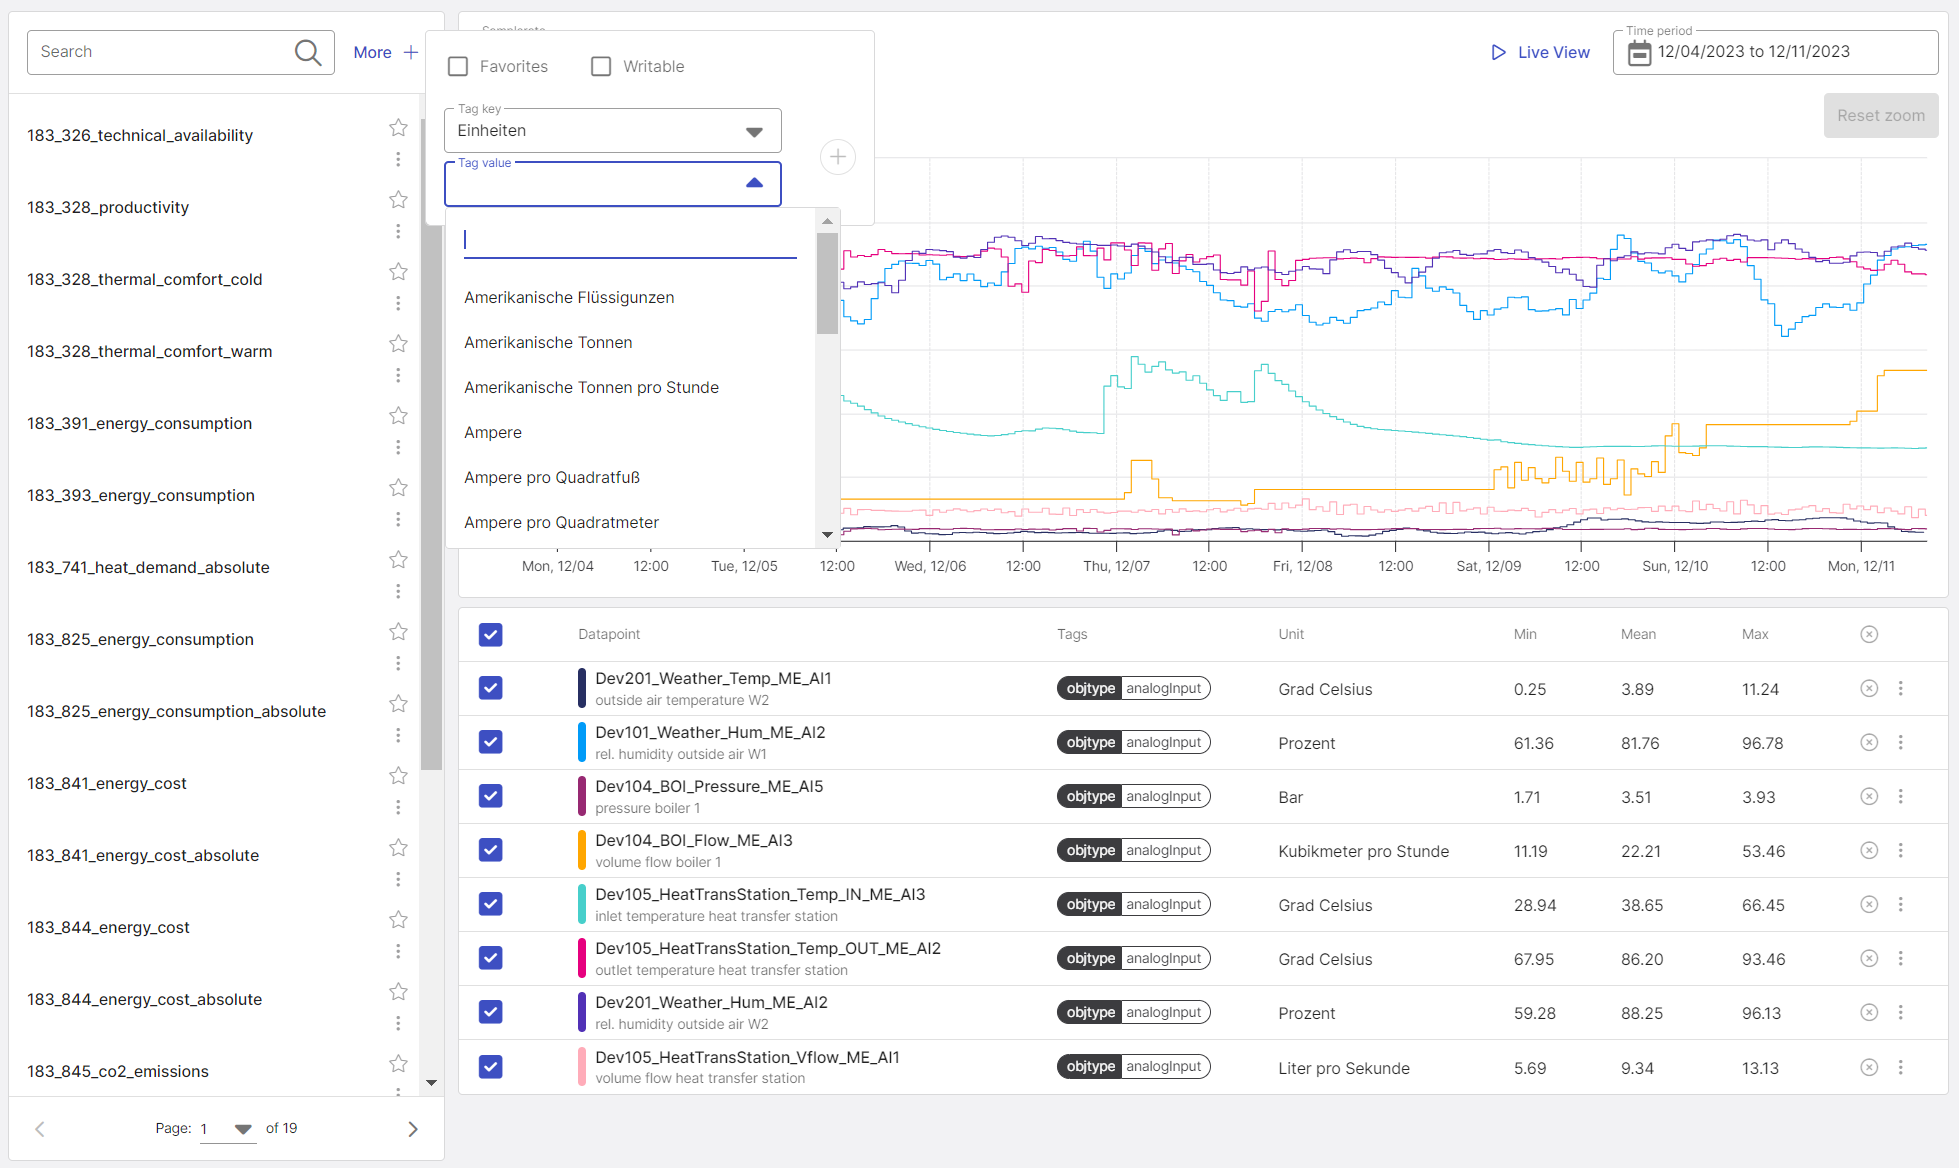
Figure 3: Datapoint list filtered by user-favorites, adding filter for tag *units*:*degreeCelsius*
Access the tags of each datapoint and add user-generated ones by the menu-symbol next to the datapoint's name.
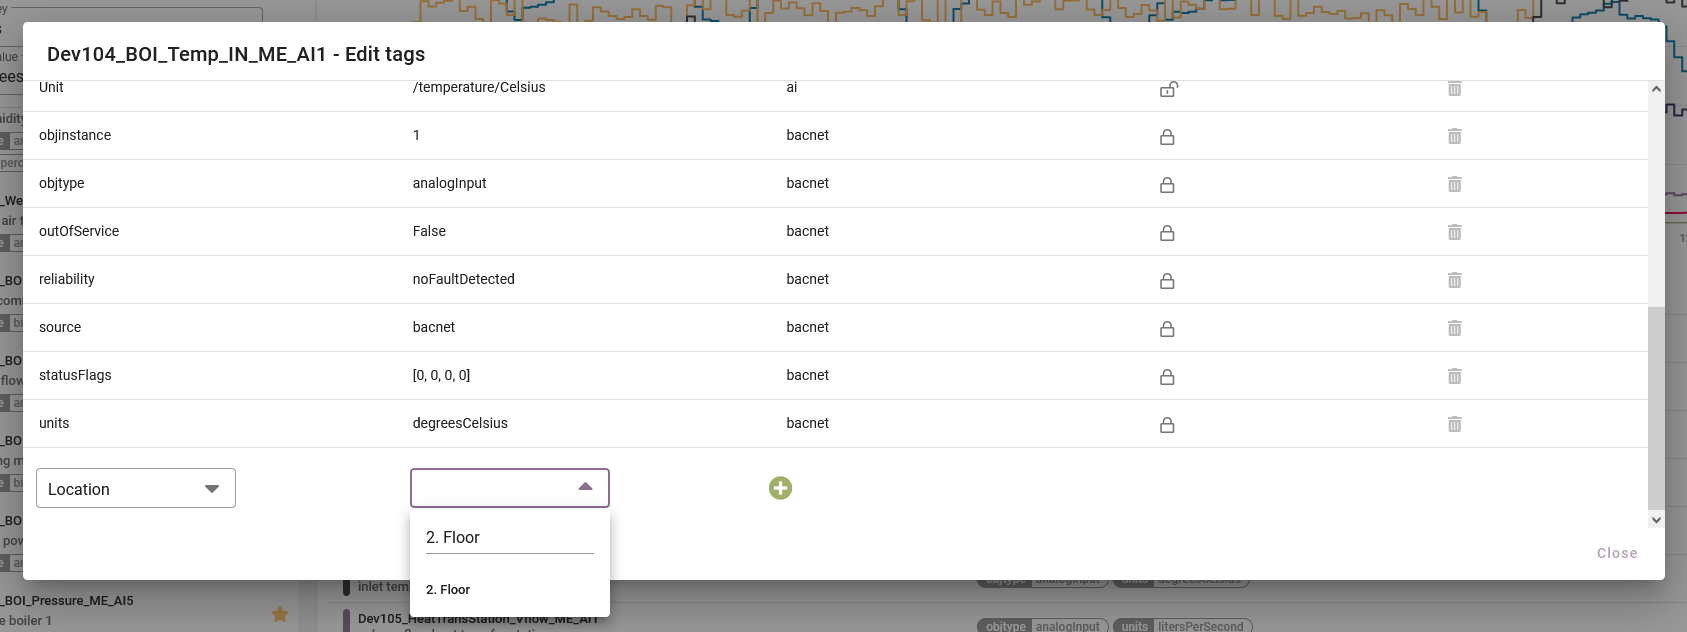
Figure 4: Adding the user-generated tag *location*:*2nd floor* to a datapoint
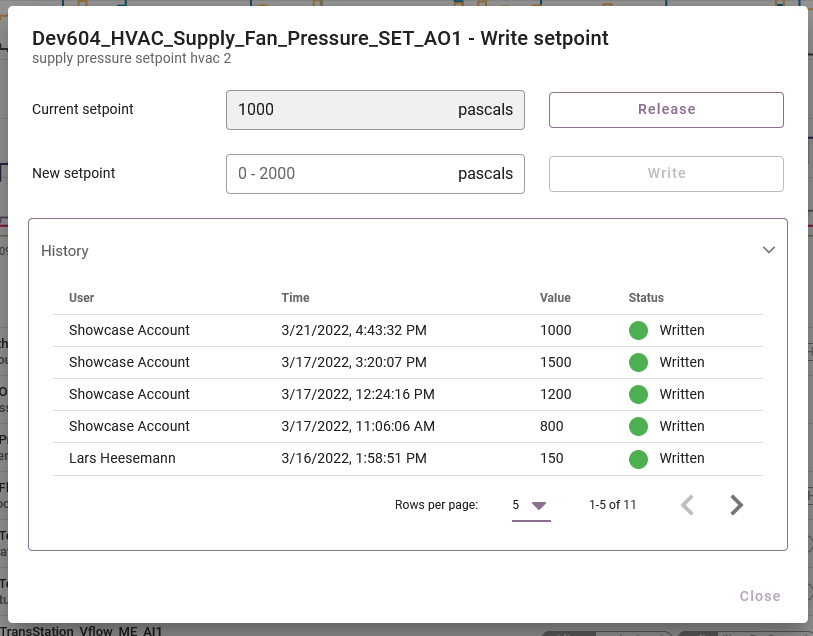
Setpoint writing
Write setpoints to the automation system via the platform within pre-defined limits and priority. View the history of all written setpoints.