Reporting
This page provides an overview of the Reporting page.
Overview
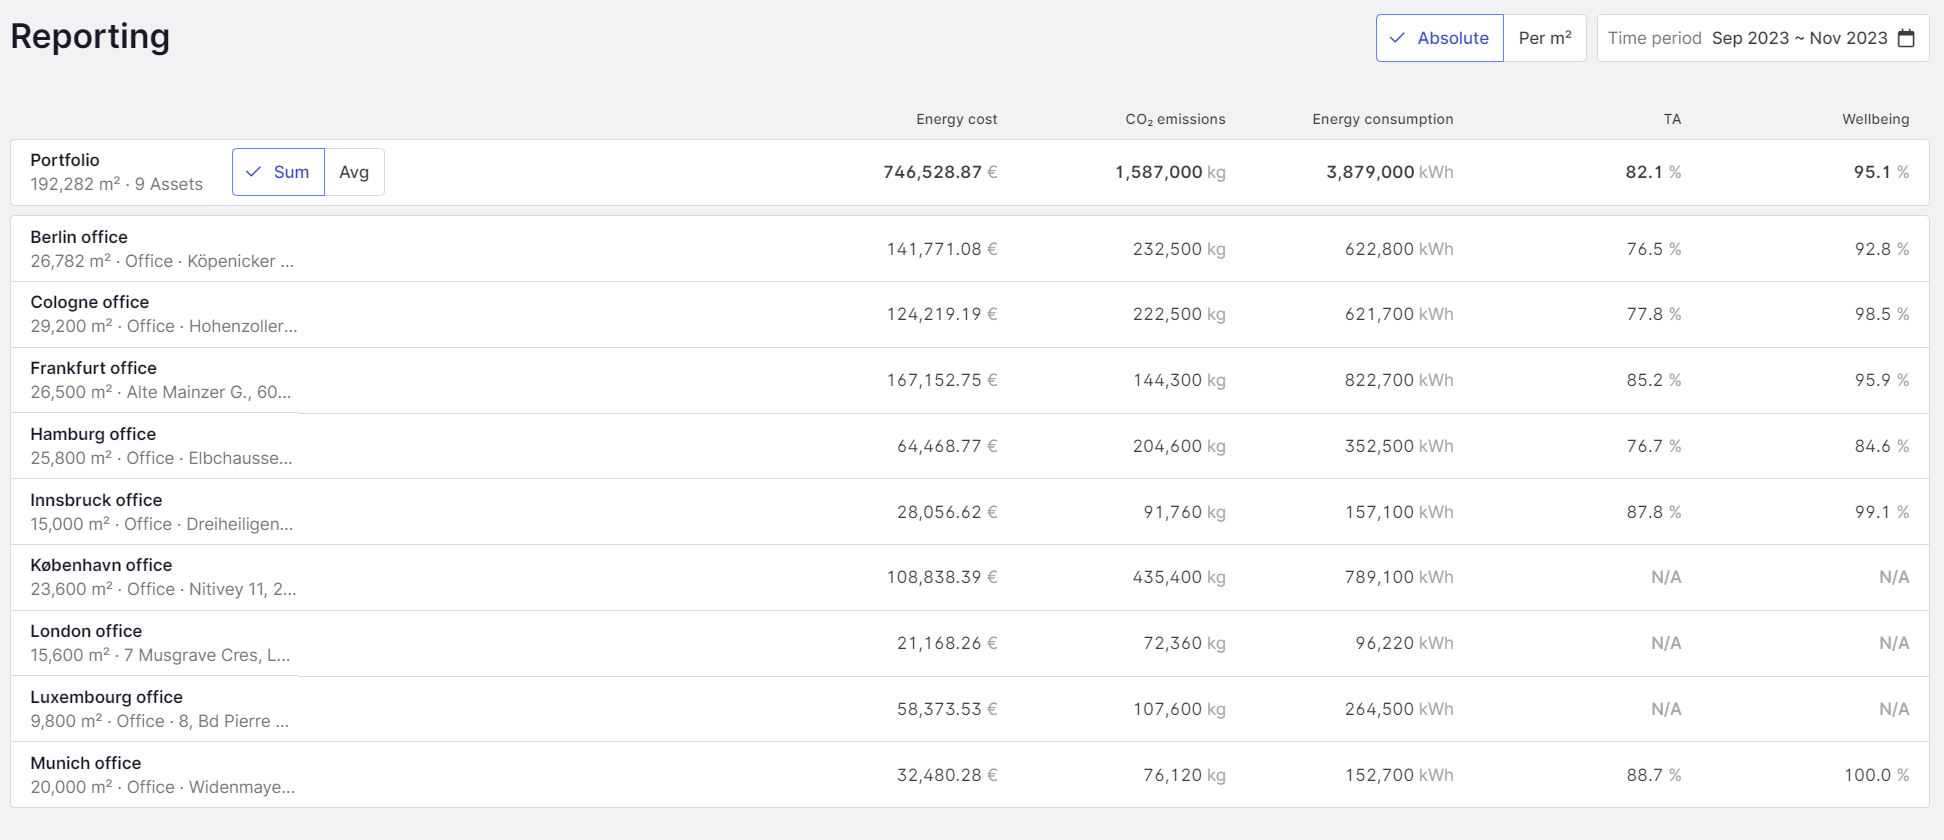
At portfolio level, the reporting page provides a quick overview of the following KPIs:
- Energy cost
- CO2 emissions
- Energy consumption
- TA (Technical Availability)
- Wellbeing
The time period for calculating the KPIs can be adjusted using the time selection in the top right-hand corner. You can also switch between the KPIs normalized to the building area and the absolute values.
Figure 1 shows the reporting page in the display normalized to the building area. The average of the individual buildings is shown in the header. Below this, the calculated KPIs for the individual buildings are listed.
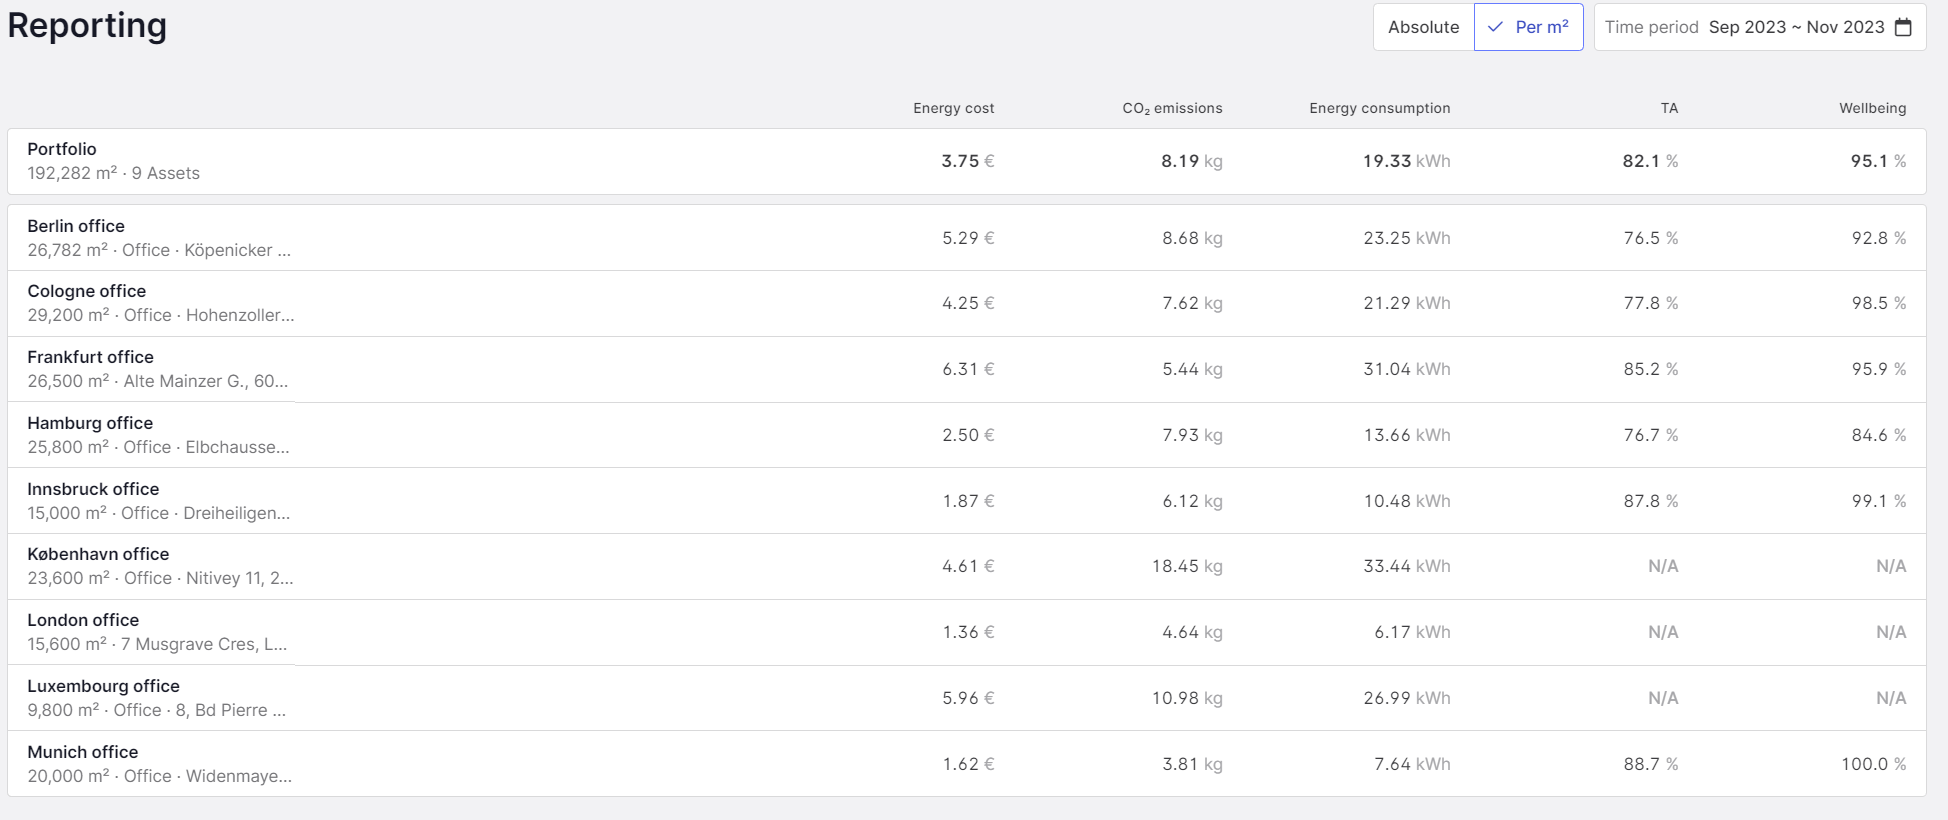
Figure 1: Reporting page with display per square meter
Figure 2 shows the reporting page in the absolute KPI display. The absolute values of the KPIs are displayed here for each building. Depending on the settings, the total values across the portfolio ("Sum") or the average values across the portfolio ("Avg") can be displayed in the header row.