View datapoints
The Datapoints page visualizes historical data of datapoints in time series representation (also known as trend visualization). Multiple datapoints can be displayed at the same time.
Search and filter datapoints
Using the search box, you can find datapoints by name. The "Favorites" and "Writable" checkboxes can be used to quickly narrow down the list of results.
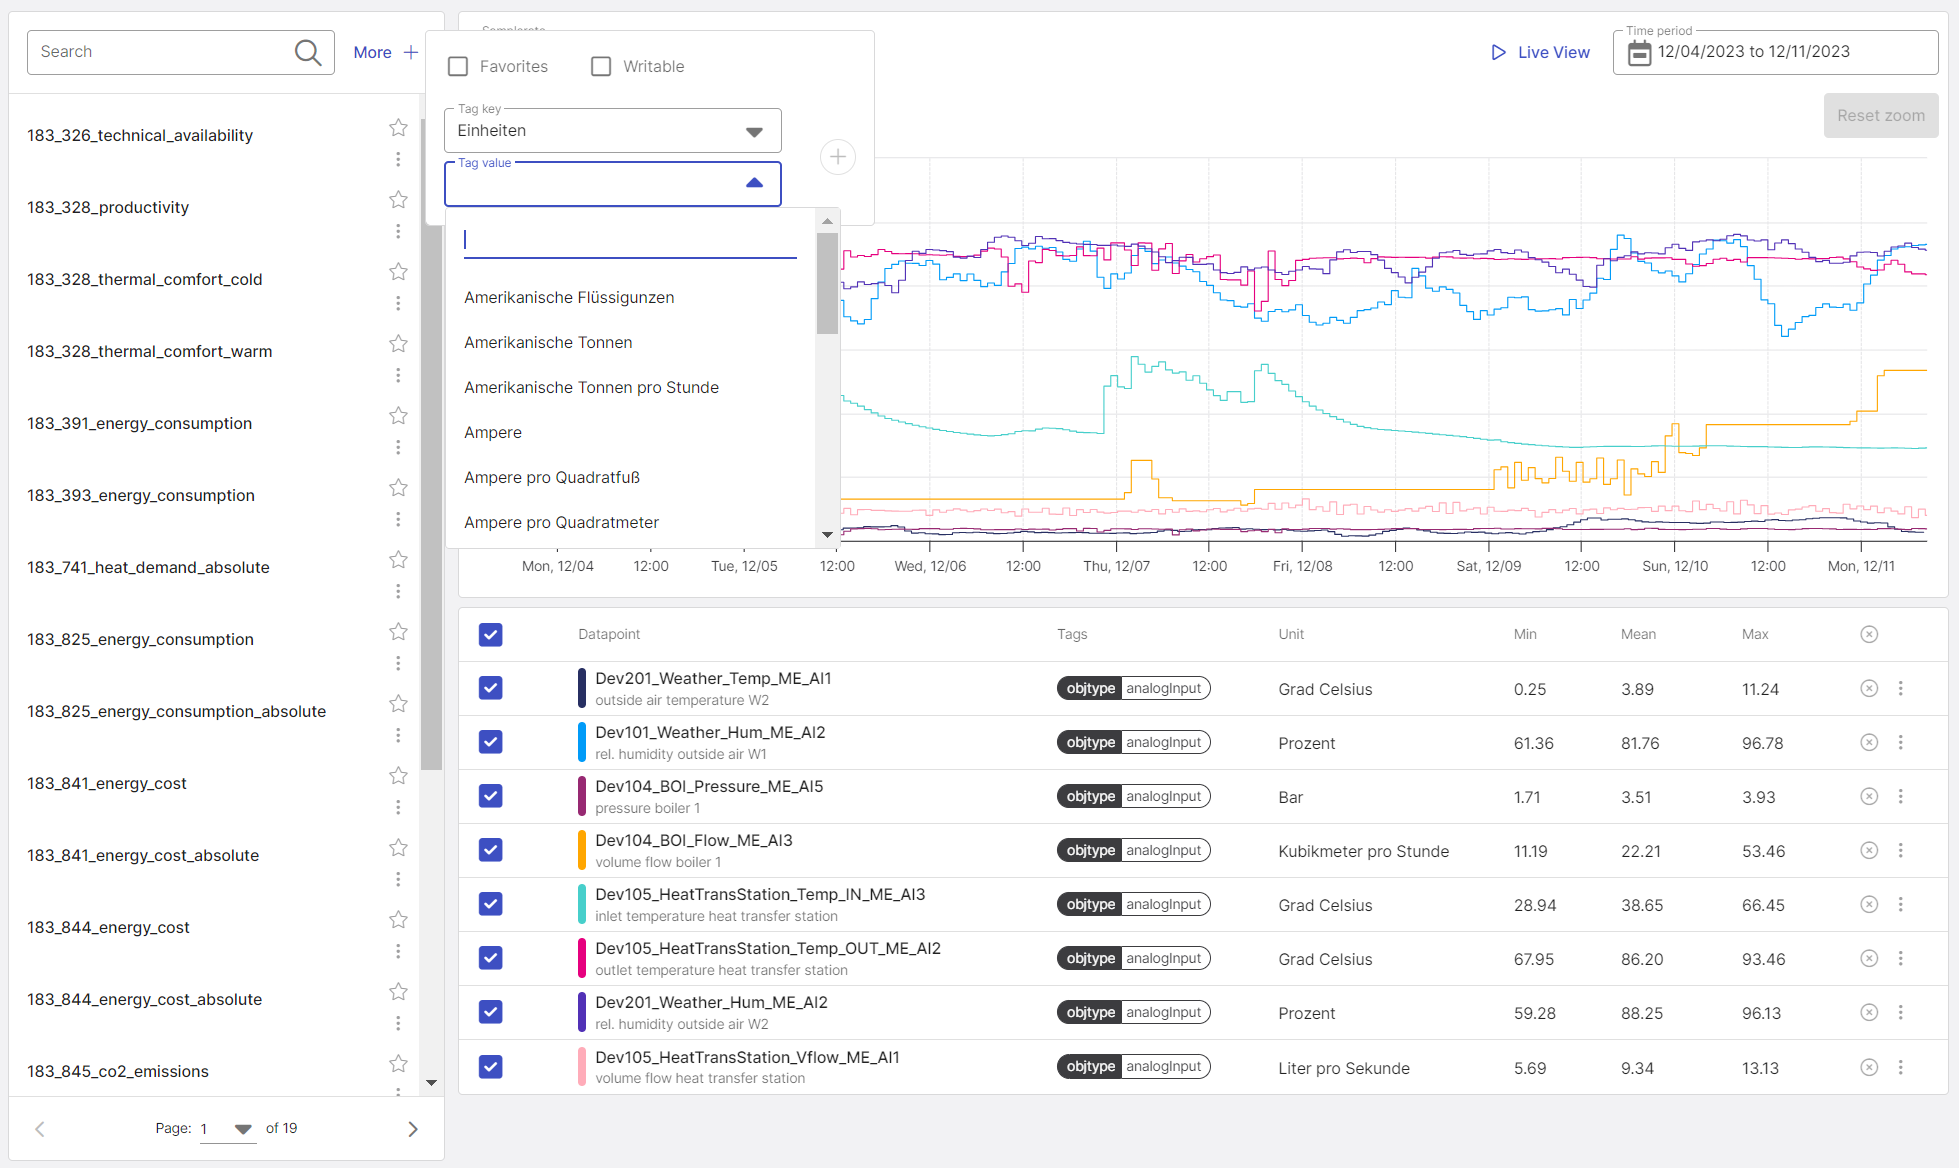
Figure 1: Setting filters
To use additional filters:
- Click on "Tag key" and select a key
- Click on "Tag value" and select a value
- Click on "+"
In the list, datapoints can be marked directly as favorites.
View datapoints
From the list of datapoints, multiple datapoints can be selected by clicking on them, which adds them to the lineplot. For a better overview, the displayed timeseries are listed in a legend below the diagram. The list includes further information such as the displayed unit of the timeseries, further tags, and additional actions.
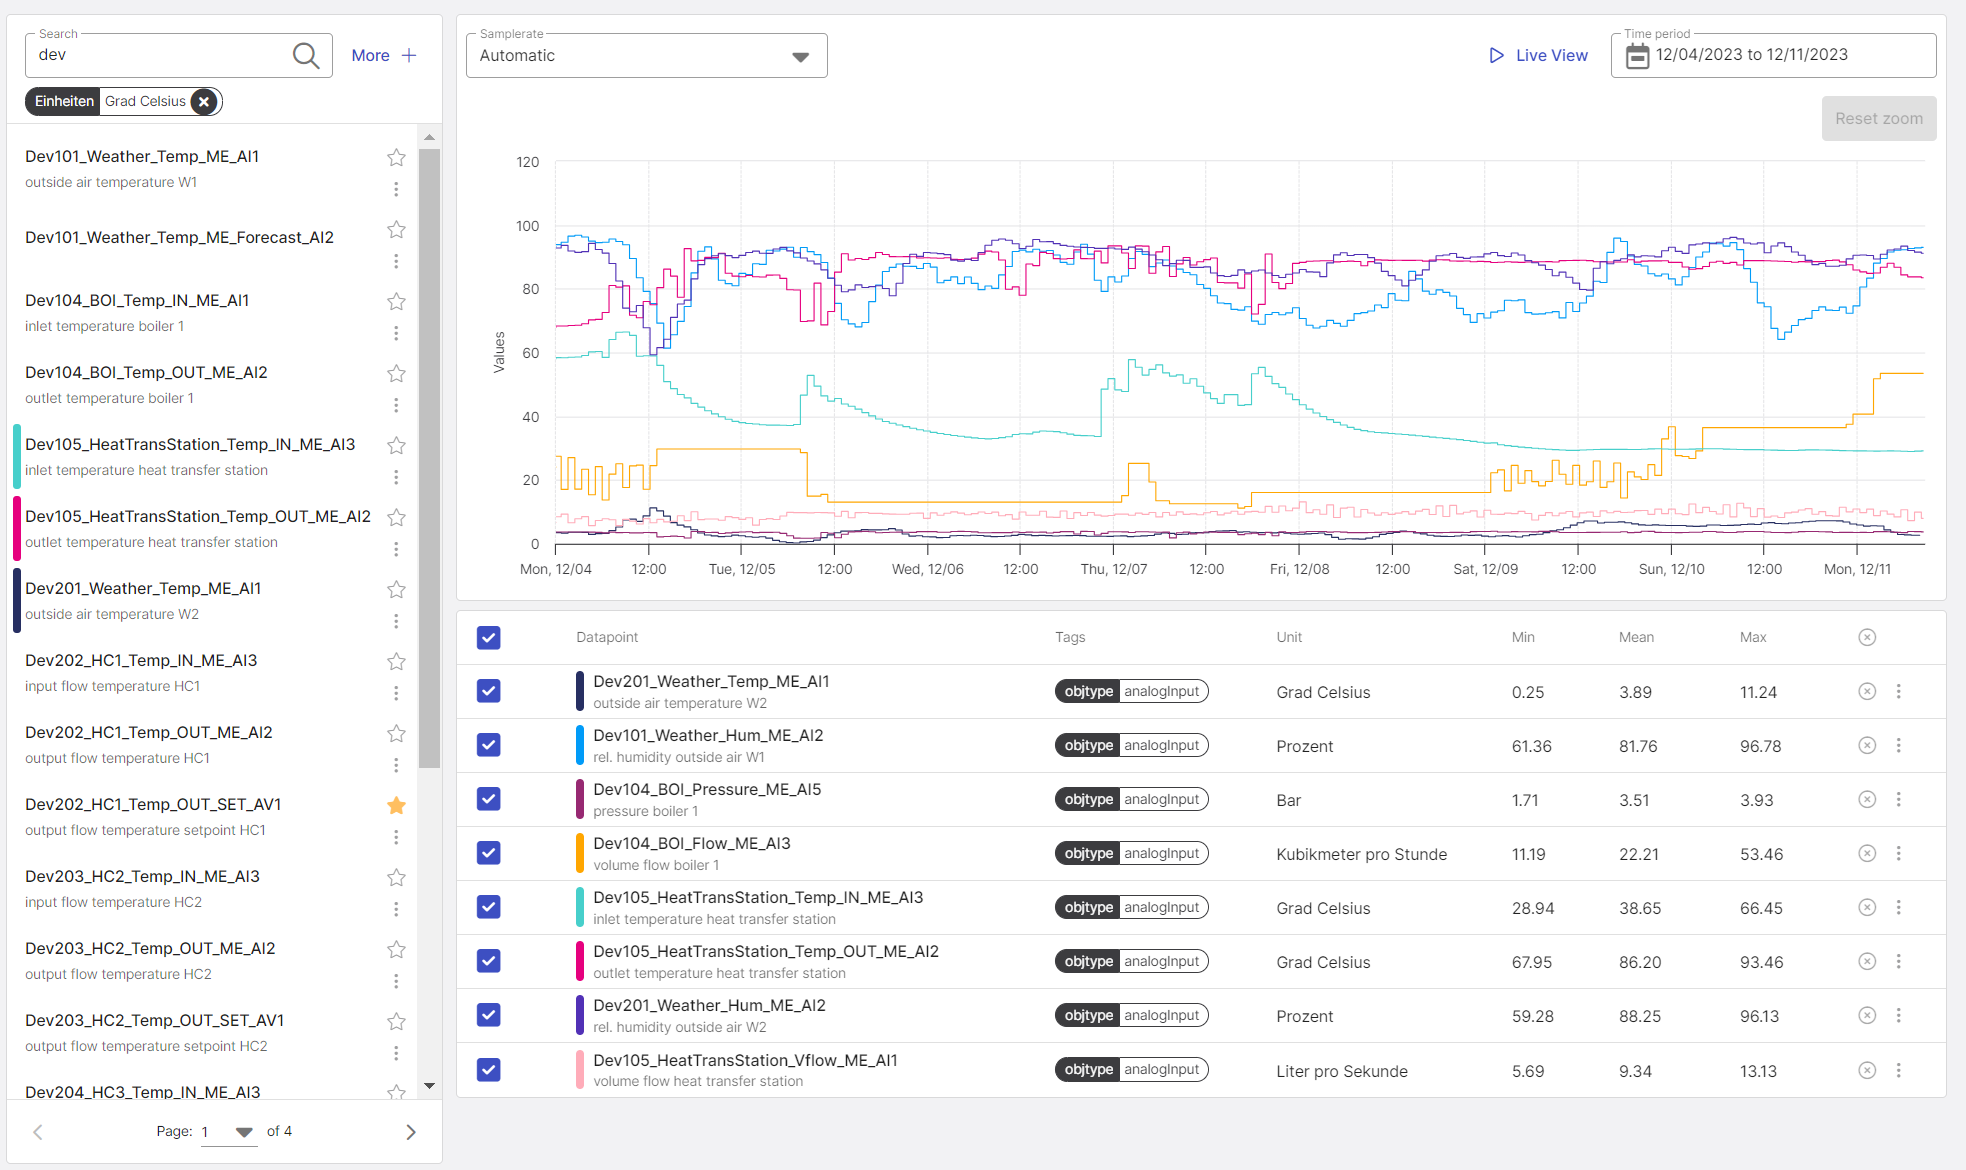
Figure 2: Trend visualization with datapoint list and set filter
The following functions are available on the Datapoints page:
Period
When selecting a datapoint, the values of the last 7 days are always displayed. By clicking on the existing time period, you can select a new time period as you like. To do this, always select the start date first and then the end date and click on "ok".
Live View
With clicking on "Live View" the last 15 minutes are displayed and currently value of the selected datapoints are added live.
Exact Value
If you point with the mouse pointer to a point in the data series, the exact value and time will be displayed.
Detailed view of several values
Draw a frame around the time range you want to examine more closely by holding down the left mouse button. As soon as you release the mouse button, only the framed time range is displayed (zooming). To leave this view, click on the "Reset Zoom" button that has now appeared.
Hide datapoints
If you click on the checkbox, the corresponding datapoint will be hidden.
Deselect datapoints
By clicking on the "X", the corresponding datapoint is deselected and must be selected again in the list if required.
Sort datapoints
The data points in all columns can be sorted by clicking in the header row of the table.
Edit datapoints
By clicking on the three menu items, the datapoint can be edited. This way tags can be edited as well.
Binary values are plotted as a range plot above the line plot. Here, a visible area means a value of 1.

Figure 3: Line plotting of several datapoints and binary value plotted above, legend of datapoints below
Changing the unit used
The currency used and the units displayed can be customized using the profile overview. A guide on how to select the currency and the unit system is given in the user profile section. Selecting the unit changes the display of the timeseries, as the observations stored in the timeseries are now converted to the target system. For example, the timeseries of a temperature can be converted between the metric system and the international SI system of units. Figure 4 shows the time series of the outdoor temperature in the unit degrees Celsius (metric system).
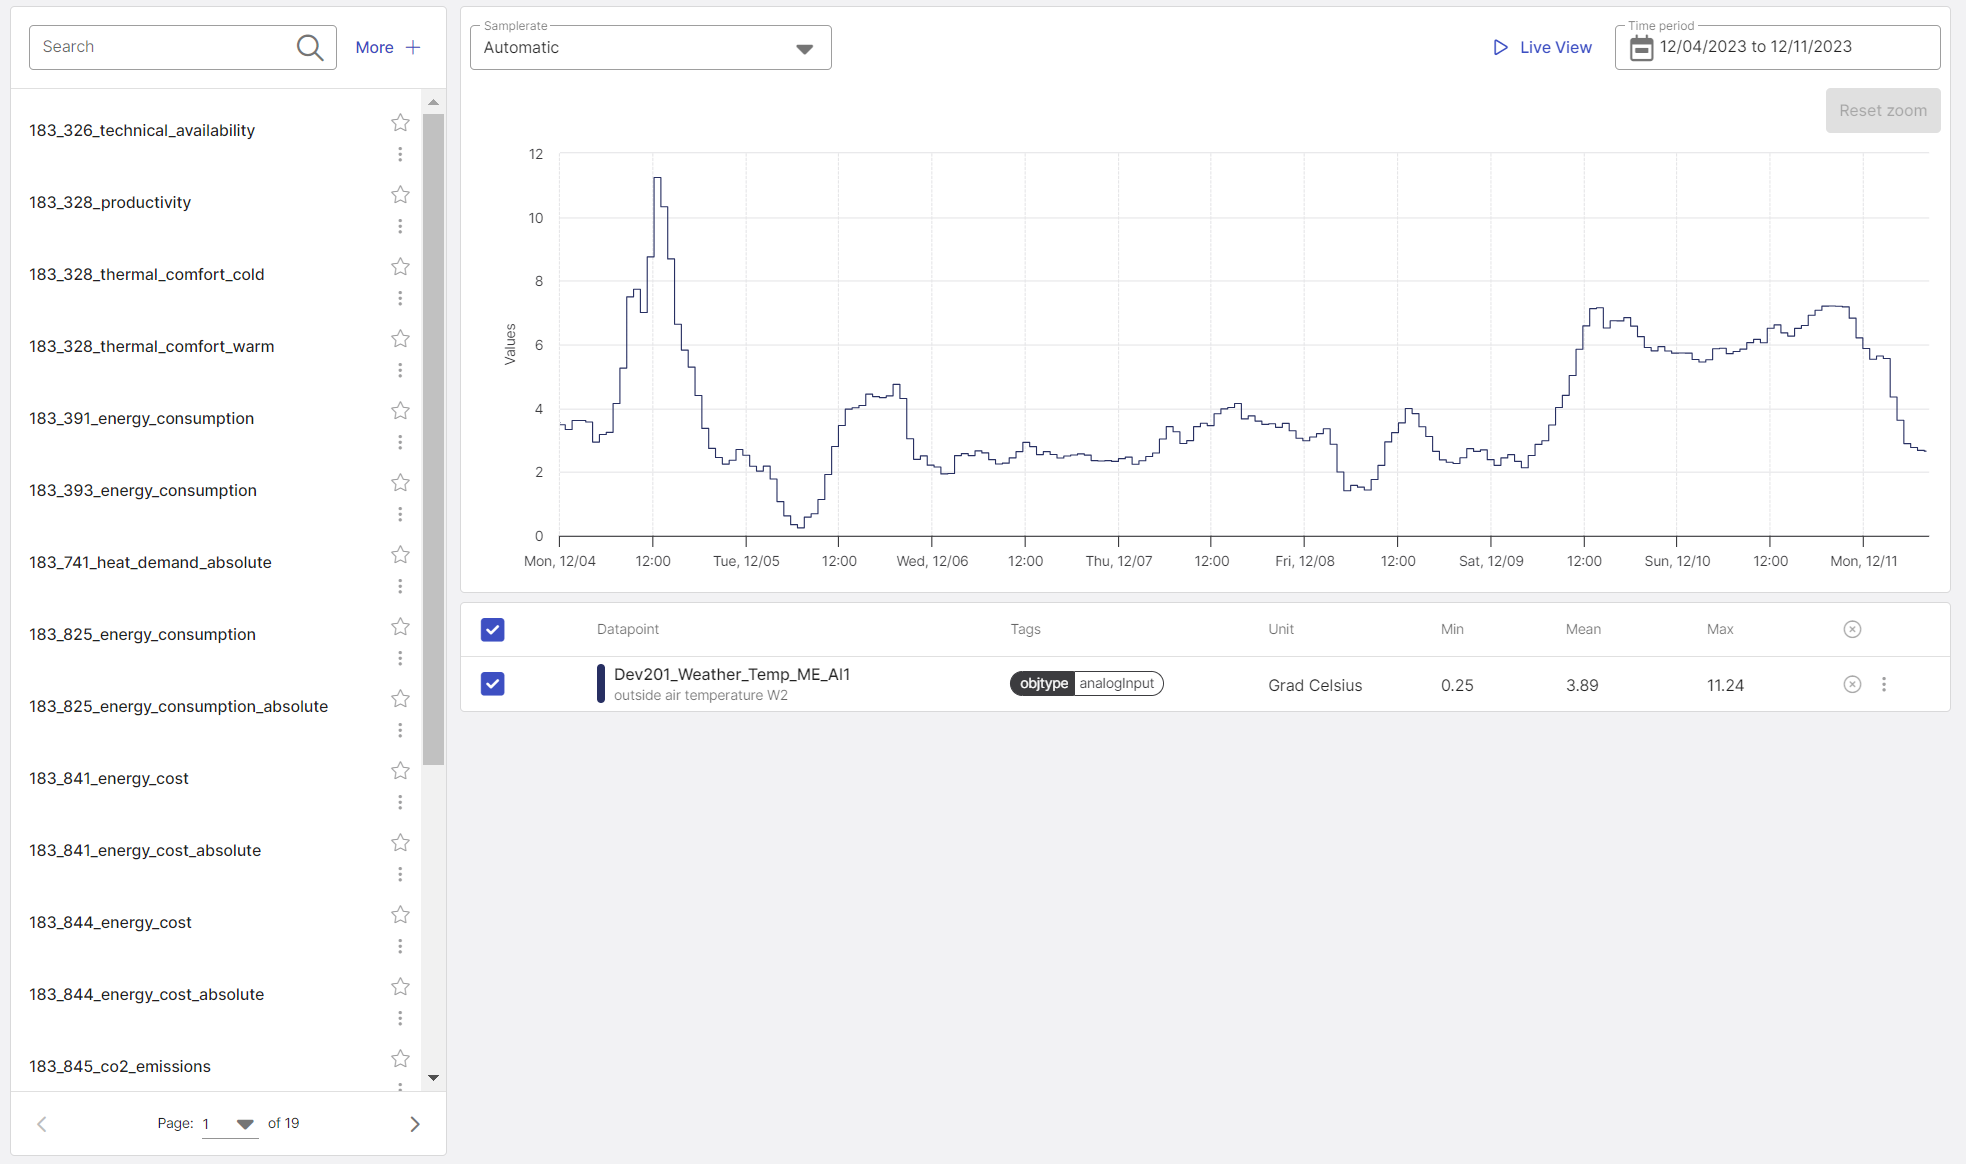
Figure 4: Timeseries of an outdoor temperature displayed using the Metric System
By changing the selected system of units to the SI system, the outdoor temperature is converted from degrees Celsius to Kelvin. This changes the values displayed.