Energy & CO2
This page provides an overview of the Energy & CO2 page.
Overview
The Energy & CO2 page enables the benchmarking of buildings against other of your own buildings on the aedifion platform. There the buildings are plotted in terms of energy consumption and CO2 emissions. This makes it possible to quickly identify whether or not a building is one of the most energy- or CO2-intensive buildings in the portfolio. The performance of the buildings is also rated on a color scale. Further information on energy consumption and CO2 emissions is displayed by hovering over the building card.
The data taken into account relate to the last 12 months. This means that all meter values for the last 12 months must be entered for accurate benchmarking.
In addition, the annual average of CO2 intensity and energy intensity is also shown above the plotting.
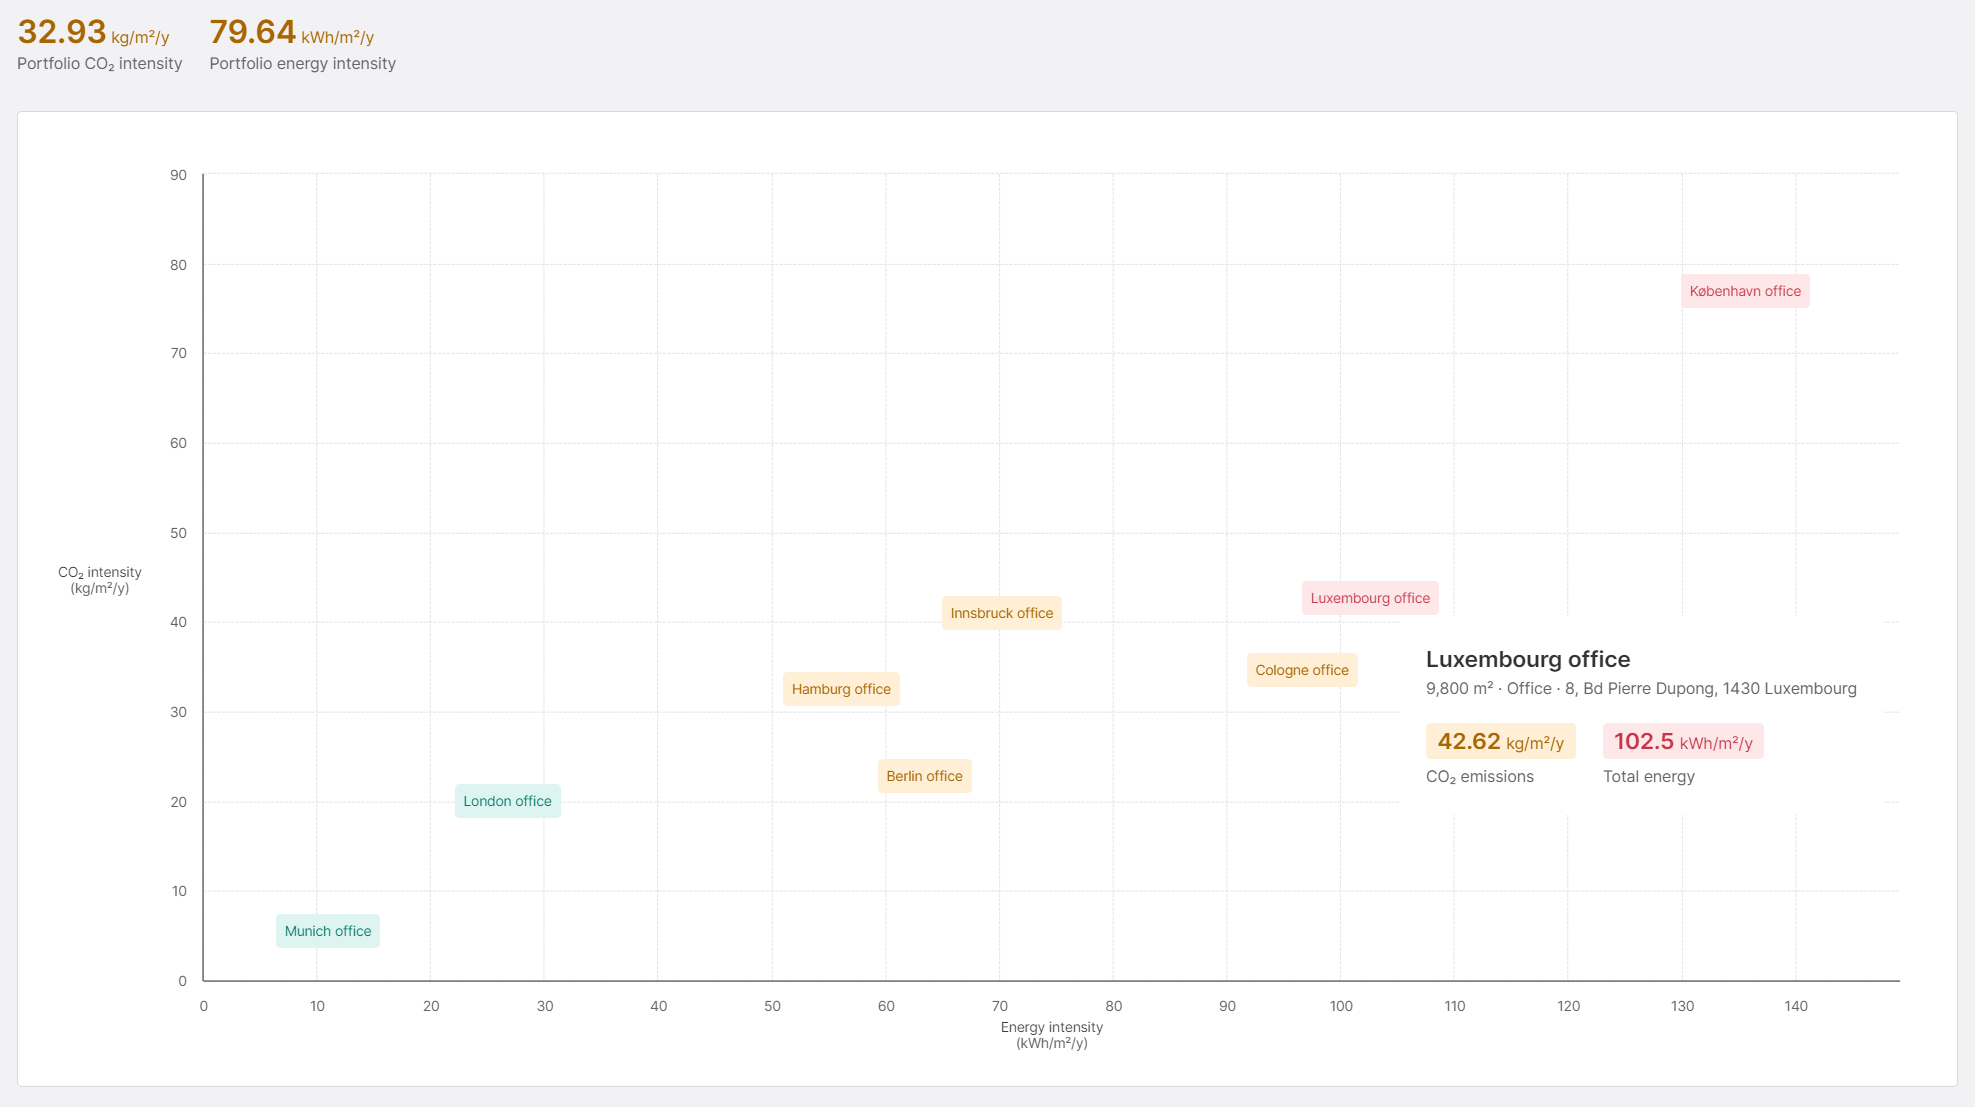
Figure 1: Energy and CO2 benchmarking within your own portfolio