Timeseries of datapoints
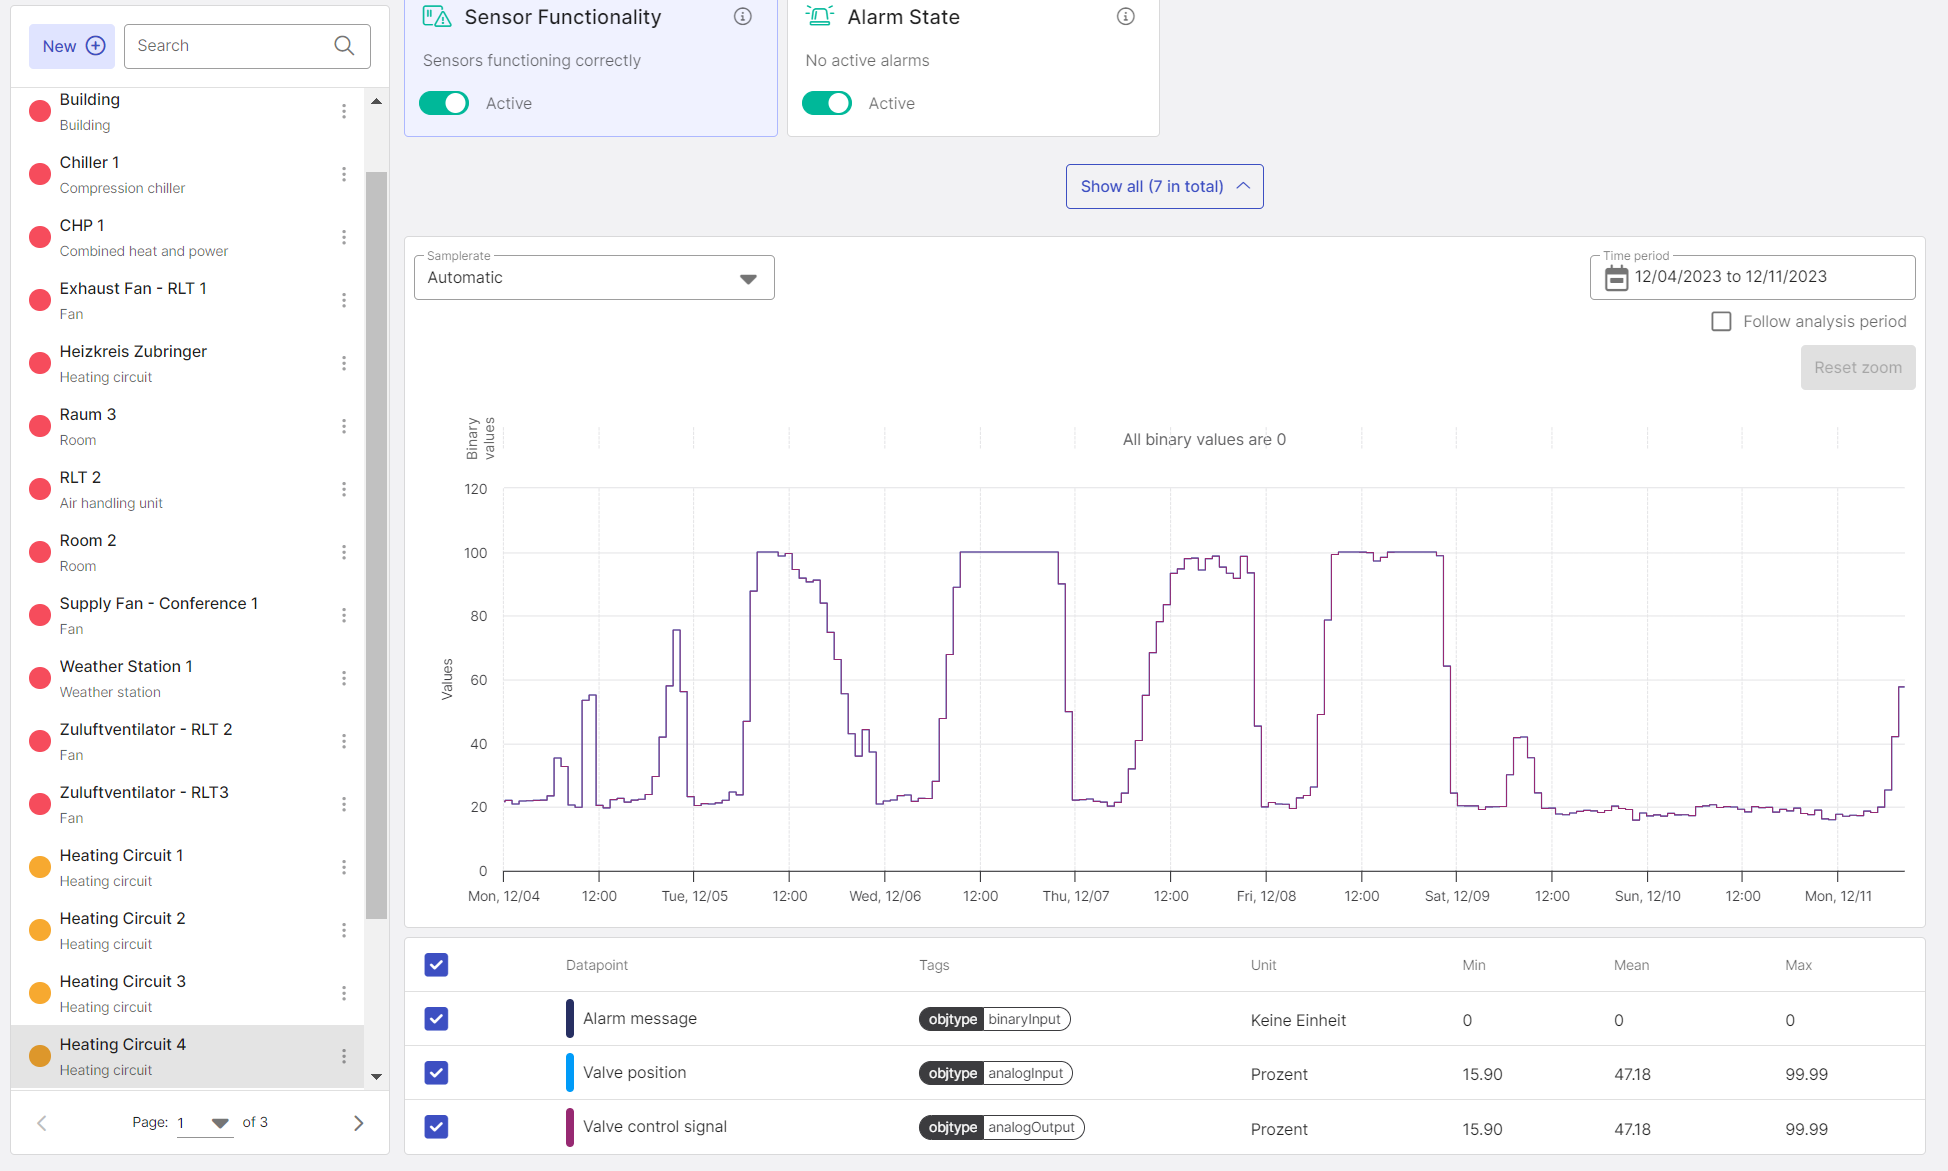
Figure 1: Lineplot of several datapoints, legend below the datapoints
Below the analyses and recommended actions, the time series of the assigned datapoints of a component are displayed in different colors. For a better overview, the displayed timeseries are listed in a legend below the diagram. The list includes further information such as the displayed unit of the timeseries, further tags, and the possibility to hide a timeseries.
The following functions are available:
Period
When selecting a component, the values of the last 7 days are always displayed. By clicking on the existing time period, you can select a new time period as desired. To do this, always select the start date first, then the end date and click on "ok".
Follow analysis period
By clicking on the "Follow analysis period" checkbox, the period of the analysis selected above will automatically be used.
Exact value
If you point with the mouse pointer to a position in the data series, the exact value and time will be displayed.
Detailed view of several values
Draw a frame around the time range you want to examine more closely by holding down the left mouse button. As soon as you release the mouse button, only the framed time range is displayed (zooming). To leave this view, click on the "Reset Zoom" button that has now appeared.
Hide datapoint
If you click on the checkbox, the corresponding datapoint will be hidden.
Sort datapoints
The data points in all columns can be sorted by clicking in the header row of the table.
Changing the unit used
The currency used and the units displayed can be customized using the profile overview. A guide on how to select the currency and the unit system is given in the user profile section. Selecting the unit changes the display of the timeseries, as the observations stored in the timeseries are now converted to the target system. For example, the timeseries of a temperature can be converted between the metric system and the international SI system of units. This conversion works for individually reviewed datapoints on the Datapoint page, for results and values of our AI-based control algorithms, as well as for entire components on the Optimization page. Figure 2 shows the timeseries of the component Heating Circuit 4. The unit system here is set to Metric.
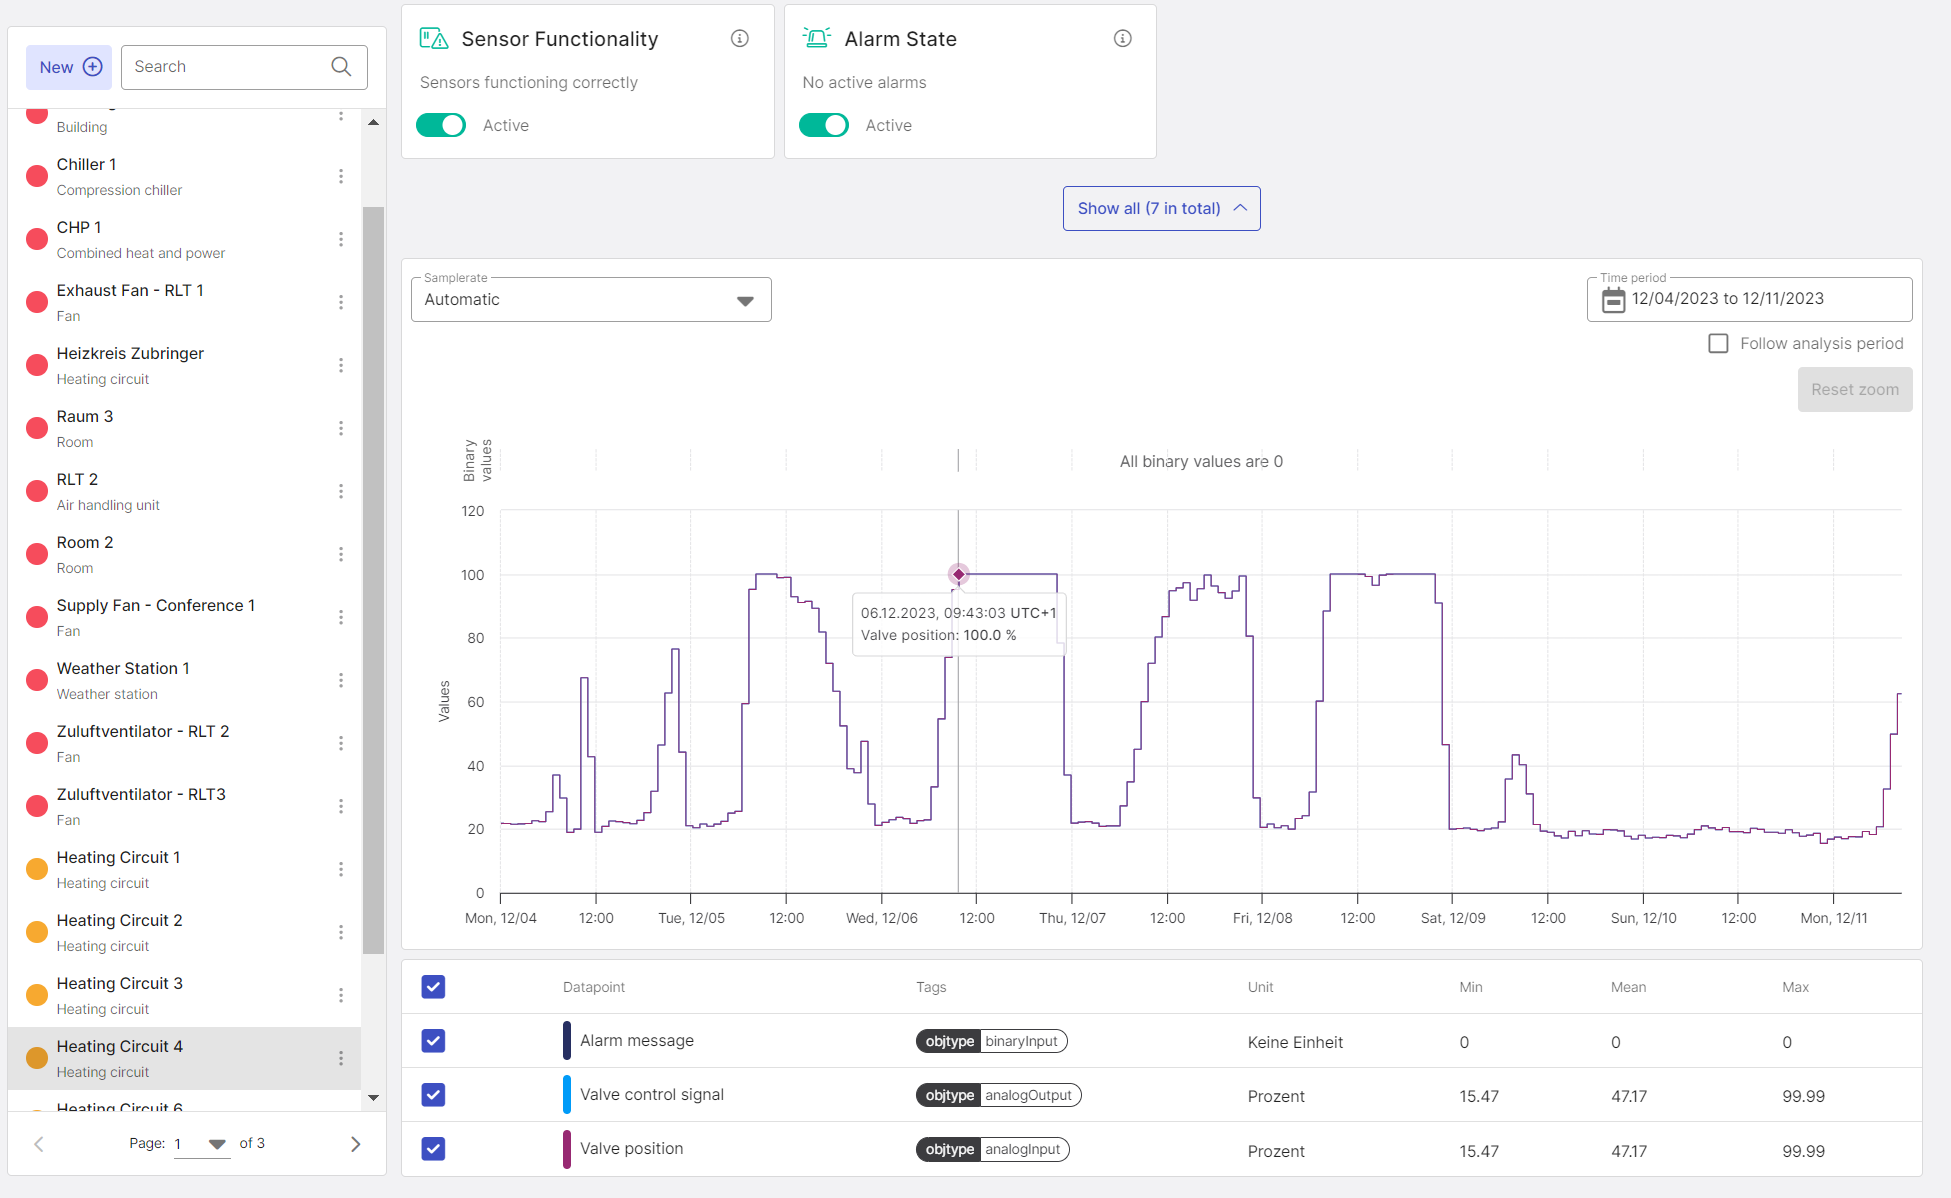
Figure 2: Lineplot of the datapoints of the component Heating Circuit 4 using the Metric System
By changing the selected unit of display to the international SI system, all datapoints are converted from the metric to the SI system. This changes the displayed value to match the selected unit system.