Engineers - Frontend user guide
Info
This tutorial refers to aedifion's old frontend. The old frontend is available by adding "old." in front of your deployments URL or by using the button "Go to old frontend". E.g., to get to the old version of aedifion's frontend on www.aedifion.io you must enter old.aedifion.io.
A user guide on how to use .analytics via the frontend of the aedifion.io cloud platform.
Please note, displaying videos is currently not available via the Safari web browser. Please use web browsers like Edge or Chrome instead.
Overview
The frontend of the aedifion.io cloud platform provides an intuitive, clear, and fast solution for the .analytics workflow. This workflow contains the following steps:
- Instancing components of your energy system.
- Mapping datapoints to instanced components.
- Configure analysis functions and reports.
- Get and explore analytics results.
- Add information to datapoints using tags.
- Create lineplots with multiple datapoints and save the plots as view.
This page offers a user guide for the .analytics workflow. Most steps are visualized in a video, and clarified by an example.
See below for the individual steps of the .analytics workflow.
Instancing components
This video shows how to create and name a component for a project.
Short overview of necessary steps:
- Choose a project.
- Switch to "Results", click on "Create a component", and choose a component to create.
- Set a german and english name, and optionally set an abbreviation.
- Press "Save Changes".
Mapping datapoints
This video shows how to map datapoints to a created component.
Short overview of necessary steps:
- If you have not chosen a project, choose one.
- Switch to "Results", click on "Create a component", and select the component to be mapped. If the component you would like to map is not created yet, create it.
-
Map a datapoint to a pin:
- Choose a pin of the component by clicking on it.
- Select a datapoint from the list on the left.
- Press "Save Changes".
-
Repeat steps a) to c) for all pins of the component you would like to map.
Configuring and activating .analytics reports
This video shows how to write attributes, configure analysis functions, and therefore also enable .analytics reports of a created component.
Short overview of necessary steps:
- If you have not chosen a project, choose one.
- If you have not chosen a component, switch to "Results". In case there are no results for the desired component, the component is not listet in this view. To open a list of all created components, click on "Create a component". If the desired component is not found, create it.
- Navigate to the "Attributes" section below the mapping view.
- Write the information you want to assign to a particular attribute in the box. Changes are changes automatically.
- Navigate to the "Analysis" section below the "Attributes" section.
- Choose the analysis functions, you are interested in, by clicking on the slide controller. The analysis functions can be chosen automatically based on the mapping. You can deselect analysis functions by clicking on the slide controller.
- The selected analysis functions are executed every monday.
Exploring analytics results
This video shows how to explore the results of executed analysis functions.
Short overview of necessary steps:
- If you have not chosen a project, choose one.
- Switch to "Results" and choose the desired component. The components are color-coded based on the analysis results.
- Below the plotview, you find all mapped datapoints and below them, the results of the analysis functions (interpretations, recommendations, and KPIs).
Adding information to a datapoint
Information can be added to a datapoint as tags. The information can be chosen freely.
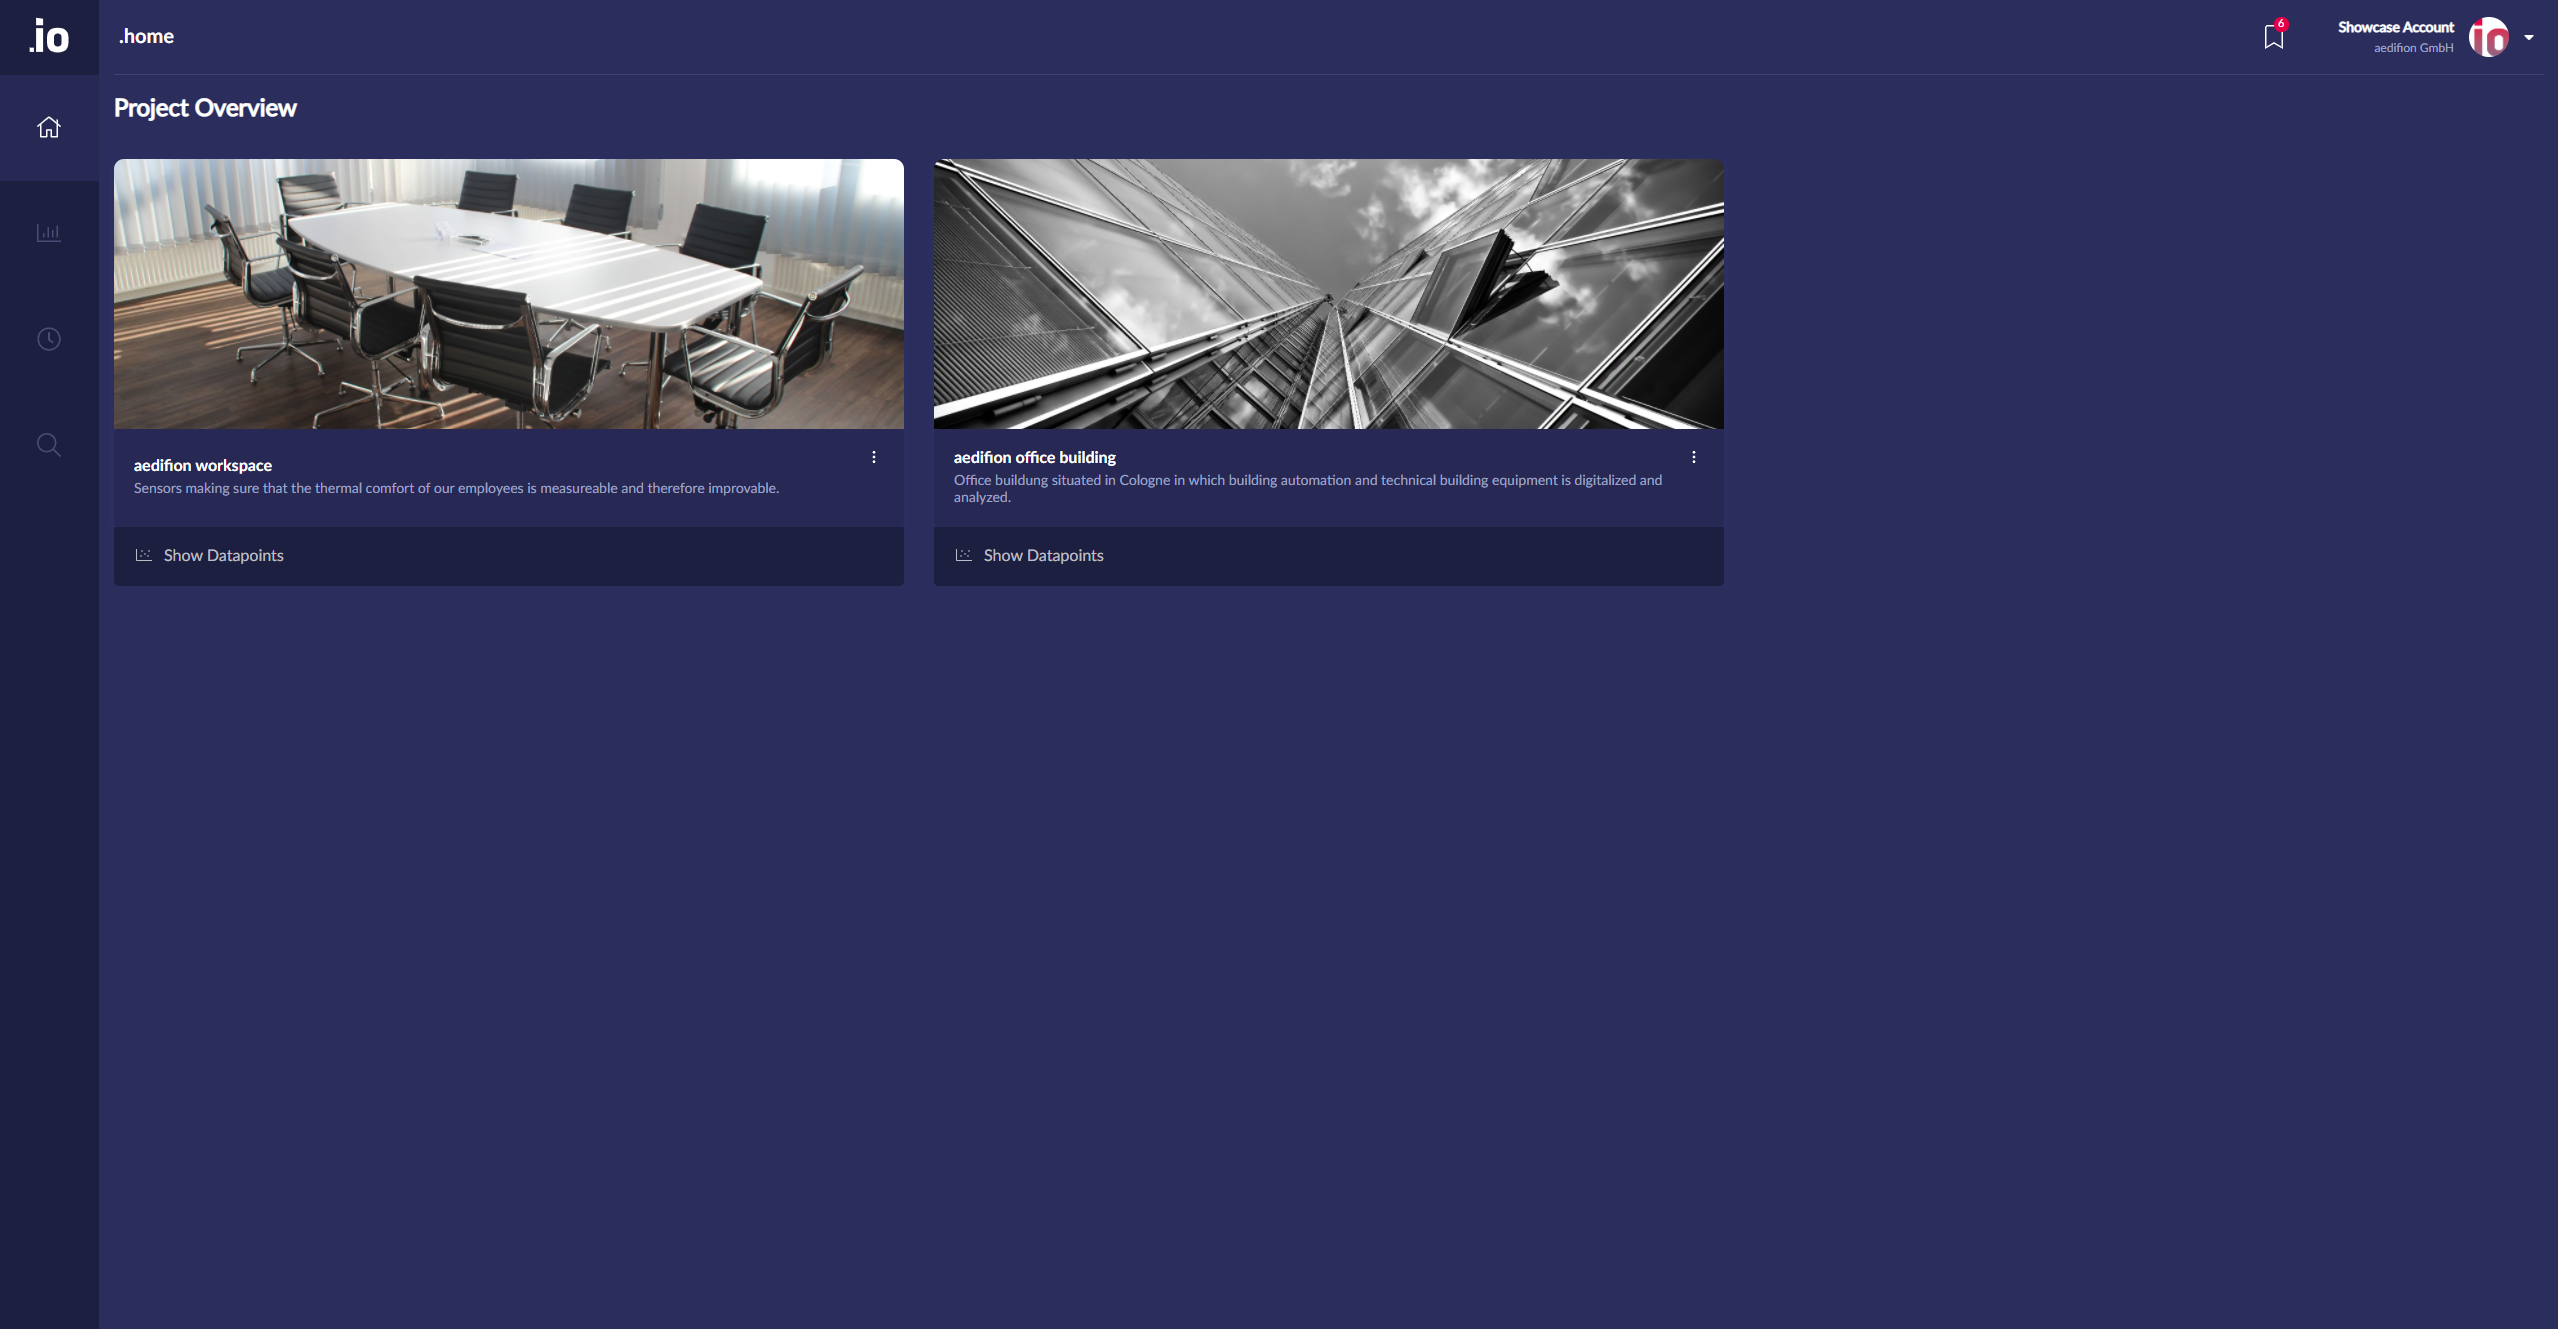
To add information to a datapoint, choose a project by clicking on the desired project. Figure 1 shows the overview of available projects.
If you have selected a project, switch to "Datapoints". You can now search for a datapoint using the search bar. Select the datapoint by clicking on it. All selected datapoints are displayed in the plot area as shown below.
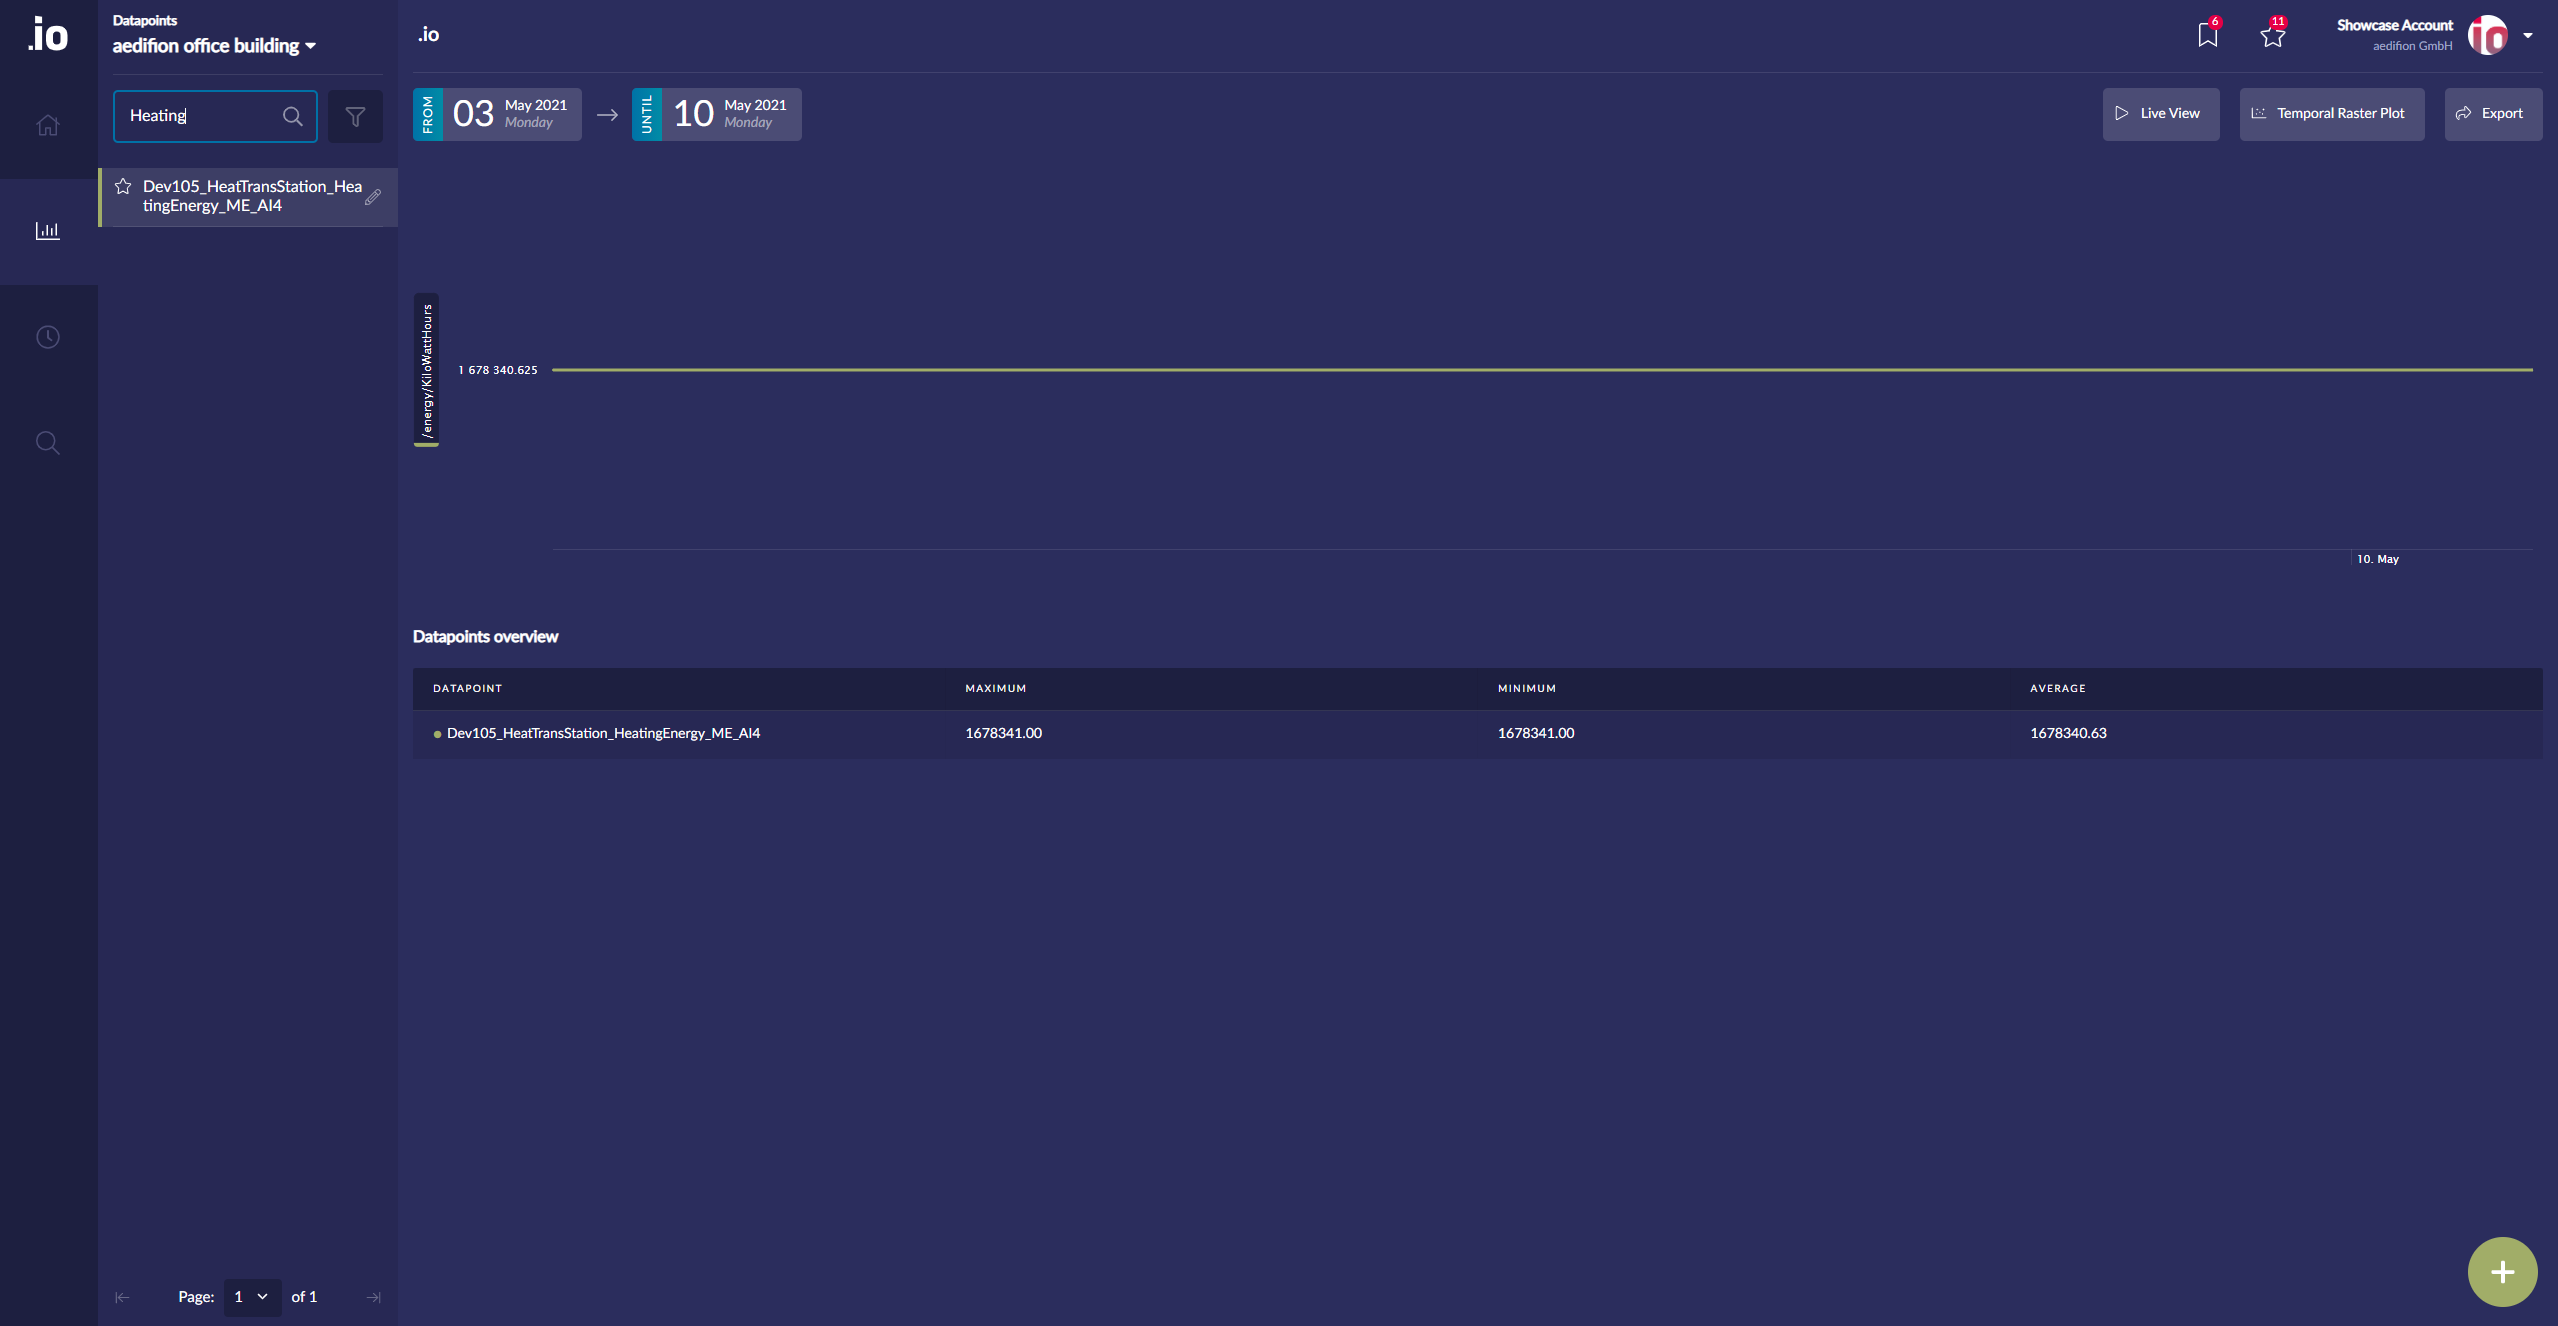
Figure 2: Plot of the selected datapoint
After you have found the desired datapoint, you can open the datapoint's "Tags" by clicking on the pencil icon next to the datapoint name (right side) in the datapoint list on the left. The tags are listed on the right, as shown in figure 3.
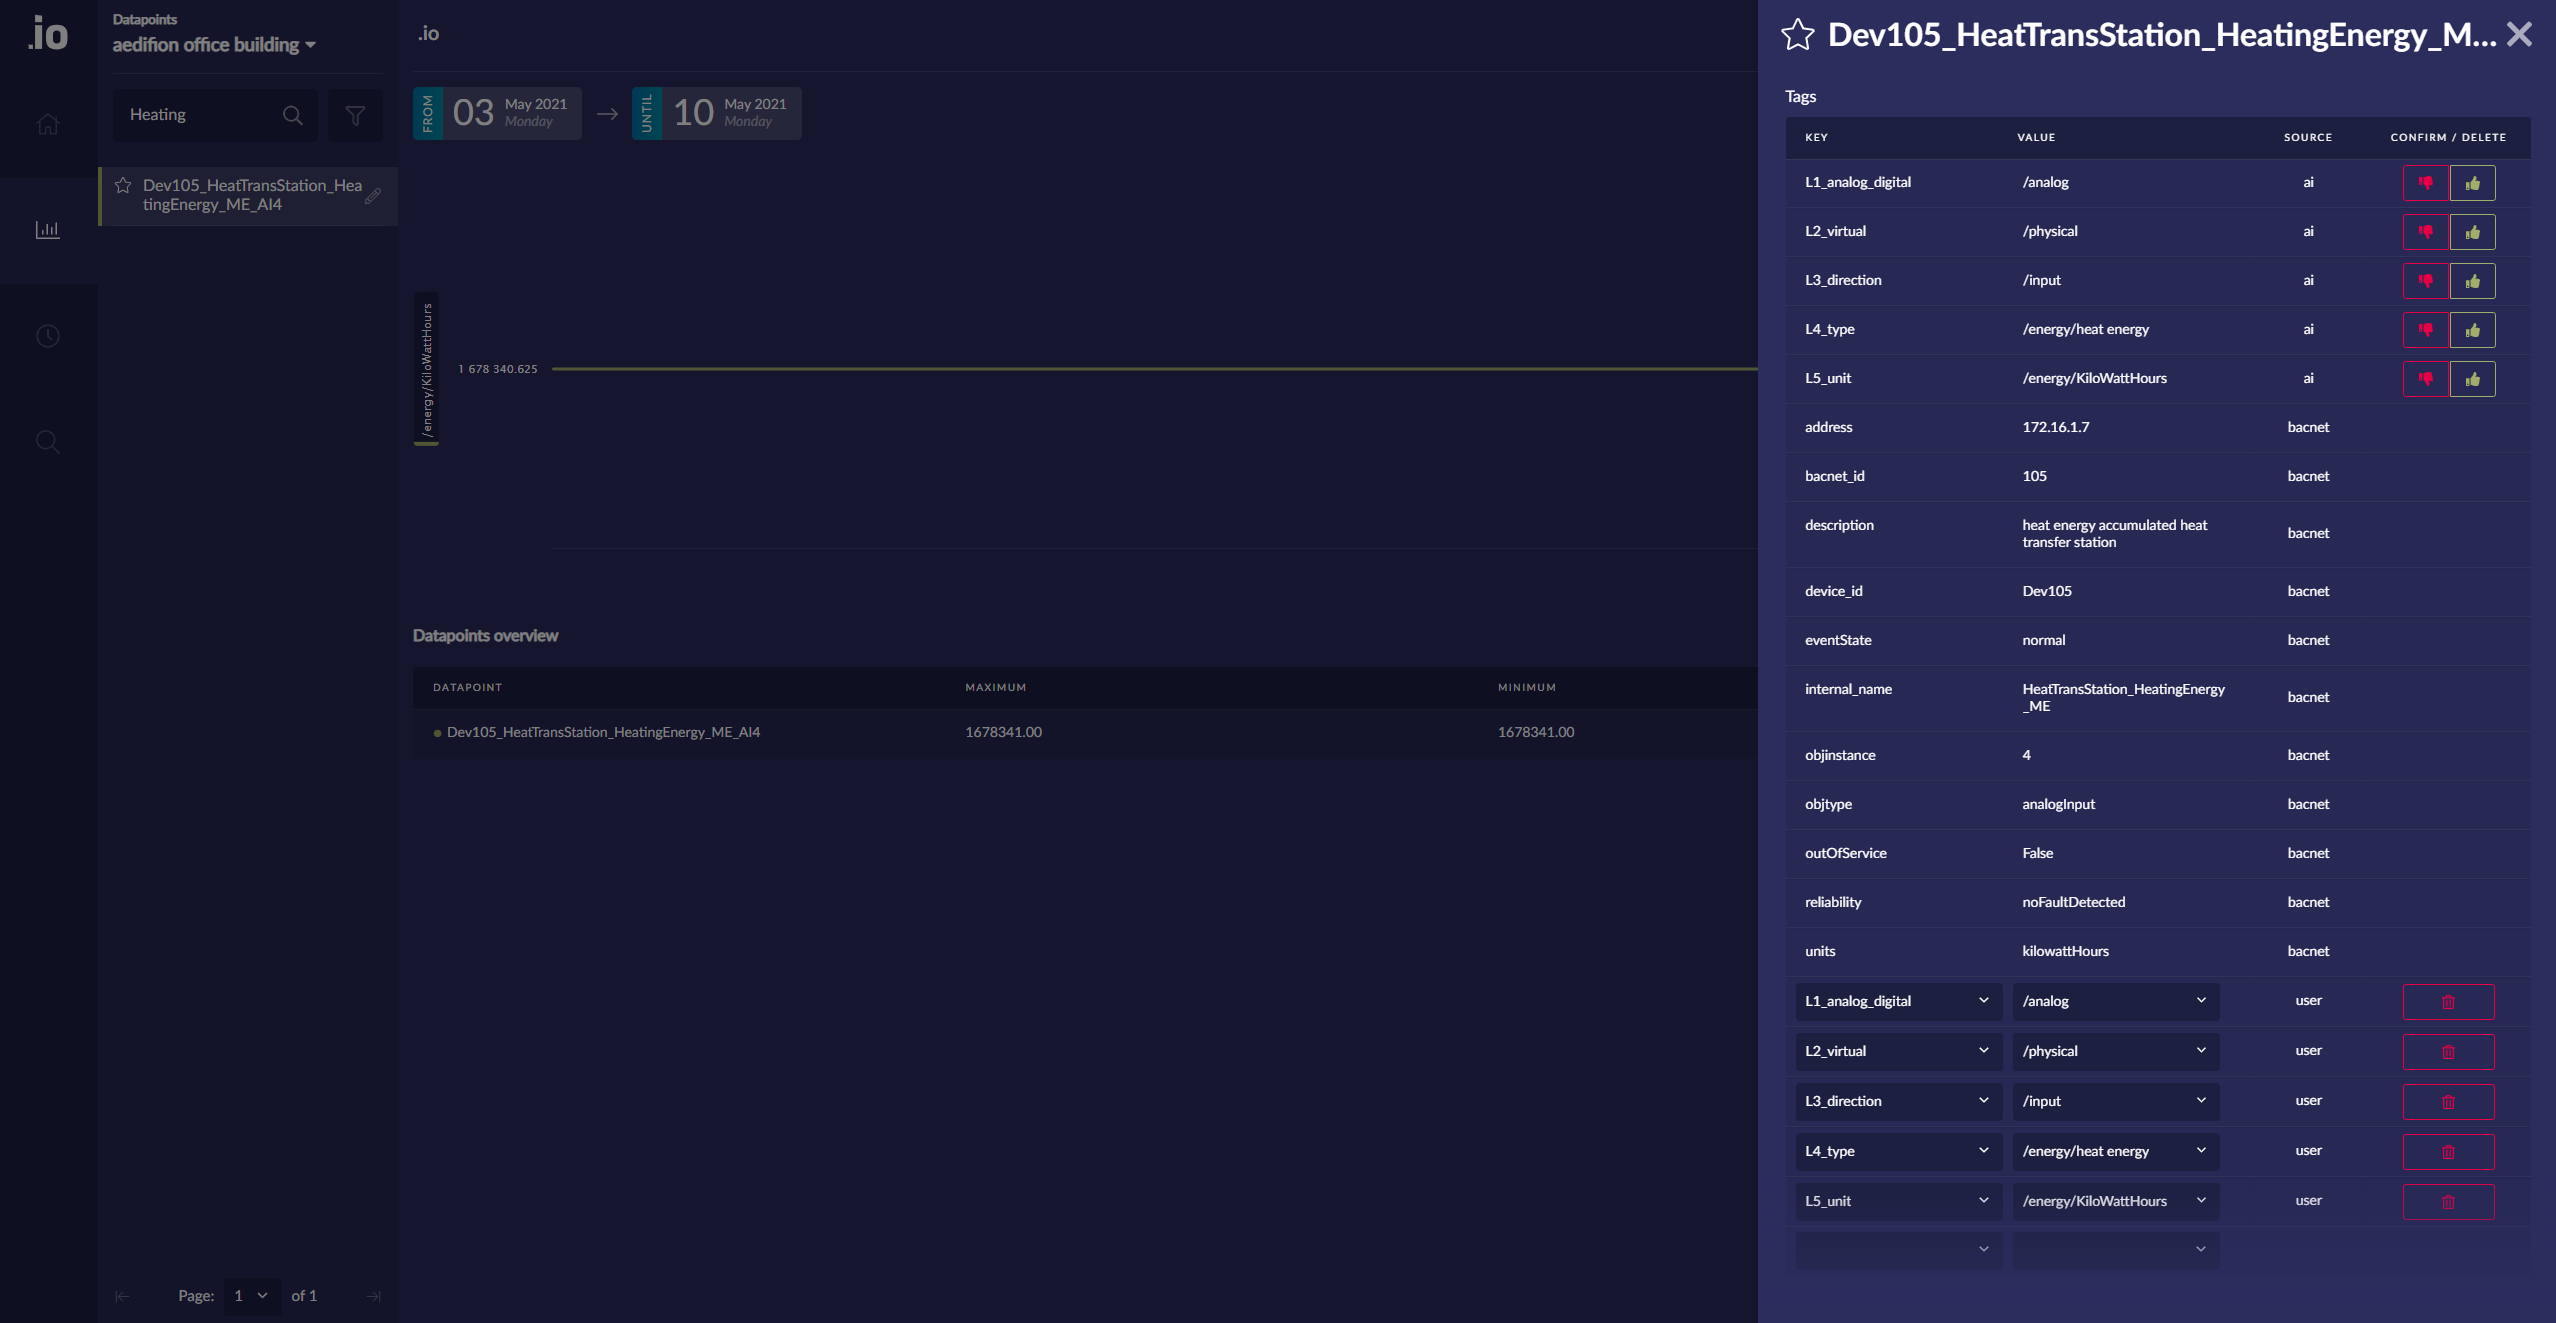
Figure 3: List of tags of the selected datapoint
Now, you can navigate to the bottom of the list and add a new tag by typing in a "KEY" (e.g., "energy price" or "cost center") for your tag (figure 4). To create the tag, click on "Create".
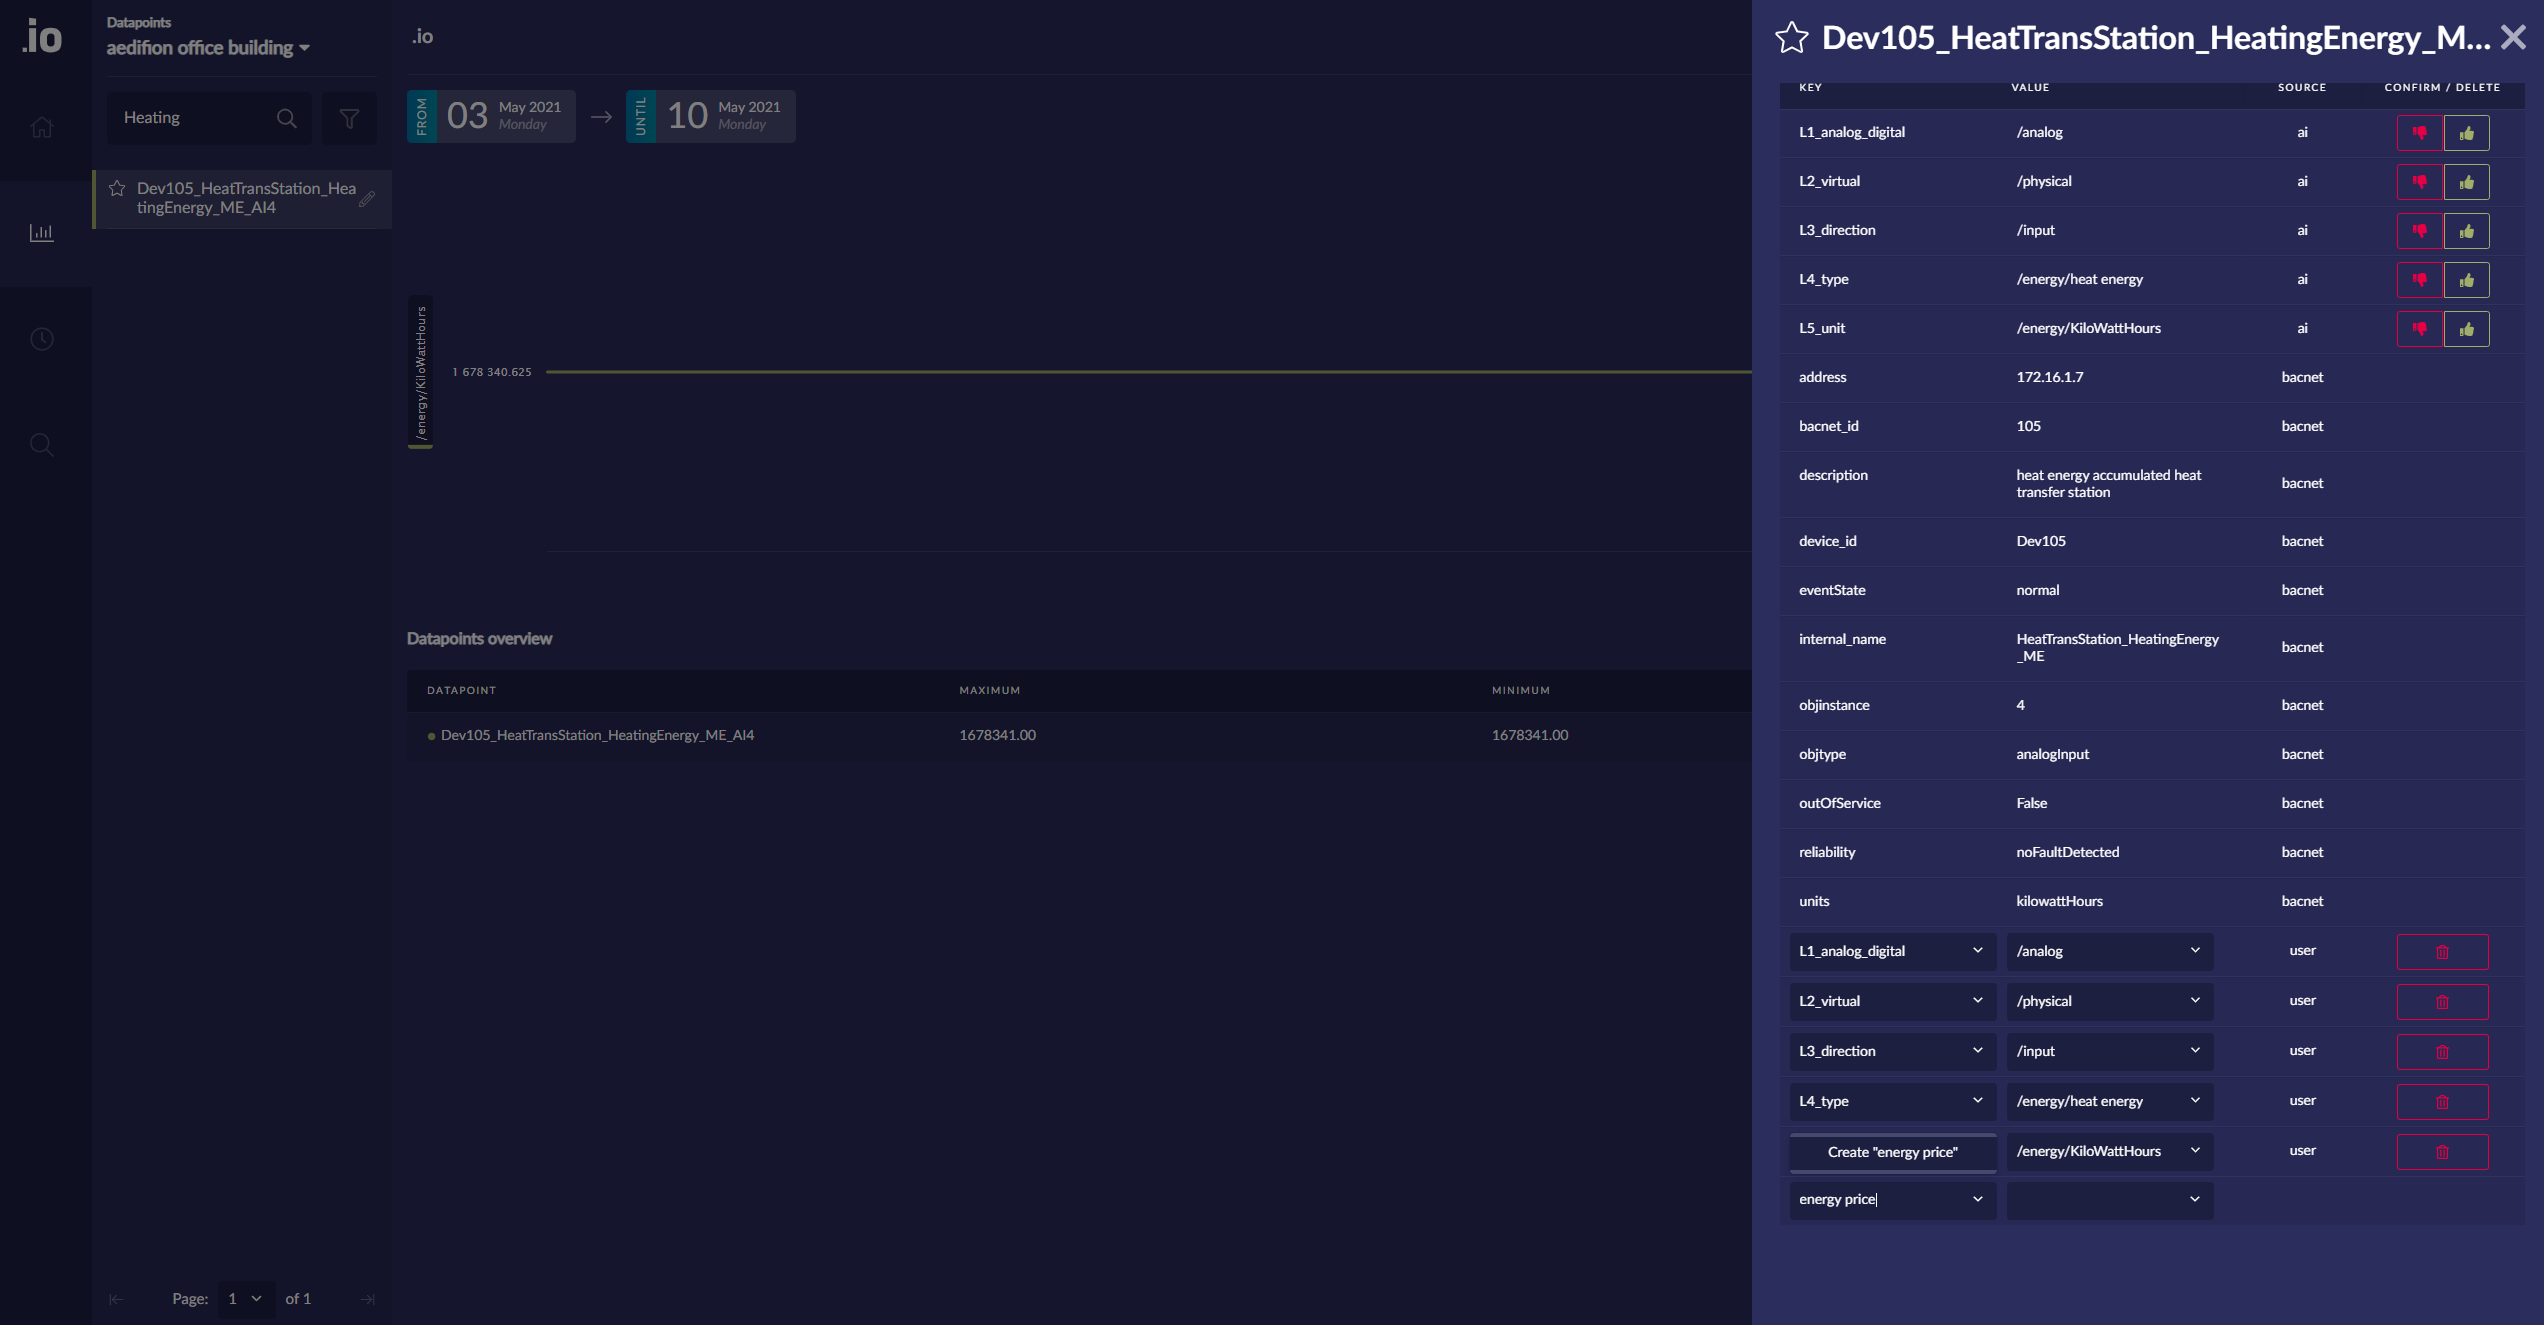
Figure 4: Creation of a new tag
To set the value of a tag (e.g., the energy price of 0.08 €/kWh), enter the desired information in the "VALUE" field and click on "Create". The information to be assigned can be freely selected, as shown in figure 5.
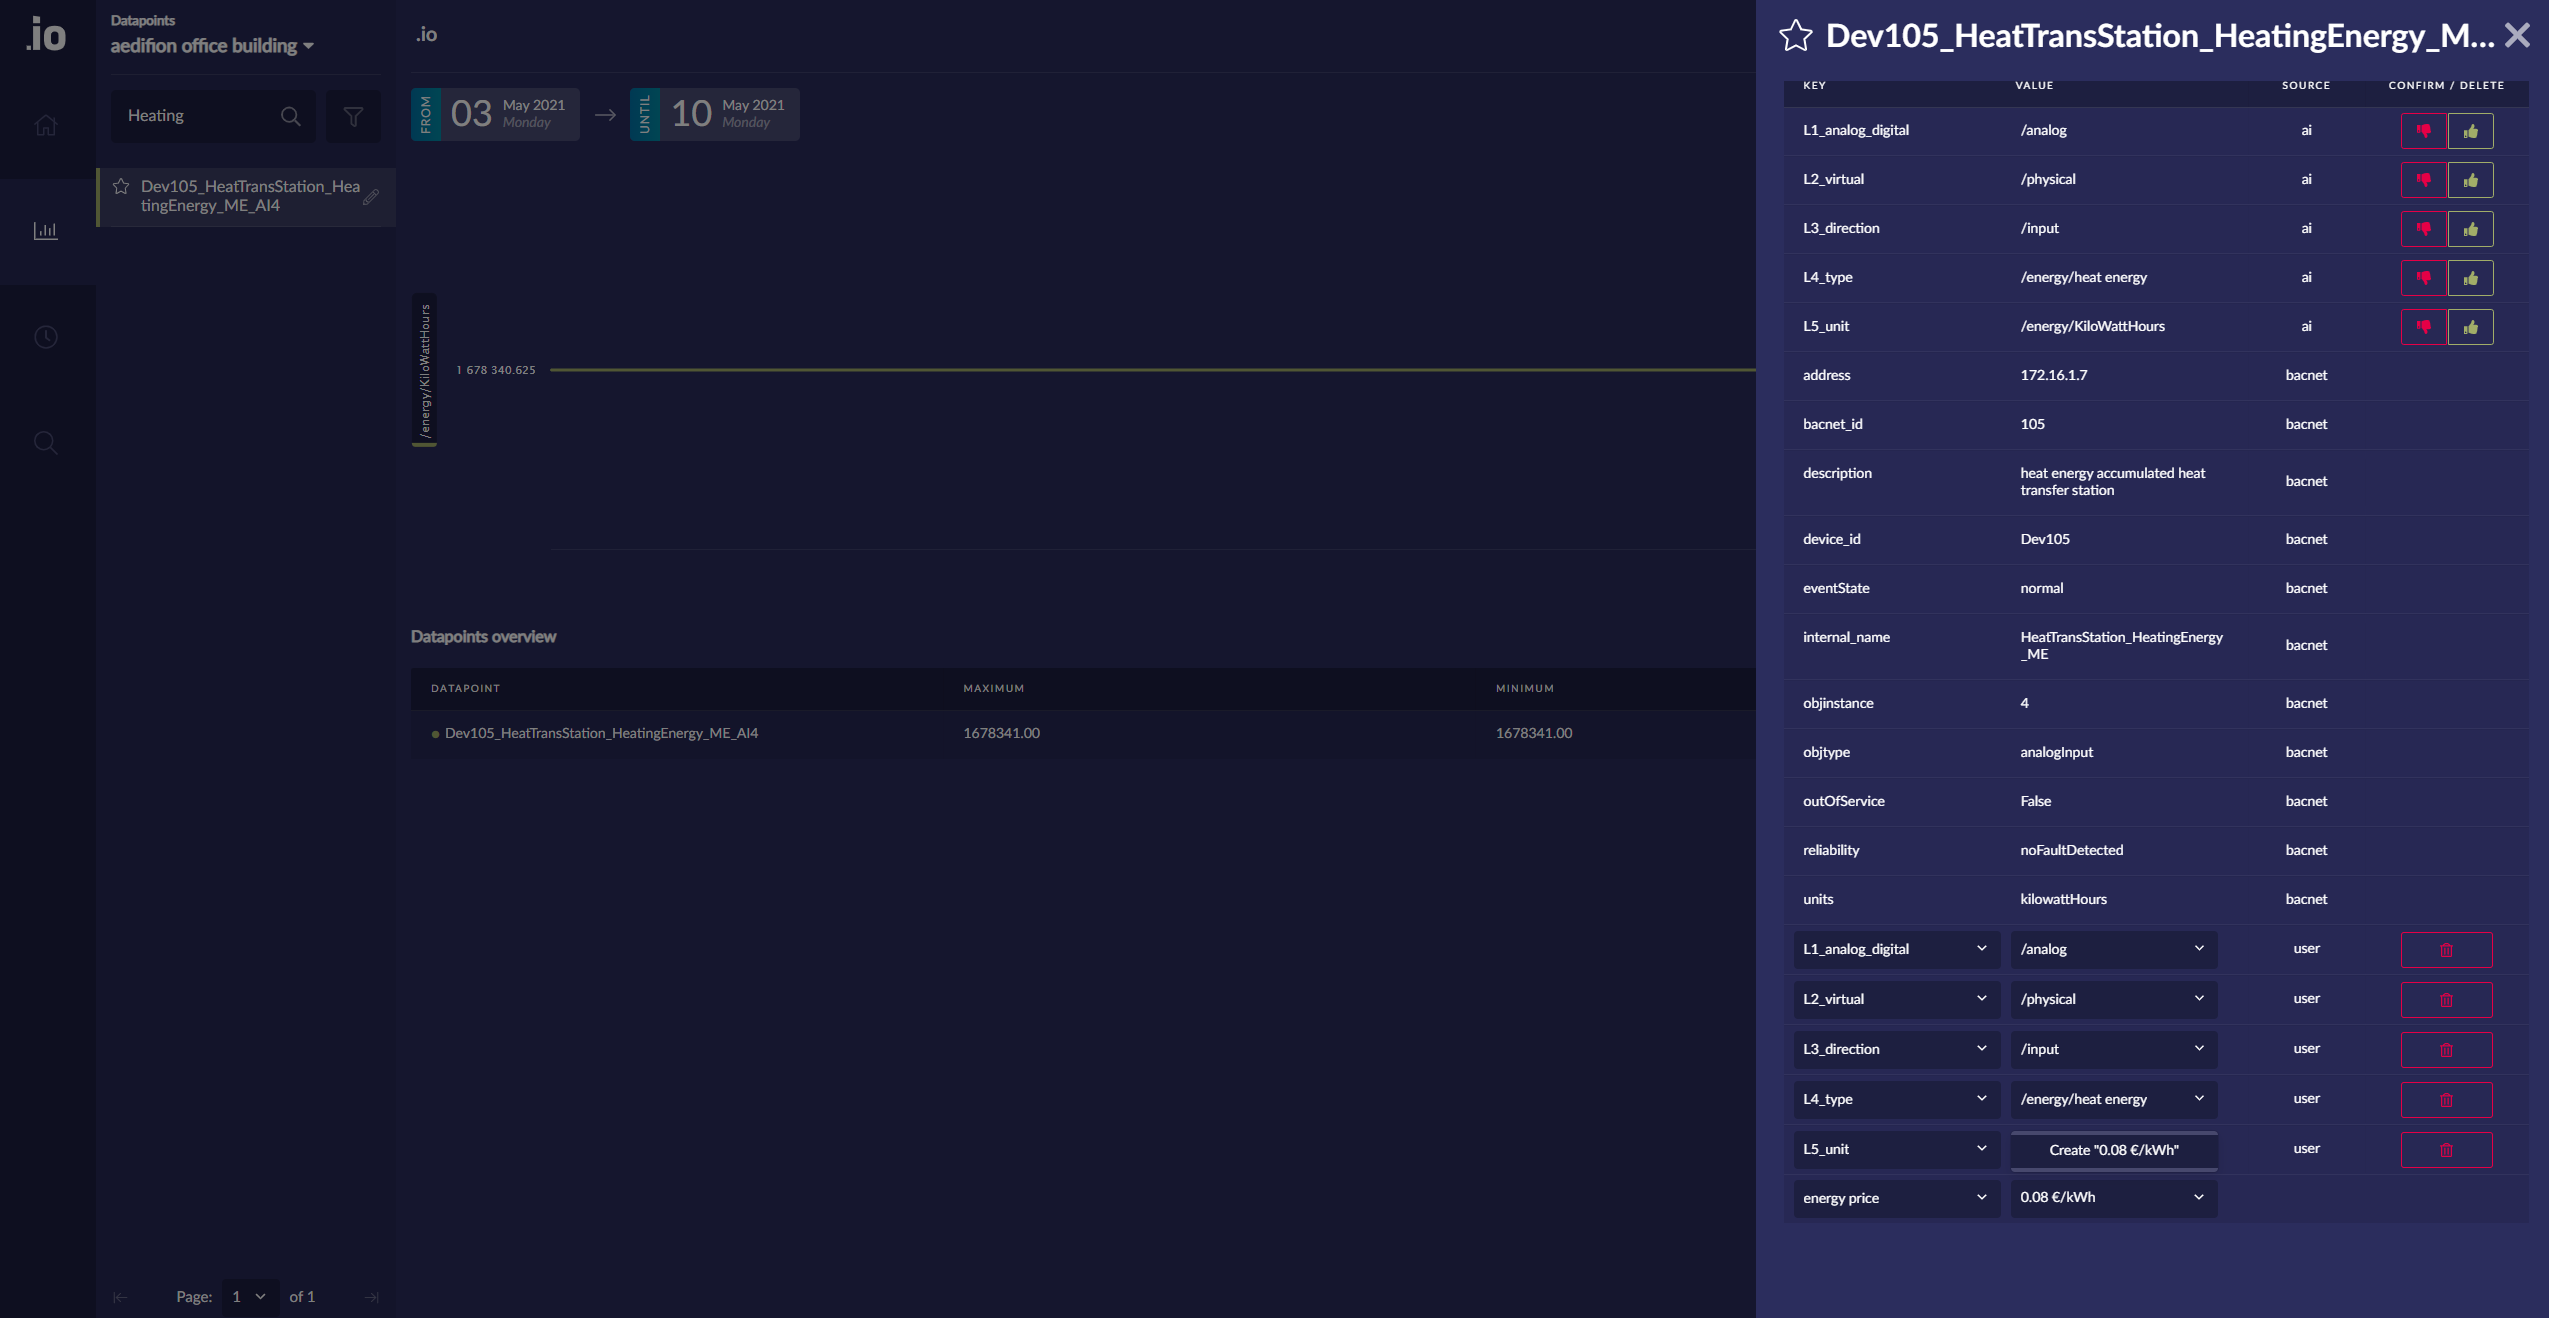
Figure 5: Set a value for the new tag
Figure 6 shows the datapoint's "Tags" after successfully adding the new tag to the datapoint.
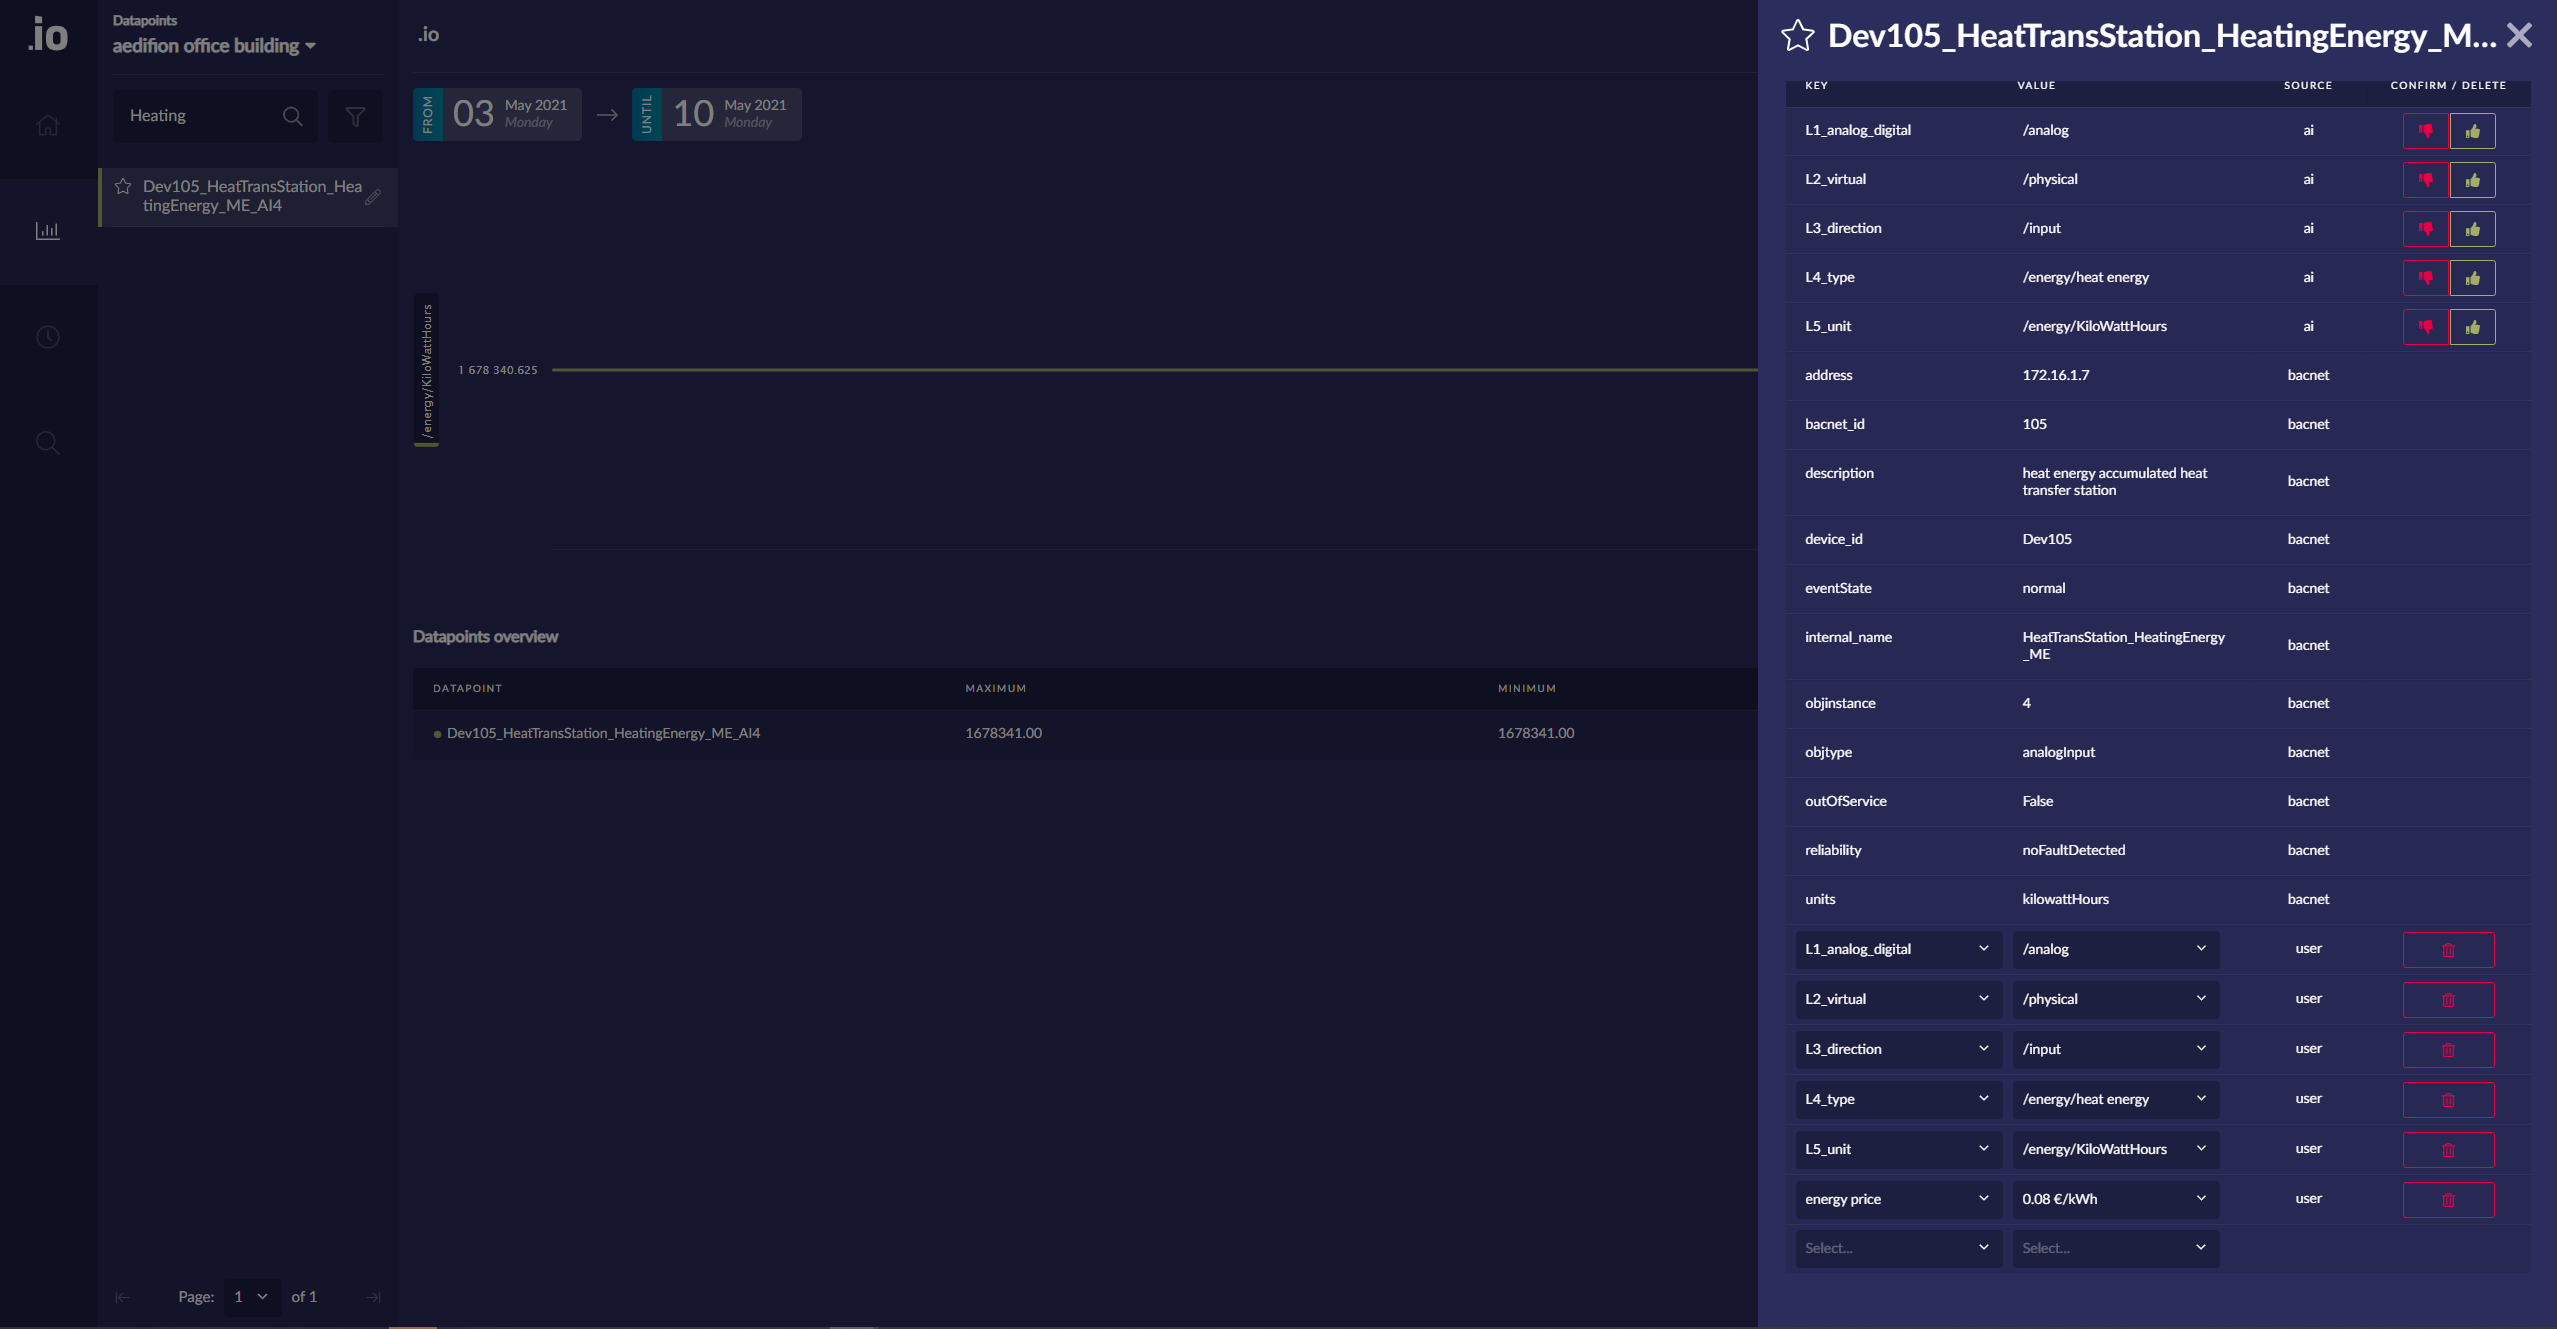
Figure 6: List of tags of the selected datapoint after adding a new tag
Short overview of necessary steps:
- If you have not chosen a project, choose one.
- Select "Datapoints" from the navigation bar on the left.
- Type the datapoint name in the search bar and if you do not know the correct name, search for it by typing parts of it.
- Click on the pencil icon to the right of the datapoint name. The information about all tags set are displayed.
-
You can now create a new tag and save the information by
- Navigating to the bottom of the listed tags.
- Entering the name of the new tag to the blue box in column "KEY".
- Entering the information, you would like to add to the datapoint, to the box in the column "VALUE".
Create a plotview with multiple datapoints and save it
In a plot, more than one datapoint can be shown. This plot can be saved for later inspection, too.
To create a new plot, choose the desired project as shown in figure 1 from the section about adding information to a datapoint.
If you have selected a project, switch to "Datapoints". You are now able to search for the datapoint, you would like to plot. You can search for a datapoint using the search bar, as shown in figure 2 from the section about adding information to a datapoint.
You can add more datapoints to the plot. To do so, search for and select the desired datapoints one by one. Figure 7 shows a plot with three selected datapoints, below this plot the displayed datapoints are color-coded and listed with further information such as maximum and minimum values.
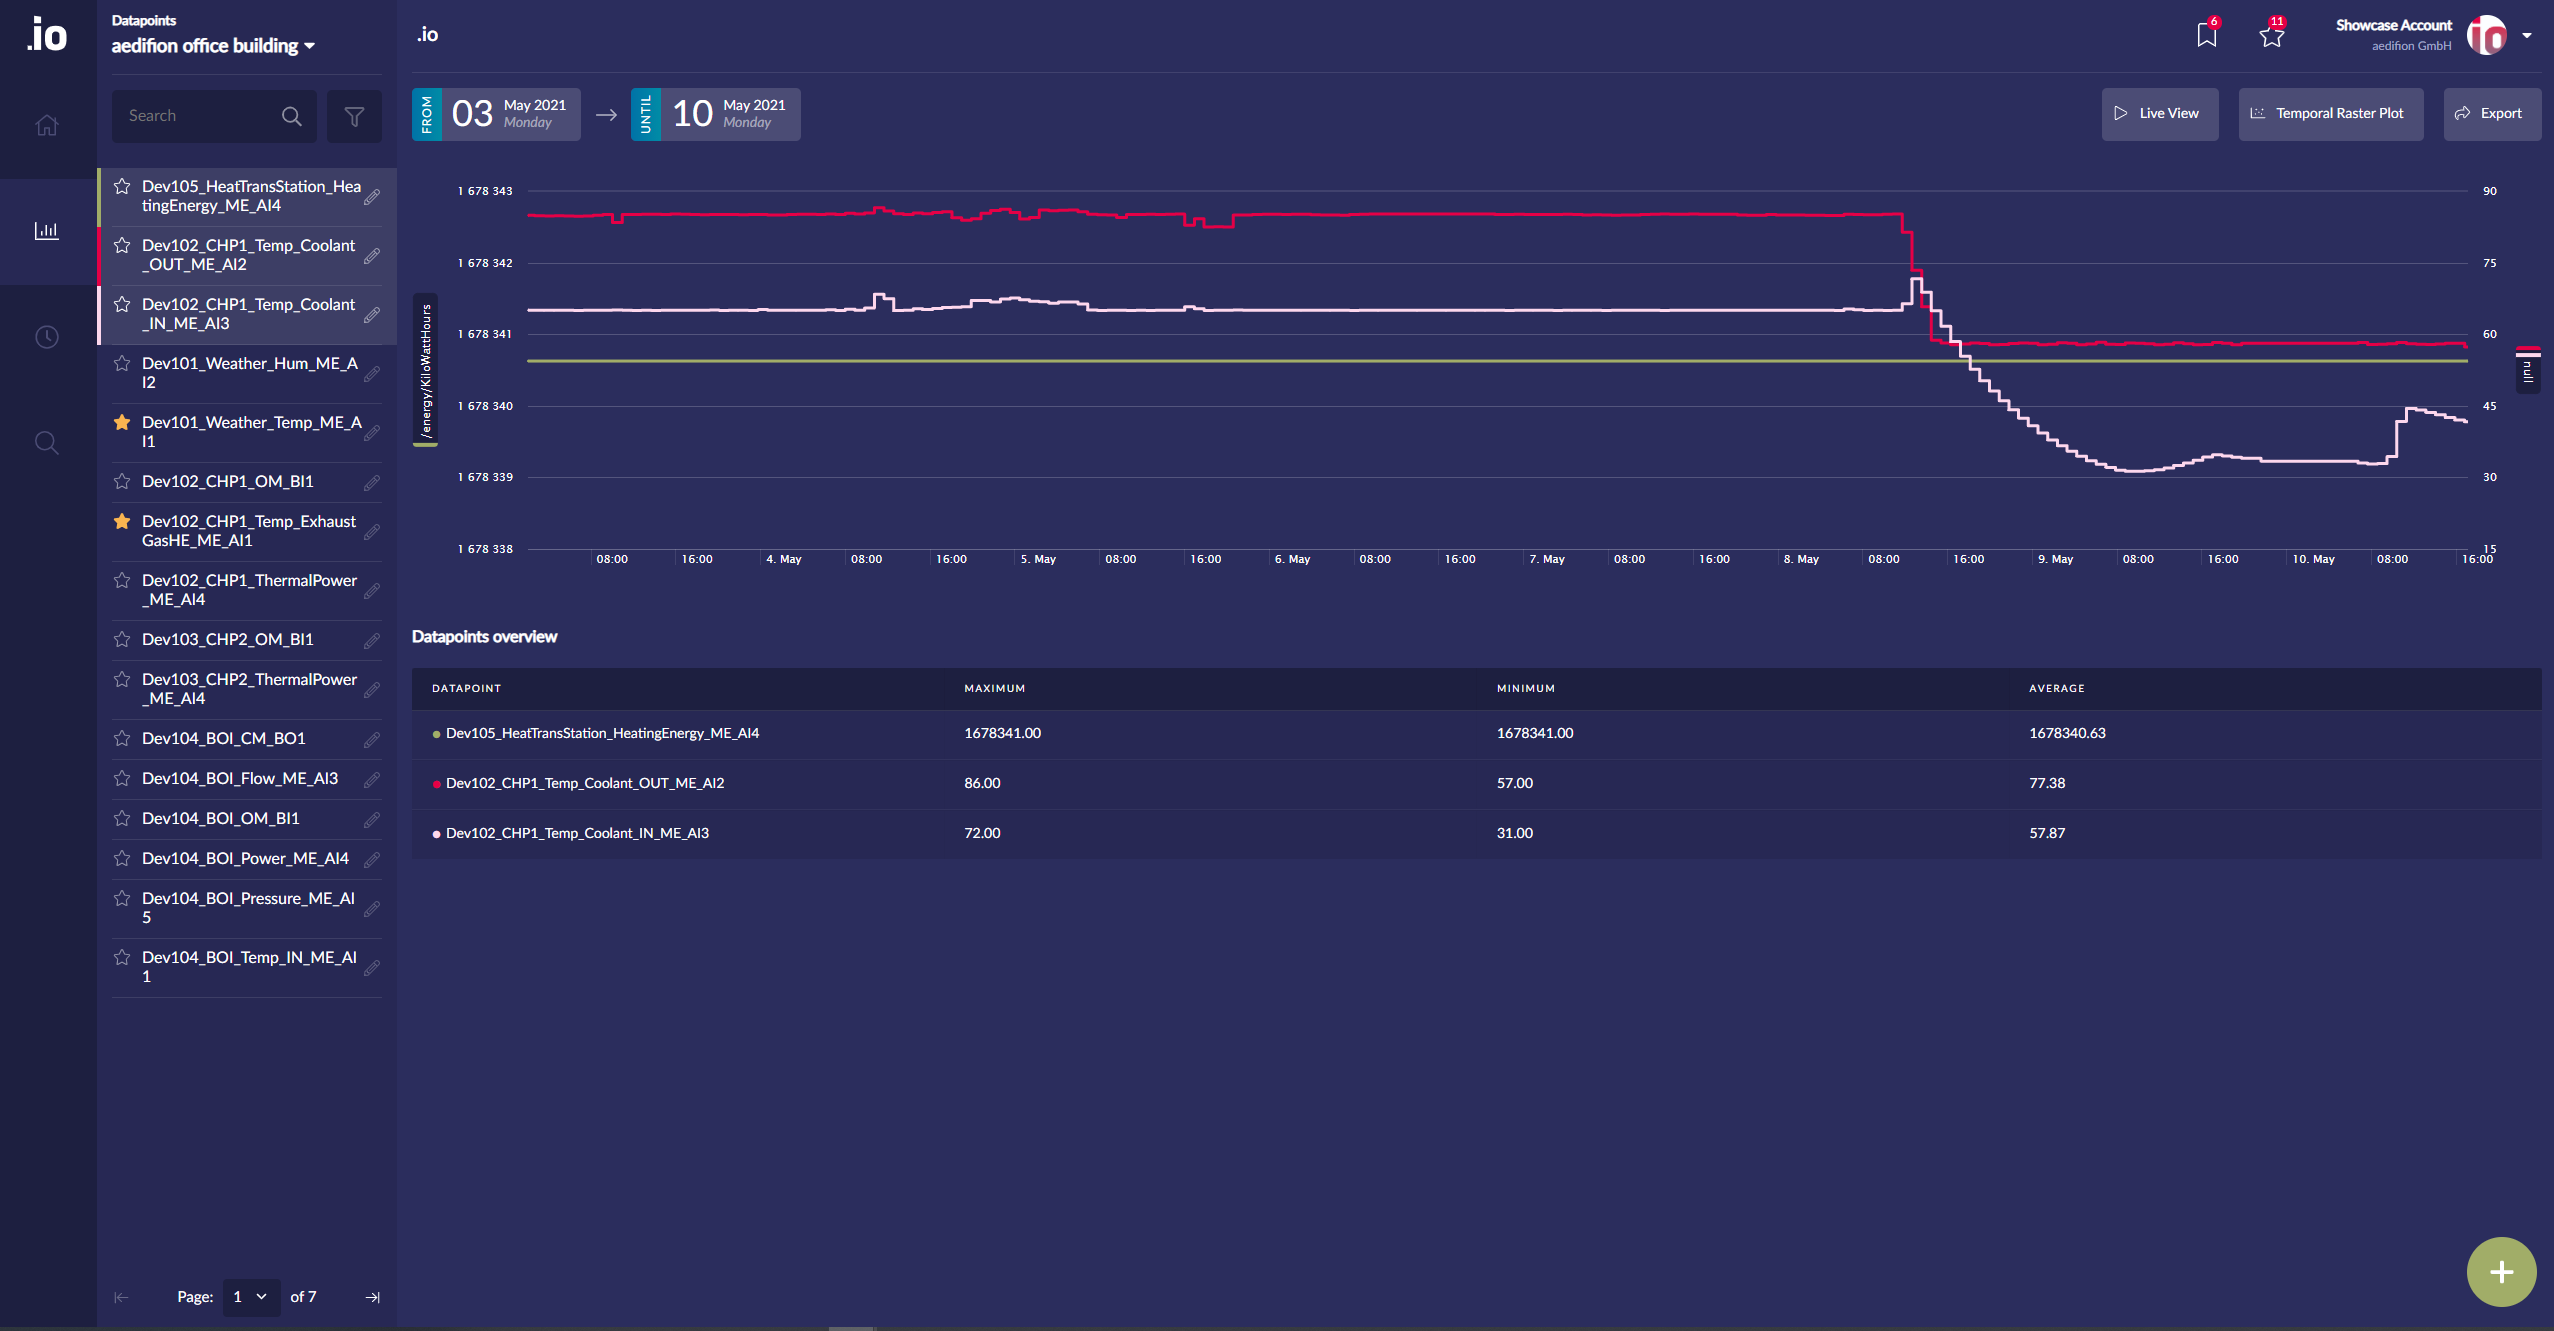
Figure 7: Plot with three datapoints and additional information
To modify the evaluation period, use the date picker, as shown in figure 8. The evaluation period can be chosen freely.
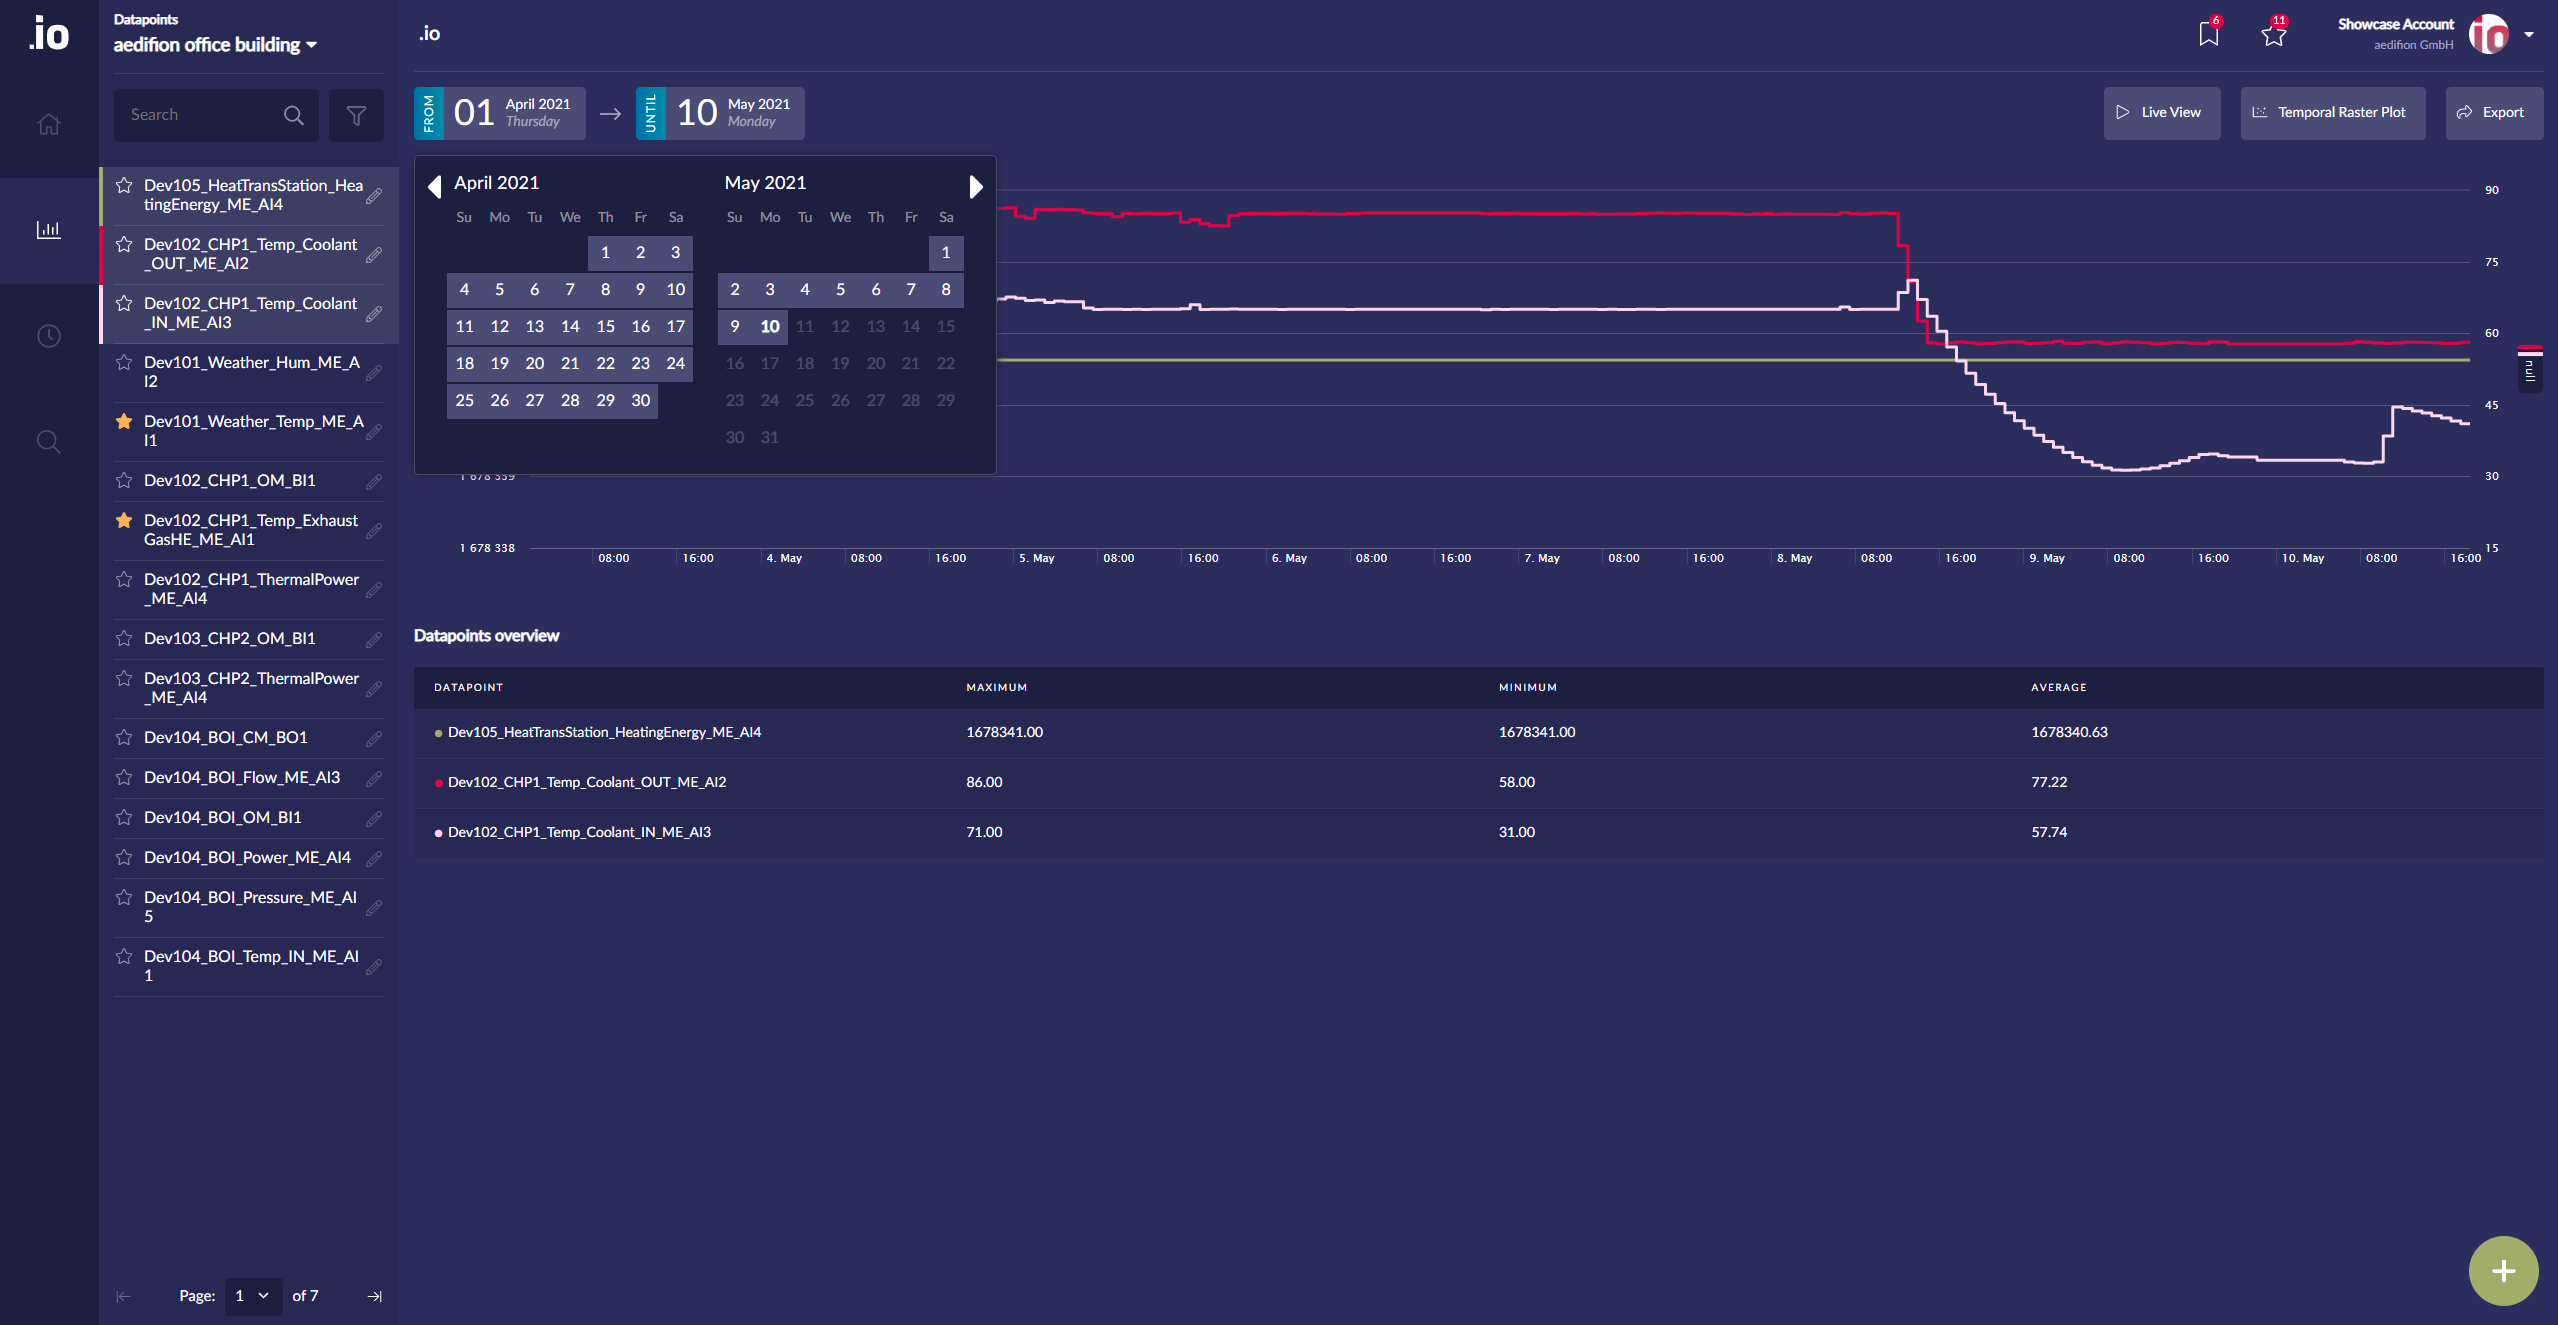
Figure 8: Select evaluation period using the date picker
To create and save a plotview, click on the green plus sign in the bottom right corner as shown in figure 9. Select "View" from the shown possibilities.
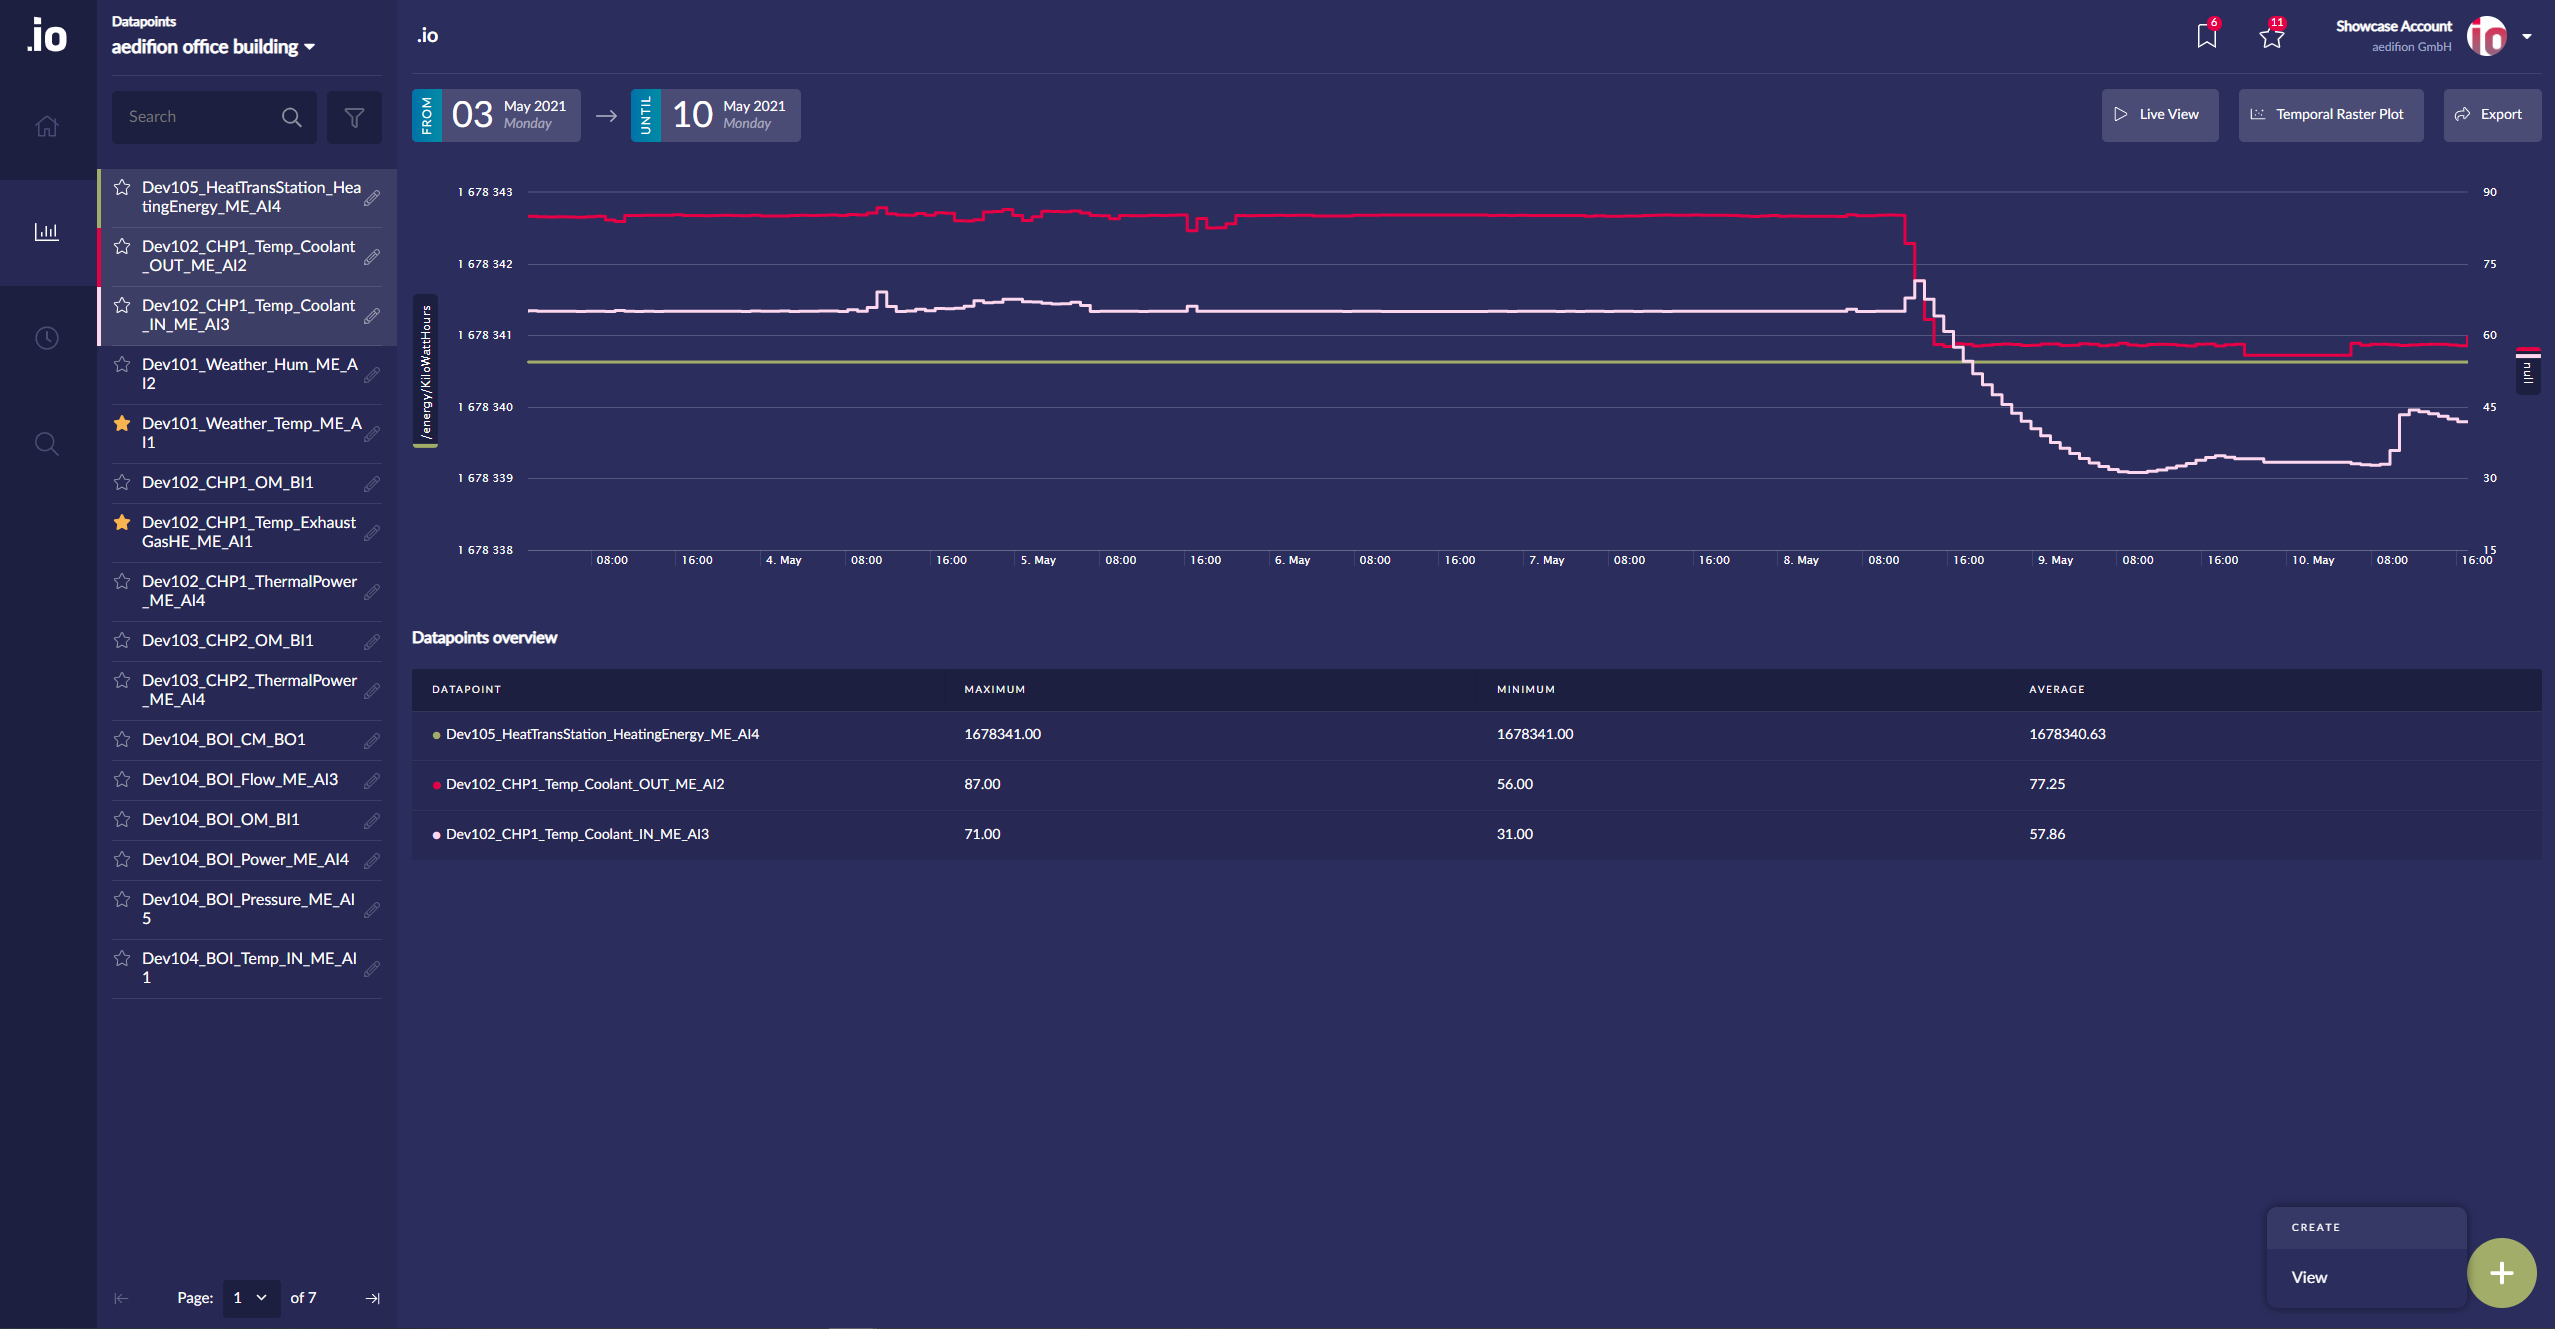
Figure 9: Create a new plotview
After clicking on "View", a window with all datapoints will show up. In addition, the view can be named. By clicking on "Create View" the view is saved and can now be reviewed at any time. The overview window is shown below.
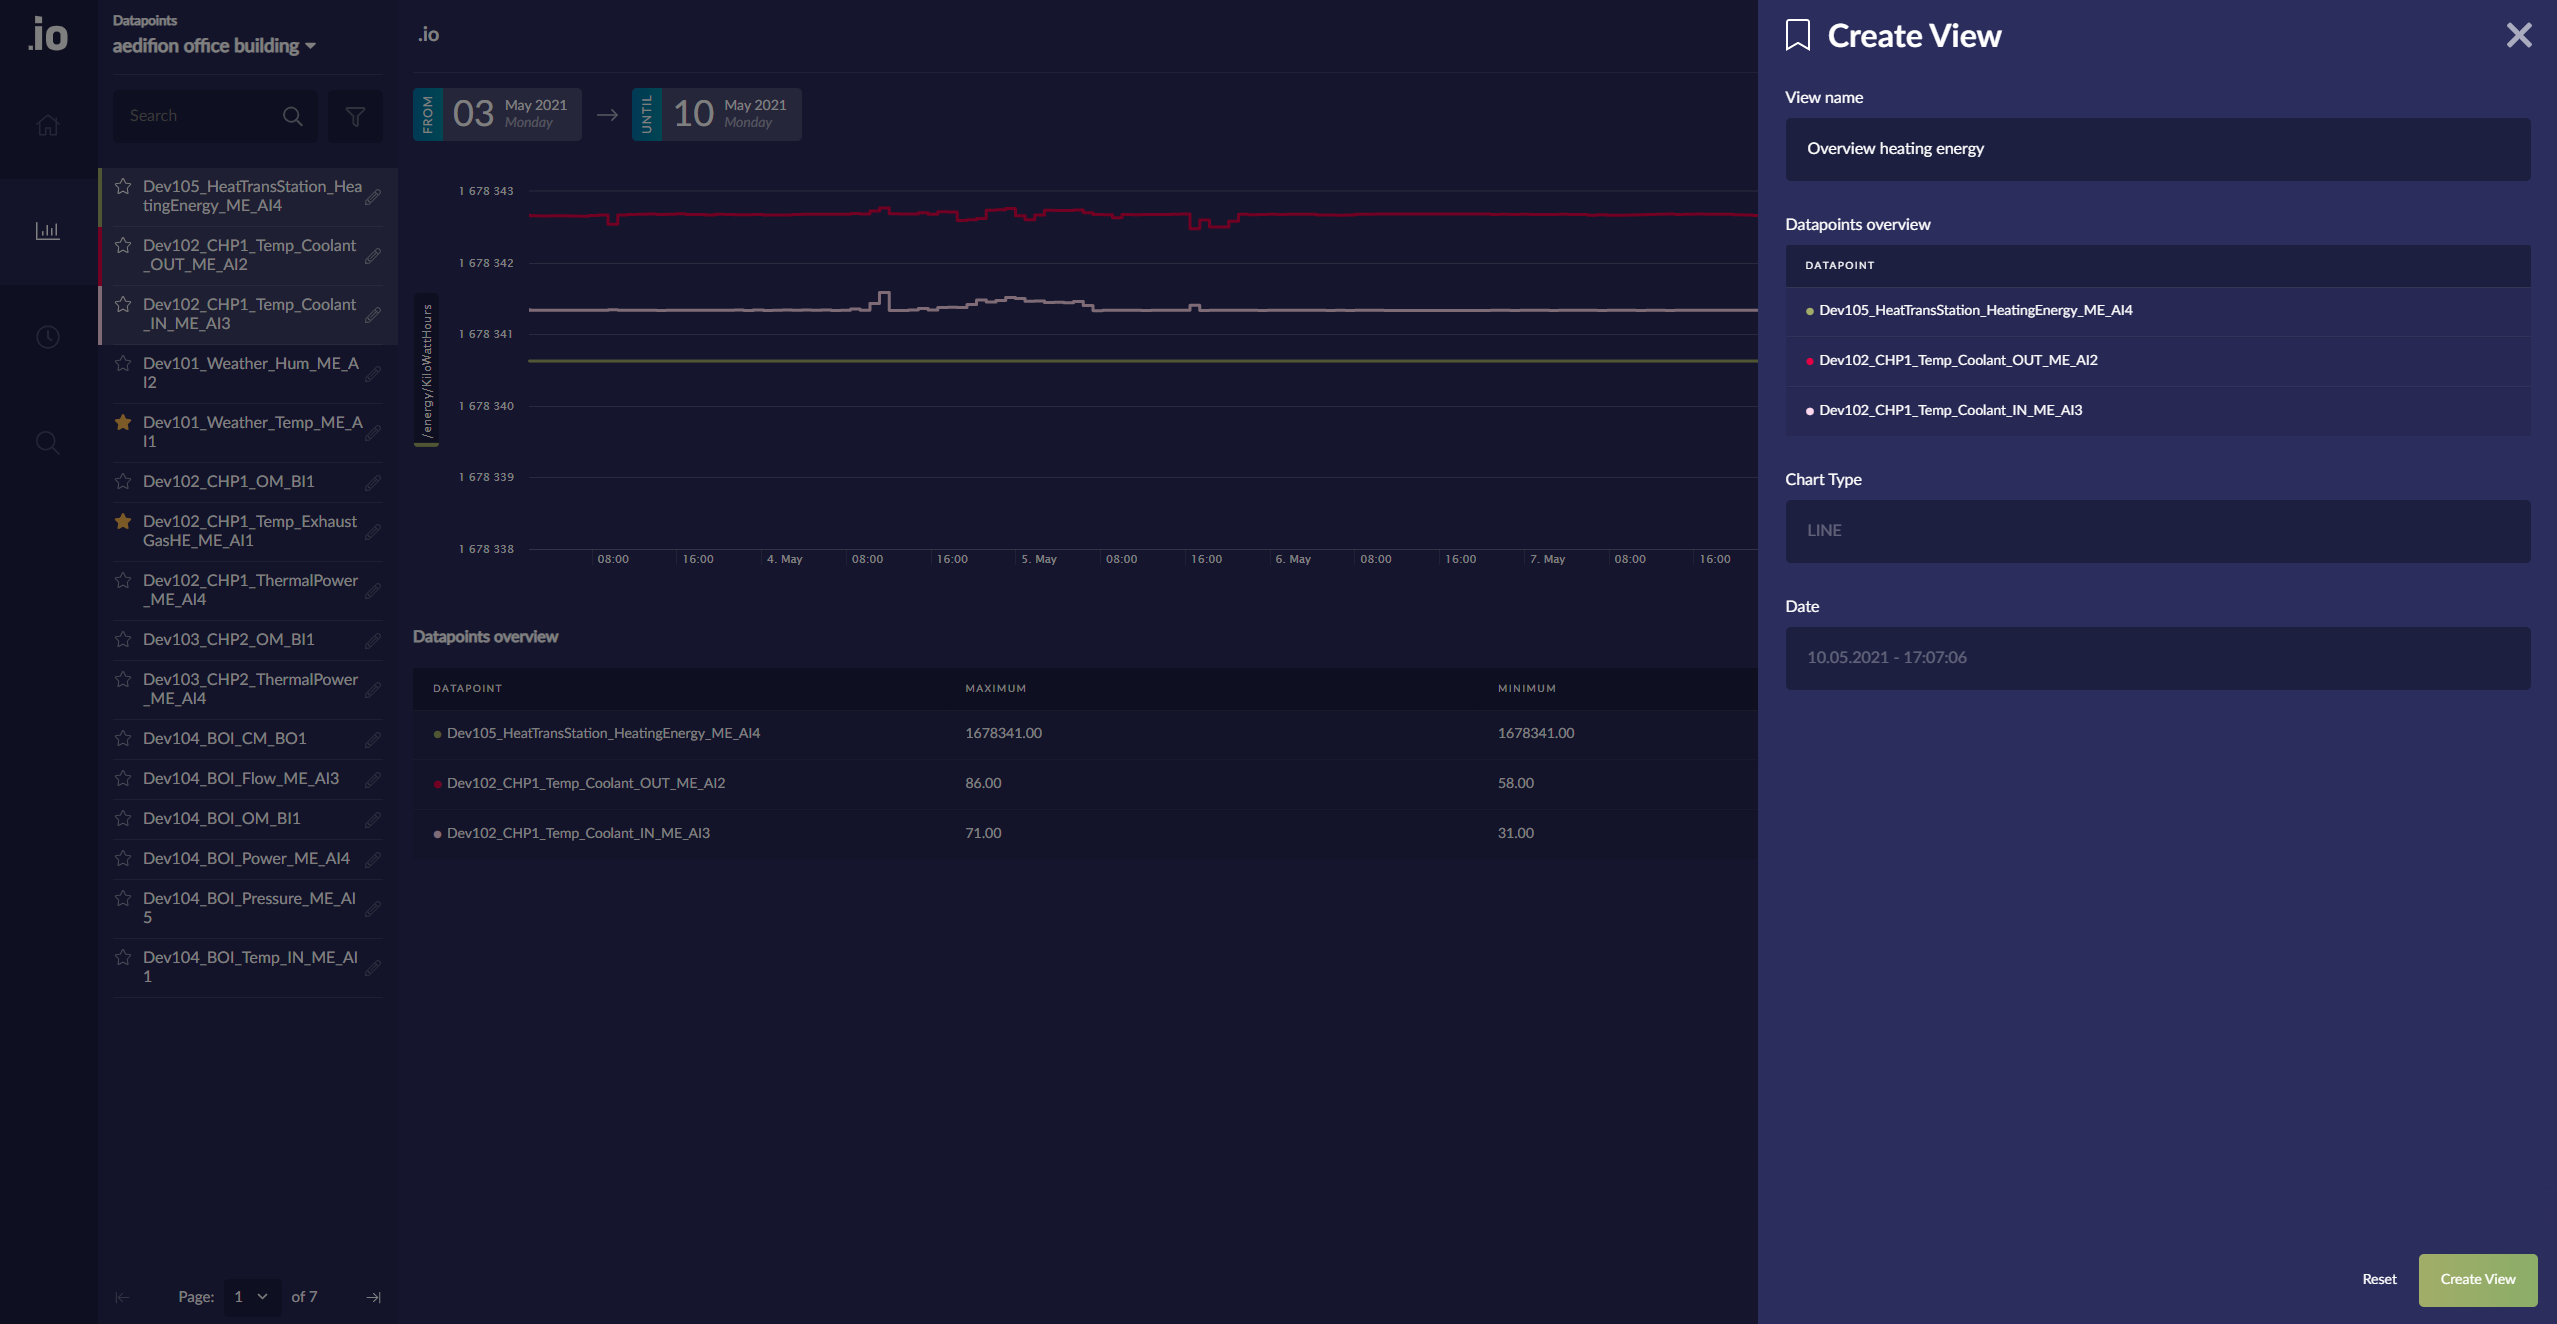
Figure 10: Overview of a new plotview
Short overview of necessary steps:
- If you have not chosen a project, choose one.
- Select "Datapoints" from the navigation bar on the left.
- Type the datapoint name in the search bar and if you do not know the correct name, search for it by typing parts of it.
- Click on the desired datapoint to add it to the plot.
- Repeat steps 3 and 4 for all datapoints, you would like to plot at once.
- You can choose the depicted period by using the date picker above the plot area.
-
You can save the view by executing the following steps:
- Click on the green plus sign.
- Click on "View" in the shown "CREATE" window.
- Enter a name for the plot.
- Click on "Create View" to save the view.
- Revisit old plots by clicking on the bookmark icon at the top of the page.
Export plots
It is possible to export plots using our frontend.
To create a new plot or select an existing plotview of a specific project, choose the desired project as shown in figure 1 from the section about adding information to a datapoint.
If you want to export an existing plotview, click on the bookmark icon and select the plotview, you would like to export. In case you would like to create a new plot, follow steps 2 to 6 from the section about creating and saving plots with multiple datapoints.
To export the plot, click on "Export" in the top right corner. This opens an overview of the available file formats as shown below. The following file formates are available:
- PNG
- JPEG
- SVG
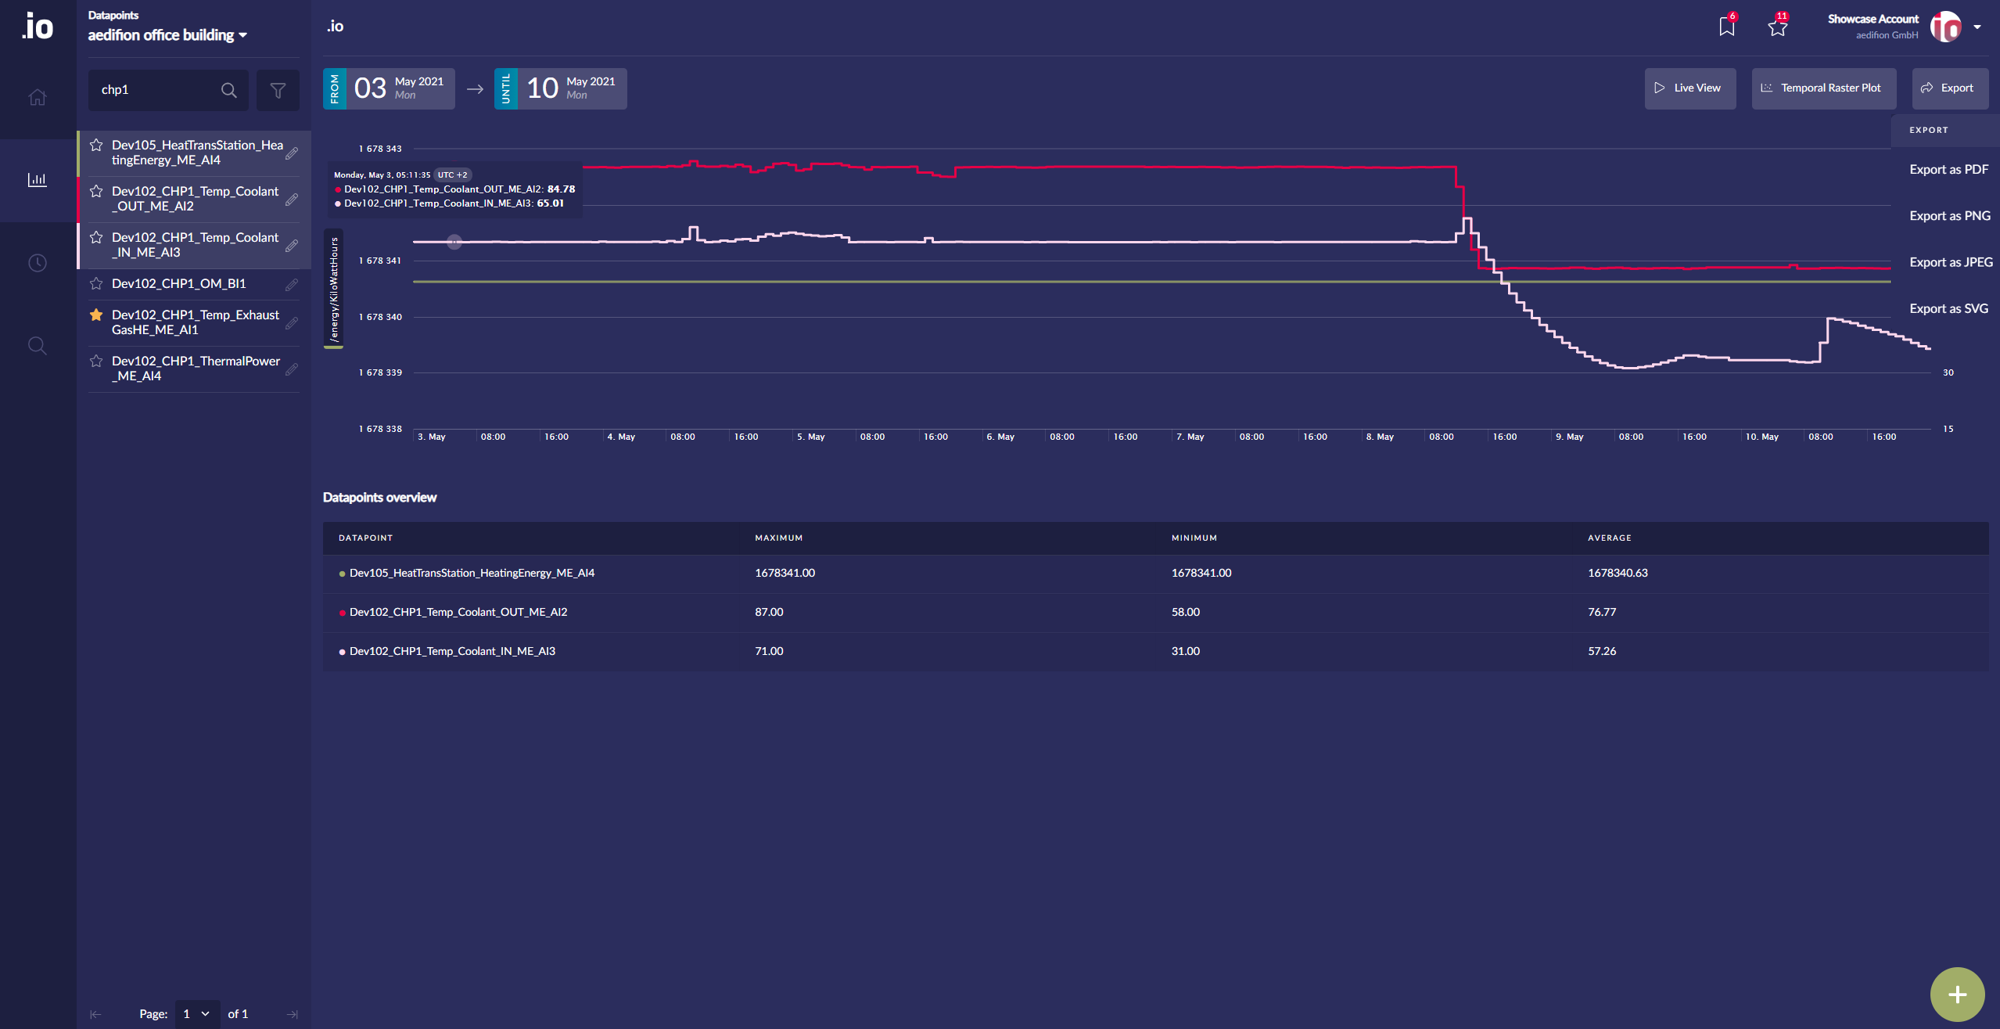
Figure 11: Export a plot to one of the listed file formats
By clicking on the desired file format, the export is started. The created file will be downloaded to your computer. The plot exported as PDF file is shown below.
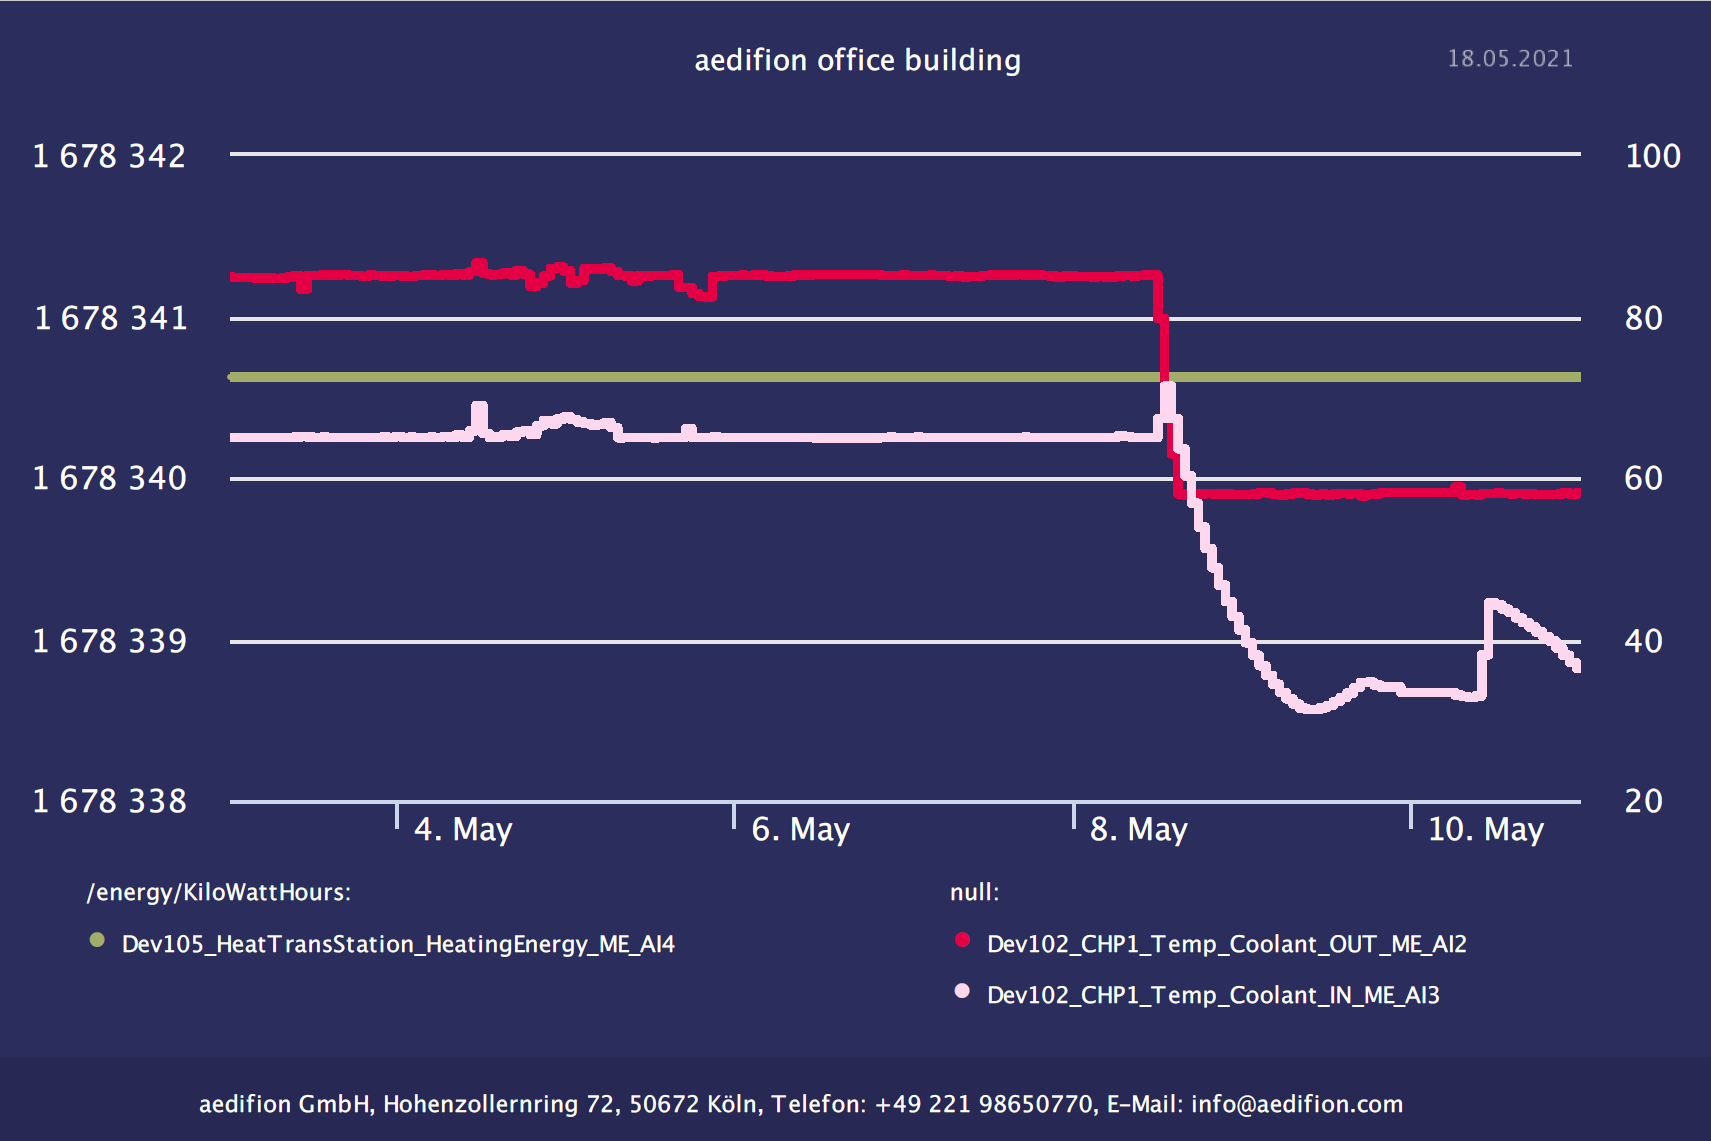
Figure 12: Exported plot as PDF file
Short overview of necessary steps:
- If you have not chosen a project, choose one.
- Select a plotview from the existing ones by clicking on the bookmark icon or create a new plot following steps 2 to 6 from the section about creating and saving plots with multiple datapoints.
- Click on "Export" in the top right corner and select the desired file format.
- The created file is downloaded automatically.